The US Dollar at the Onset of Every Major Global Crisis Since 1973: A Standardized Historical Dataset
Reading time: 8 minutes
Since 1973, the Trade Weighted Dollar Index was higher year-over-year at the onset of 12 out of 17 major global crises (71%) — but this pattern is concentrated in emerging market events (83%), not global systemic breakdowns. Median 12-month change at crisis onset: +3.8%. This page standardizes dollar level, momentum, Fed Funds rate, and real policy rate at the T-0 of 18 major crises. Data: FRED, IMF, BIS.
Context and approach
What was the US dollar doing when each major global crisis erupted? The question is simple but surprisingly under-documented. While academic literature has extensively analyzed the mechanisms of financial contagion and crisis propagation, standardized snapshots of dollar conditions at crisis onset remain scattered across individual case studies.
This page compiles the Trade Weighted Dollar Index level, 12-month momentum, Federal Funds rate, CPI inflation, and real policy rate at the onset of 18 major financial and geopolitical crises under the post–Bretton Woods floating exchange rate regime (1973–2023). All variables are measured using the same methodology, the same data sources, and the same T-0 definition protocol across events. The dataset is descriptive — it does not claim predictive or causal power.
Key statistical findings
The dataset yields four descriptive findings that merit attention. None should be interpreted as causal claims — they describe observed conditions at crisis onset, not predictive relationships.
The dispersion across events is substantial. The 12-month dollar change at crisis onset ranges from −8.6% (Black Monday, October 1987) to +18.3% (China devaluation shock, August 2015). This heterogeneity underscores that dollar behavior at crisis onset reflects the specific nature and geography of each event — not a single repeating mechanism.
Research hub: Eco3min Research & Data Hub
Related dataset: US Dollar Index Dataset (DTWEXBGS)
Historical timeline: Dollar Index and crisis episodes (1973–2025)
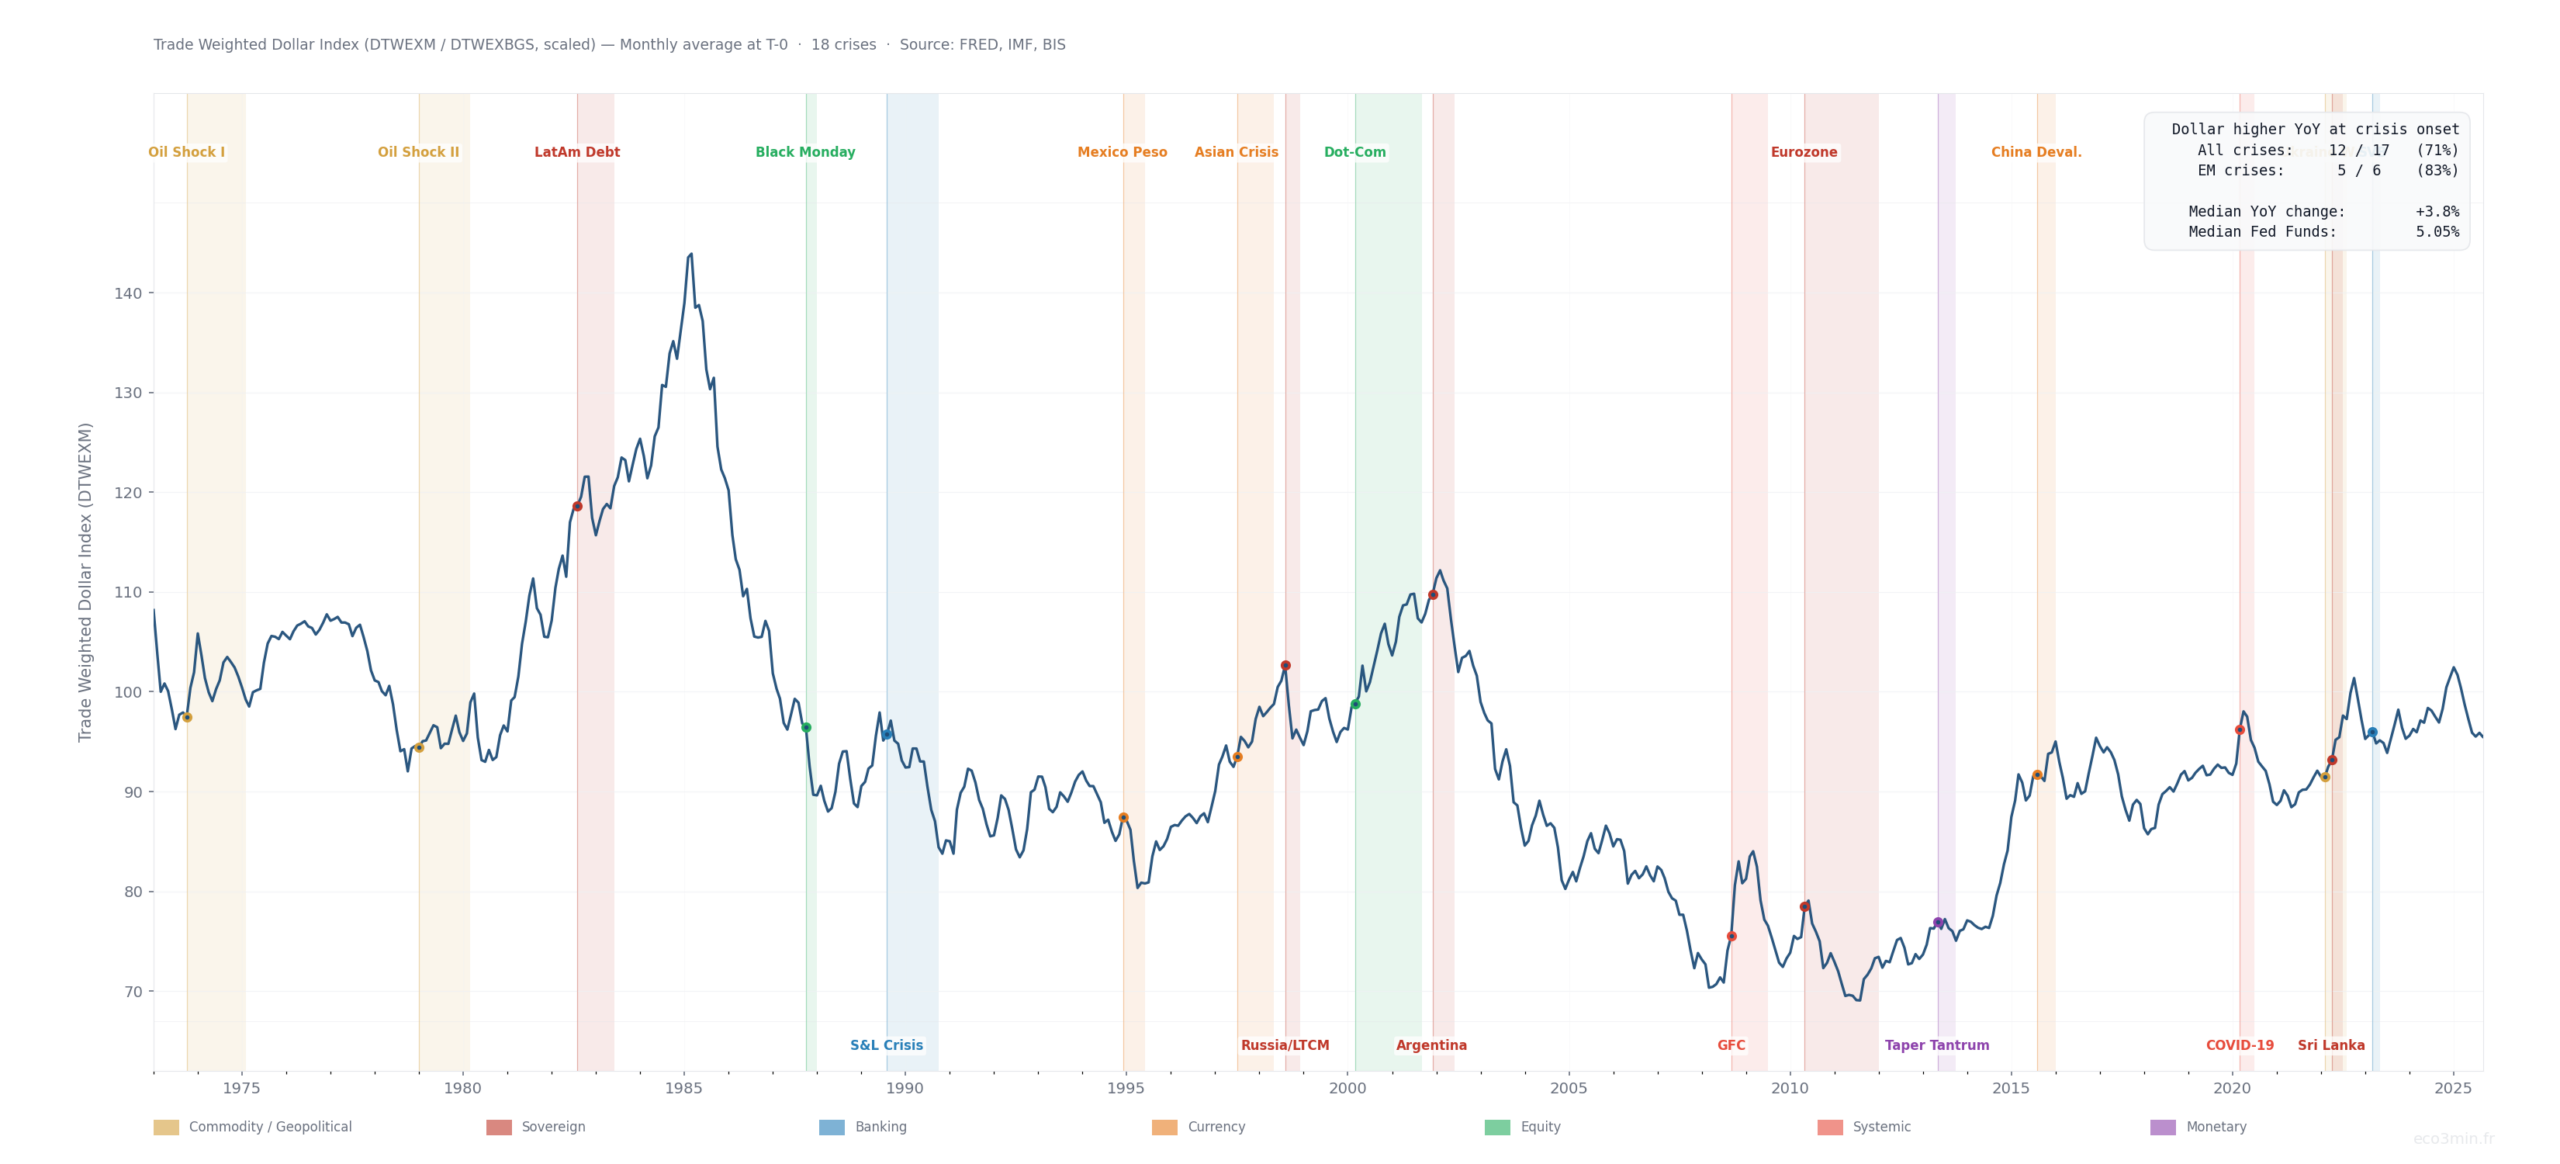
The chart above plots the monthly average of the Trade Weighted Dollar Index (DTWEXM, extended with DTWEXBGS after December 2019) from January 1973 to December 2025. Colored vertical zones mark each of the 18 crisis episodes, classified by type: commodity/geopolitical shocks, sovereign crises, banking crises, currency crises, equity shocks, systemic events, and monetary policy shocks. Dots on the curve mark the exact T-0 month for each event.
Two structural patterns are visually apparent. First, the 1980–1985 dollar surge — driven by the Volcker tightening cycle — coincided with the Latin American debt crisis and preceded Black Monday by two years. Second, the post-2008 era shows a clustering of crises during a prolonged low-rate environment, suggesting that the relationship between dollar level and crisis risk is mediated by the broader monetary regime rather than by dollar direction alone.
Complete dataset: 18 crises (1973–2023)
The table below presents the standardized dataset. All variables are recorded at T-0 (crisis onset month) using monthly averages. The “Dollar YoY” column shows the 12-month percentage change in the Trade Weighted Dollar Index at T-0. “Fed Stance” reflects whether the Federal Funds rate had increased (Tightening), decreased (Easing), or remained within ±50 basis points (Stable) over the preceding 12 months.
| # | Crisis | T-0 | Dollar Index | Dollar YoY | Fed Funds | CPI YoY | Real Rate | Fed Stance | Type | Scope |
|---|---|---|---|---|---|---|---|---|---|---|
| 1 | First Oil Shock (OPEC Embargo) | 1973-10 | 97.5 | N/A | 10.01% | +8.1% | +1.9% | Tightening | Commodity | Global |
| 2 | Second Oil Shock (Iran Revolution) | 1979-01 | 94.5 | −6.6% | 10.07% | +9.3% | +0.8% | Tightening | Commodity | Global |
| 3 | Latin American Debt Crisis | 1982-08 | 118.6 | +6.5% | 10.12% | +6.0% | +4.1% | Easing | Sovereign | Regional/EM |
| 4 | Black Monday | 1987-10 | 96.4 | −8.6% | 7.29% | +4.4% | +2.9% | Tightening | Equity | Global |
| 5 | US Savings & Loan Crisis (FIRREA) | 1989-08 | 95.8 | +1.9% | 8.99% | +4.6% | +4.4% | Tightening | Banking | Global |
| 6 | Mexican Peso Crisis | 1994-12 | 87.4 | −4.6% | 5.45% | +2.6% | +2.9% | Tightening | Currency | Regional/EM |
| 7 | Asian Financial Crisis | 1997-07 | 93.5 | +7.0% | 5.52% | +2.2% | +3.3% | Stable | Currency / Banking | Regional/EM |
| 8 | Russian Default & LTCM | 1998-08 | 102.7 | +7.5% | 5.55% | +1.6% | +3.9% | Stable | Sovereign / Systemic | Global |
| 9 | Dot-Com Bust (NASDAQ Peak) | 2000-03 | 98.8 | +0.8% | 5.85% | +3.8% | +2.0% | Tightening | Equity | Global |
| 10 | Argentina Default | 2001-12 | 109.8 | +4.8% | 1.82% | +1.6% | +0.2% | Easing | Sovereign | Regional/EM |
| 11 | Global Financial Crisis (Lehman) | 2008-09 | 75.6 | −0.6% | 1.81% | +5.0% | −3.2% | Easing | Systemic | Global |
| 12 | Eurozone Sovereign Crisis (Greek Bailout) | 2010-05 | 78.5 | −0.7% | 0.20% | +2.0% | −1.8% | Stable | Sovereign / Banking | Global |
| 13 | Taper Tantrum | 2013-05 | 77.0 | +4.0% | 0.11% | +1.4% | −1.3% | Stable | Monetary | Regional/EM |
| 14 | China Devaluation Shock | 2015-08 | 91.7 | +18.3% | 0.14% | +0.2% | −0.1% | Stable | Currency | Global |
| 15 | COVID-19 Global Shock | 2020-03 | 96.2 | +4.7% | 0.65% | +1.5% | −0.8% | Easing | Systemic | Global |
| 16 | Ukraine War Shock | 2022-02 | 91.4 | +2.7% | 0.08% | +7.9% | −7.8% | Stable | Geopolitical / Commodity | Global |
| 17 | Sri Lanka Default (EM Debt Wave) | 2022-04 | 93.2 | +4.0% | 0.33% | +8.2% | −7.9% | Stable | Sovereign | Regional/EM |
| 18 | US Regional Banking Stress (SVB) | 2023-03 | 96.0 | +3.8% | 4.65% | +4.9% | −0.2% | Tightening | Banking | Global |
Interpretation and structural observations
Several structural observations emerge from the data, though all should be treated as descriptive patterns rather than causal mechanisms.
The dollar-EM vulnerability link is the strongest pattern in the dataset. In 5 out of 6 emerging market or regional crises, the dollar was appreciating on a 12-month basis at crisis onset. The median dollar gain was +4.4%, compared to +1.9% for global systemic crises. This is consistent with the well-documented mechanism by which dollar strength tightens financial conditions for dollar-denominated borrowers in emerging markets — a channel extensively analyzed by the Bank for International Settlements (Borio, 2014; Shin, 2016).For a structural analysis of the dollar’s role in global liquidity and financial stress transmission, see our US dollar & global monetary system framework.
Global systemic crises show no consistent dollar pattern. The 2008 Global Financial Crisis began with the dollar essentially flat (−0.6% YoY), while the 2020 COVID shock started with the dollar up 4.7%. The 1987 Black Monday crash coincided with the dollar falling 8.6% over the prior year. This dispersion suggests that global systemic events are driven by endogenous financial fragility rather than dollar dynamics.
Fed tightening is neither necessary nor sufficient. Only 7 of 18 crises (39%) began during an active tightening cycle. Seven coincided with a stable Fed, and four with outright easing. This challenges the simplified narrative that “the Fed hikes until something breaks.” The relationship between monetary policy and crisis onset is mediated by lag effects, financial structure, and external vulnerabilities — not by the direction of the policy rate alone.
The post-2008 era is structurally different. All seven crises since the Global Financial Crisis have occurred with the Fed Funds rate below 5% (and five of them below 1%). Negative real rates were present in 6 of 7 post-2008 crisis onsets, compared to 2 of 11 before 2008. This regime shift — crises occurring in low-rate, negative-real-rate environments — represents a significant departure from the pre-GFC pattern and warrants further investigation.
Limitations and interpretation boundary
This dataset is descriptive in nature. It does not attempt to establish causality between US dollar movements and crisis events. It does not assess the predictive power of dollar movements — periods of dollar strength without subsequent crisis are not catalogued here. The dataset is intended as a contextual reference tool, not a screening or forecasting instrument. Observing that the dollar was rising before most EM crises does not mean dollar strength caused those crises.
Additional limitations include the heterogeneity of events included (mixing global systemic crises with regional sovereign defaults), the use of DTWEXM rather than the ICE DXY index (chosen for its institutional provenance via FRED), the splicing of DTWEXM and DTWEXBGS for post-2019 events (introducing minor measurement discontinuity), and the absence of a T-0 definition protocol that could be universally agreed upon. The choice of T-0 for some events — particularly the S&L crisis (FIRREA signing) and the Taper Tantrum (Bernanke speech) — reflects conventional dating rather than a single objective criterion.
Methodology
Scope
This dataset covers 18 major global financial and geopolitical crises between 1973 and 2023 under the post–Bretton Woods floating exchange rate regime. Events were selected based on recognition in academic literature or by institutions such as the IMF, BIS, and NBER; evidence of measurable international financial stress; cross-border contagion through currency markets, capital flows, or credit spreads; and a clearly identifiable onset date.
Definition of T-0 (crisis onset)
T-0 is defined as the first month in which the crisis became publicly and financially observable, typically marked by a sovereign default, a currency devaluation, a major financial institution failure, a policy announcement triggering market stress, or a widely recognized geopolitical shock. T-0 does not represent the underlying structural cause of the crisis, but the first clearly observable financial inflection point.
Variables standardized across events
For each crisis, the following variables are recorded at T-0: Trade Weighted Dollar Index level (monthly average); 12-month percentage change in Dollar Index; Federal Funds Effective Rate (monthly); CPI year-over-year inflation (BLS, via FRED); real policy rate (Fed Funds minus CPI YoY); crisis classification by type and systemic scope; and Fed policy stance, determined by the 12-month direction of the Federal Funds rate (Tightening if increased >50bp, Easing if decreased >50bp, Stable if within ±50bp).
Dollar index splicing
The primary dollar measure is the Trade Weighted US Dollar Index: Major Currencies (FRED series DTWEXM), which was discontinued in December 2019. For post-2019 events, the Nominal Broad US Dollar Index (DTWEXBGS) is used, scaled to DTWEXM using the average ratio over the last 12 months of data overlap (scale factor: 0.7952). This ensures cross-event comparability but introduces minor measurement differences for the three post-2019 crisis observations.
Data sources
All primary data are sourced from the Federal Reserve Bank of St. Louis (FRED): DTWEXM (Trade Weighted Dollar Index, Major Currencies); DTWEXBGS (Nominal Broad Dollar Index); FEDFUNDS (Effective Federal Funds Rate); CPIAUCSL (Consumer Price Index for All Urban Consumers). Crisis classification draws on IMF and BIS crisis databases. No forward-looking or model-based adjustments are applied. All values are recorded as observed at T-0.
References
Borio, C. (2014). “The financial cycle and macroeconomics: What have we learnt?” Journal of Banking & Finance, 45, 182–198.
Shin, H. S. (2016). “The bank/capital markets nexus goes global.” Speech at the London School of Economics, November 2016. Bank for International Settlements.
Obstfeld, M. and Zhou, H. (2023). “The Global Dollar Cycle.” Brookings Papers on Economic Activity, Spring 2023.
Reinhart, C. and Rogoff, K. (2009). This Time Is Different: Eight Centuries of Financial Folly. Princeton University Press.
Laeven, L. and Valencia, F. (2020). “Systemic Banking Crises Database II.” IMF Economic Review, 68, 307–361.
This dataset is maintained by Eco3min Research and will be updated when new qualifying crisis events occur. The dataset is freely available for download and citation. Suggested citation: Eco3min Research — The US Dollar at the Onset of Every Major Global Crisis Since 1973, eco3min.fr.
See also: Yield Curve Inversion History: Complete 2s10s Spread Data (1976–2026)