Yield Curve Inversion: How the Credit Channel Triggers Recessions

Yield-curve inversion occupies a special place among leading indicators. Yet the real mechanism linking this signal to cyclical reversals — the bank-credit channel — remains largely misunderstood.
The yield curve does not predict recession — it causes it, via credit.
Yield-curve inversion is not a mere statistical indicator: it represents a causal mechanism that compresses bank intermediation margins, chokes the credit channel, and produces a slowdown in the real economy with a structural lag of 6 to 24 months. This is worked through in inverted yield curve: reading a regime signal without immediate effect.
TL;DR
Yield-curve inversion triggers recessions via the bank-credit channel: compressed net interest margins force banks to tighten lending, producing downturns 6-24 months later: every prolonged 2Y-10Y inversion before 2022 preceded a recession.
- Bank net interest margins are the pivot: when short rates top long rates, maturity transformation squeezes them, pushing banks to tighten lending without any central-bank directive; in aggregate, however, US bank NIM rose from 3.22% in 2024 to 3.30% in 2025 and 3.39% in Q4 2025, its highest since 2019 (FDIC).
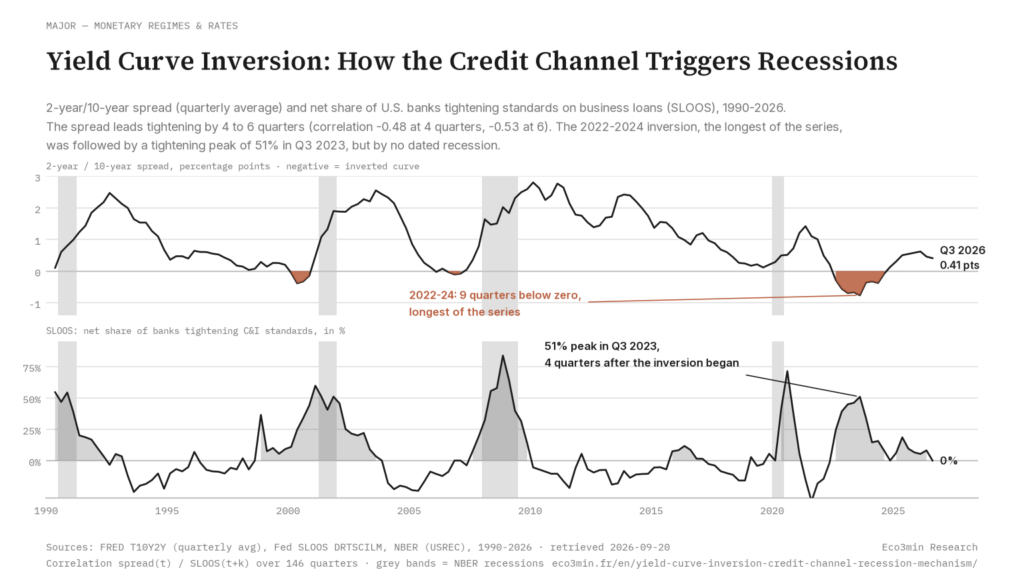
- The signal's record held until 2022: every prolonged 2Y-10Y inversion since the FRED series began in 1976 preceded a recession within 10 to 18 months; the 2022-2024 inversion (26 months, July 6, 2022 to August 26, 2024) was the longest of the series and the first without a dated recession, with re-steepening from August 2024.
What distinguishes this signal from other leading indicators is that it does not only correlate with past recessions — it identifies the mechanism by which monetary tightening turns into an activity contraction. The yield curve is the thermometer of the credit cycle. This mechanism alters how we time investment decisions, fiscal policy, and asset allocation. See our primer on the credit cycle for a fuller treatment.
Since the 1960s, every prolonged inversion of the 3-month/10-year spread in the United States, and since 1976 every prolonged inversion of the 2-year/10-year spread, has preceded an NBER-dated recession, with two exceptions: 1966-1967 and, so far, 2022-2024. The 3-month/10-year pair (FRED series T10Y3M) is the spread the New York Fed uses for its official recession probability model — see the Eco3min framework for the 10Y minus 3M Treasury spread. The full episode-by-episode record across cycles is documented in our deep study on the 2s10s inversion history since 1976. This predictive record is unmatched among macro indicators. Yet debate about the yield curve remains stuck between two reductive readings: the mechanical reading (“the curve inverts, therefore a recession follows”) and the skeptical reading (“this time is different”). Both miss the essential point: the causal mechanism by which inversion transmits to the real economy — the bank-credit channel.
When short rates exceed long rates, banks’ intermediation margins compress. Banks, whose business model rests on maturity transformation (borrow short, lend long), see profitability erode — which leads them to tighten lending conditions, independently of any central-bank directive. This endogenous credit contraction is what turns a market signal into a real slowdown. The yield curve is therefore not an instantaneous cyclical indicator but an intertemporal synthesis of growth expectations, monetary policy expectations and term premium — and reading it through the credit cycle reveals its causal scope.
The yield curve does not predict recession — it causes it, via credit. Inversion compresses bank intermediation margins, which triggers an endogenous tightening of lending standards — a dynamic whose empirical counterpart is documented in our credit spreads and recession risk dataset independent of monetary-policy instructions. This mechanism — formalized by Bernanke & Blinder (1988) and empirically documented by the New York Fed (Estrella & Mishkin, 1998) — preceded each of the five U.S. recessions from 1980 to 2007 on the 2-year/10-year spread (FRED series since 1976), with a lag of 10 to 18 months. The prolonged inversion of 2022-2024, 26 months, was the longest of the series and the first without a dated recession. The causal chain (inversion → margin compression → credit contraction → slowdown) is well established; the open question is how it calibrates in a cycle marked by strong bank balance sheets and unprecedented fiscal buffers. Our reference on regime shifts places them on a common timeline.
Why an inverted yield curve almost always ends in recession
The relationship between yield-curve inversion and recession is not a mysterious statistical correlation: it rests on an identifiable causal chain whose central link is the bank-credit channel. Whether that chain still operates as expected depends in part on the inflation regime — see the complete guide to inflation.
Yield-curve inversion → Bank NIM ↓ → Credit ↓ → Investment ↓ → Recession
Transmission lag: 6 to 24 months. Each link is independently observable in the data.
Trigger: the slope reversal of the curve. In normal conditions the yield curve is upward-sloping: long-term yields exceed short-term yields, reflecting a term premium (compensation for uncertainty at longer maturities) and expected nominal growth. Inversion occurs when tightening pushes short rates above long rates — signalling that markets expect either future growth below current growth or monetary easing ahead in response to an anticipated slowdown. The 2Y-10Y U.S. spread turned negative on July 6, 2022 and remained negative for 26 months, until August 26, 2024: the longest inversion in the FRED (St. Louis Fed) series, ahead of 1978-1980 (20 months).
Transmission channel: compression of bank intermediation margins. The pivotal mechanism runs through commercial banks’ economic model, based on maturity transformation: banks fund short (deposits, interbank market) and lend long (mortgages, corporate loans). When the curve inverts, short-term funding costs exceed yields on long loans — net interest margins (NIM) compress. This mechanism was formalized in a seminal article (Bernanke & Blinder, 1988, “Credit, Money, and Aggregate Demand”) and empirically confirmed by Estrella & Mishkin (1998, New York Fed). FDIC data do not show that compression in aggregate over the 2022-2024 cycle, however: the net interest margin of U.S. banks, around 3.3% in 2023, slipped to 3.22% on average in 2024 before rising to 3.30% in 2025 and 3.39% in the fourth quarter of 2025, its highest since 2019. Deposit costs followed policy rates with a lag and assets repriced upward, which protected the average margin; the squeeze was concentrated in institutions most dependent on market funding. On the same theme: Common mistakes about recessions.
Amplifier: endogenous tightening of lending standards. Margin compression does not only reduce bank profitability: it triggers an autonomous tightening of lending standards. Facing squeezed margins, banks become more selective — shortening offered maturities, increasing collateral requirements, excluding the riskiest profiles. This tightening occurs independently of central-bank instructions: it is a rational bank response to an environment in which credit becomes less profitable. The ECB Bank Lending Survey (Q4 2025) gives the measure: a net 7% of banks tightened standards on corporate loans, citing risk perception and their own risk tolerance. The literature calls this dynamic the “bank lending channel” (Bernanke & Blinder, 1988; Kashyap & Stein, 2000): the way monetary policy transmits to the economy not primarily via rates but via the quantity and quality of credit supplied. On the same theme: the chronology of US contractions.
Macro consequence: slowdown via credit contraction. Reduced credit supply diffuses to the real economy following the sequence documented in the analysis of restrictive monetary policy and delayed effects: financial conditions tighten first, credit flows contract next, investment slows, and employment adjusts last. The lag between inversion and the official recession start (NBER) ranged between 10 and 18 months over the five 2Y-10Y inversions completed before 2022 (17 months in 1978-1980, 10 in 1980-1981, 18 in 1989-1990, 13 in 2000-2001, 16 in 2006-2007), a range explained by varying buffers (corporate balance sheets, household savings, fiscal impulses) but never invalidating the causal mechanism itself.
Where the signal stands (September 2026). The 2022-2024 inversion has stepped outside the template: 26 months below zero, a trough of -108 basis points on July 3, 2023, re-steepening on August 26, 2024, and twenty-five months later no recession dated by the NBER. Credit did tighten, but before and during the inversion rather than after it: the net share of U.S. banks tightening standards on business loans went from 24 percent in July 2022 to a peak of 51 percent in July 2023, then to zero in October 2024 (Fed, SLOOS), and the aggregate net interest margin was not compressed (FDIC). The 2Y-10Y spread stood at +0.25 points on September 18, 2026; the unemployment rate was 4.1 percent in August 2026 (BLS). The mechanism described here remains the reference causal reading of the 1978-2007 cycles; the 2022-2024 cycle is, for now, its first documented exception.
- 5 out of 5, then 1: every prolonged 2Y-10Y inversion completed before 2022 (FRED series since 1976) preceded an NBER recession; 2022-2024 is the first without a dated recession. Source: FRED, NBER.
- Observed lag: 10 to 18 months between initial inversion and official recession onset across those five episodes; 6 to 24 months in the literature. Source: FRED, NBER; Estrella & Mishkin, 1998.
- 2022-2024 inversion: 26 months in negative territory (July 6, 2022 to August 26, 2024), the longest of the series, ahead of 1978-1980 (20 months). Source: FRED (T10Y2Y series).
- U.S. bank NIM: no aggregate compression: 3.22% in 2024, 3.30% in 2025, 3.39% in Q4 2025, the highest since 2019. Source: FDIC.
- 1998, a near miss: the spread spent only 18 consecutive sessions below zero (trough -7 basis points), not a prolonged inversion; the LTCM crisis followed, not a recession. Source: FRED, NBER.
What the consensus gets right — and the mechanism it overlooks
The dominant reading, voiced by a significant fraction of market economists and large investment-bank outlooks, argues reasonably that the yield curve’s predictive power may have eroded. Embedded in that signal is the term premium, which reflects how inflation expectations are formed and anchored. Unconventional policies (QE) allegedly distorted long yields, excess savings after the pandemic may have delayed transmission, and stronger bank balance sheets might reduce credit sensitivity to margin compression. The central scenario — a soft landing — assumes these buffers are sufficient to break the historical causal chain.
This diagnosis has merit. Banks’ balance sheets are indeed stronger than in 2007 (CET1 ratios of major U.S. banks near 13% end-2025 vs. 8% in 2007, Fed data). Excess household savings served as a temporary buffer, though ECB estimates indicate much of it has been drawn down in the euro area. Fiscal impulses (Infrastructure Investment and Jobs Act in the U.S., European recovery plans) have partially offset tightening — but their effects are fading.
However, the “this time is different” reading underestimates one structural point: buffers determine how long the mechanism takes to materialize, not whether it will. The credit channel is slowed, not neutralized.
Examination of the economic-cycle structure as revealed by the yield curve suggests the relevant question is not “will inversion precede a recession this time?” but “how fast and with what intensity does the credit channel transmit the signal?” Bank Lending Survey data and NIM evolution indicate transmission is underway — merely slower than in previous cycles.
Expecting a rapid macro pivot after inversion and declaring the signal invalid if a slowdown does not materialize within months. Inversion produces its effects via progressive compression of bank margins and cumulative credit tightening — a process that unfolds over 6 to 24 months. Post-inversion cyclical resilience reflects the transmission lag, not the signal’s failure. The 2000 and 2006 inversions followed the same pattern: resilient growth for quarters, then reversal.
| “This time is different” reading | Credit-channel reading | |
|---|---|---|
| Core assumption | QE and stronger balance sheets neutralized the signal | Buffers delay transmission; they do not cancel it |
| Observed signal | Post-inversion resilience of growth and employment | NIM compression, endogenous credit tightening |
| Analysis horizon | 6–12 months post-inversion | 12–30 months, with sequential accumulation |
| Main risk | Underestimating the rebound if the soft landing occurs | Underestimating delayed slowdown due to overconfidence |
| Key variable | Nominal spread, employment, GDP | Bank NIM, Bank Lending Survey, credit flows, term premium |
Buffers, non-linearities and feedback loops: why timing remains unpredictable
The causal mechanism is identifiable, but its timing depends on factors that introduce irreducible complexity.
Cyclical buffers: balance sheets, savings, fiscal support. Strong corporate balance sheets — bolstered by high profits in 2021–2023 — are the first buffer. Firms with cash reserves can sustain investment despite tighter bank credit by using internal funds or accessing bond markets. This protects large firms; SMEs reliant on bank credit do not enjoy the same shield. Excess household savings accumulated during the pandemic acted similarly but temporarily: ECB estimates (2025) suggest much of it has been depleted in the euro area, removing a protective factor. Taken from the ECB Economic Bulletin. Fiscal impulses have partially compensated, but their cushioning effect is waning. In the same vein: Common mistakes about credit and spreads.
Non-linearities and threshold effects. Transmission via the credit channel is not linear. As long as bank margins stay above a minimal profitability threshold, institutions absorb compression without materially changing credit supply. But once that threshold is crossed, tightening accelerates abruptly — especially if banks anticipate portfolio-quality deterioration. Historical FDIC data show no aggregate threshold: the average net interest margin of U.S. banks fell below 3.0% only in 2015 and in 2020, outside any credit contraction, and stood between 3.15% and 3.47% in 2006-2008. The threshold, if one exists, is specific to each institution and its funding structure, not to the aggregate.
Credit-activity-credit feedback loop. Once triggered, credit contraction tends to be self-reinforcing: tighter credit slows activity, which weakens borrower quality — a feedback loop that often surfaces first in high-yield credit spreads as a leading indicator, which prompts further bank tightening — the financial accelerator loop formalized by Bernanke & Gertler (1995). This feedback helps explain why recessions following inversion can be deeper than linear models predict: the shift from ordered slowdown to self-sustaining contraction is non-linear and often occurs at a point that standard indicators do not flag precisely.
Re-steepening as a complementary signal. Inversion is not the only relevant signal: re-steepening (return to a positive slope) often provides a more immediate indicator. Historically, recessions have more closely coincided with the re-steepening phase than with inversion itself — because re-steepening signals that markets now expect monetary easing in reaction to an already-underway slowdown. The 2Y-10Y spread re-steepened on August 26, 2024, moving back into positive territory, a signal that in the 2000-2001, 2006-2007 and 1989-1990 cycles coincided with recessionary effects materializing within the following months; as of September 2026, twenty-five months later, none has been dated. A closer look: Our explainer on curve steepening and flattening.
Implications for reading the current cycle
If the credit-channel framework is valid, it changes how we interpret several ongoing dynamics.
For cyclical diagnosis. The 2022-2024 inversion, the longest of the series, exerted unprecedented cumulative pressure on banks’ funding conditions, without translating into a compression of the aggregate margin. The ongoing re-steepening does not signal the end of risk — in historical terms it signals the start of the materialization phase. Structural lags of macro indicators add further delay. The most relevant data to assess transmission sit in credit flows, lending standards (Bank Lending Survey) and bank margins — not in quarterly GDP, which records effects at the end of the chain.
For financial-market reading. One documented paradox is equities rising during inversion, then correcting on re-steepening — precisely when the causal mechanism begins producing real effects. This dynamic, analysed in the context of central banks and equity markets, implies the current re-steepening is a warning signal for valuations, especially in credit-sensitive segments (small caps, cyclicals, listed real estate). The first half of that sequence — the climb before the turn — is explained in why markets can rise with an inverted yield curve. Market anticipation dynamics can mask real transmission for quarters.
For monetary policy. Inversion creates a structural dilemma for central banks: holding rates high to fight inflation compresses bank margins and chokes the credit channel — but easing too early risks rekindling inflation before disinflation is consolidated. This dilemma is harder because transmission occurs with delay: central banks decide on data that reflect past transmission, not its current state. Coupling with the broader monetary-policy and interest-rate framework confirms the dilemma is structurally insoluble.
Invalidation condition. This framework would be invalidated if rapid easing restored a normal positive slope and stabilized bank margins before credit contraction reached its peak impact — a “successful soft landing” scenario compatible with current data but not guaranteed. It would also be invalidated if a productivity shock (AI) or massive fiscal impulse offset credit contraction via alternative financing channels. Conversely, a return of inflation forcing prolonged high short rates would amplify margin compression and accelerate recessionary materialization. Related explainer: Our explainer on the soft landing.
Three horizons to monitor signal transmission
Short horizon (0–6 months): re-steepening is underway, which historically coincides with the start of recessionary effects materializing. Priority indicators: bank NIMs (FDIC, ECB), Bank Lending Survey (standards and tightening motives), corporate credit flows, and the evolution of the 10-year term premium (ACM model, New York Fed). Short-term risk is non-linear crystallization if the margin of the banks most dependent on market funding falls below their profitability threshold. The data behind this: our ACM term-premium series.
Cycle horizon (1–3 years): the decisive question is the speed at which the curve’s slope normalizes and whether it restores margins before the credit-activity loop fully engages. If easing is sufficient and bank balance sheets hold, a soft landing remains feasible — but credit slowdown will weigh on potential growth. Interaction with the real economic cycle and investment dynamics will determine whether adjustment remains orderly. Desynchronization of cycles adds complexity: U.S. and European curve signals are offset, making global reading ambiguous.
Structural horizon (5+ years): the current cycle tests the yield curve’s predictive power in a post-QE world. If the credit-channel mechanism holds despite novel buffers, it will validate the signal’s structural robustness over half a century of data. If instead a full soft landing occurs without recession, academic debate must determine whether buffers temporarily neutralized the credit channel or whether banking maturity transformation has structurally changed under a higher-rate regime. This raises questions about the structural limits of monetary policy.
The yield curve does not merely correlate with recessions — it causes them via the bank-credit channel. The full set of macro-financial series and research underlying this framework is gathered in the Eco3min research and data hub. Inversion compresses intermediation margins, which triggers endogenous credit tightening and slows the real economy with a 6–24 month lag. Post-inversion resilience reflects the transmission delay, not signal invalidation. The August 2024 re-steepening was, in the historical pattern, a materialization signal; two years on, that pattern has not played out. Buffers (strong balance sheets, fiscal impulses) lengthen the lag and may reduce amplitude, but do not break the causal chain.
Robust: The inversion’s predictive power is documented across the five 2Y-10Y inversions completed before 2022 and eight of the nine 3-month/10-year inversions since 1966 (Estrella & Mishkin, 1998; New York Fed). The raw 10Y–2Y spread series powering this analysis is available as our open dataset of yield curve inversions. The causal channel via bank-margin compression and credit tightening is theoretically formalized (Bernanke & Blinder, 1988) and empirically supported by Bank Lending Surveys and NIM data (FDIC). Re-steepening as a materialization signal is consistent with the last five cycles.
Uncertain: The effectiveness of current buffers (post-2010 bank balance sheets, fiscal impulses, bond-market substitution for bank credit) to permanently break the causal chain is not decided. Precise calibration of the lag in the current cycle is uncertain — the 6–24 month amplitude makes precise dating impossible. The role of the term premium (compressed by past QE) in distorting the signal remains academically contested. A complete soft landing, of which the 2022-2024 episode would be the first instance since 1966, remains possible as long as the NBER has dated no recession.
Regular monitoring of the weekly macro checkpoint allows this framework to be confronted with the latest bank-margin, credit and financial-condition data. Several trajectories remain open, but reading inversion through its causal mechanism — the credit channel — provides a more robust framework than observing the curve’s shape alone to anticipate the timing and intensity of transmission to the real economy.
- Yield-curve inversion does more than correlate with recessions — it identifies the causal mechanism: compression of bank intermediation margins triggers endogenous credit tightening that slows the real economy.
- The empirical record is unparalleled: the five prolonged 2Y-10Y inversions completed before 2022 preceded an NBER recession, with a 10-18 month lag; 2022-2024 is the first without a dated recession.
- Post-inversion cyclical resilience illustrates transmission lags (cyclical buffers), not signal invalidation. Buffers delay materialization; they do not neutralize the mechanism.
- The August 2024 re-steepening was, in the historical pattern, a materialization signal for recessionary effects; two years on, no recession has been dated.
- This framework is invalidated if a complete soft landing occurs, which the 2022-2024 episode has so far delivered, or if bond markets sufficiently substitute for bank credit to neutralize the transmission channel.
Last updated — 20 September 2026
Disclaimer – Financial Information: The analyses, commentary, and content published on eco3min.fr are provided for informational and educational purposes only. They do not constitute investment advice or a solicitation to buy or sell financial instruments. Past performance is not indicative of future results. All investment decisions involve risk and are the sole responsibility of the reader.
Read next
Full pillar →Real Interest Rates: The Quiet Signal Reshaping Markets
Real interest rates: why their persistence in positive territory in 2026 is reshaping the rules for bonds, equities,…
OAT-Bund Spread: A Quiet Gauge of French Sovereign Risk
OAT-Bund spread: how this yield gap has become a key signal on French sovereign risk, fiscal policy and…
Inverted Yield Curve: Reading a Regime Signal Without Immediate Effect
The inverted yield curve operates as a regime signal, not a timing tool. Its lagged effects are constitutive…