
Commodity Regimes: Physical Constraints, Energy Transition, and Global Economic Cycles
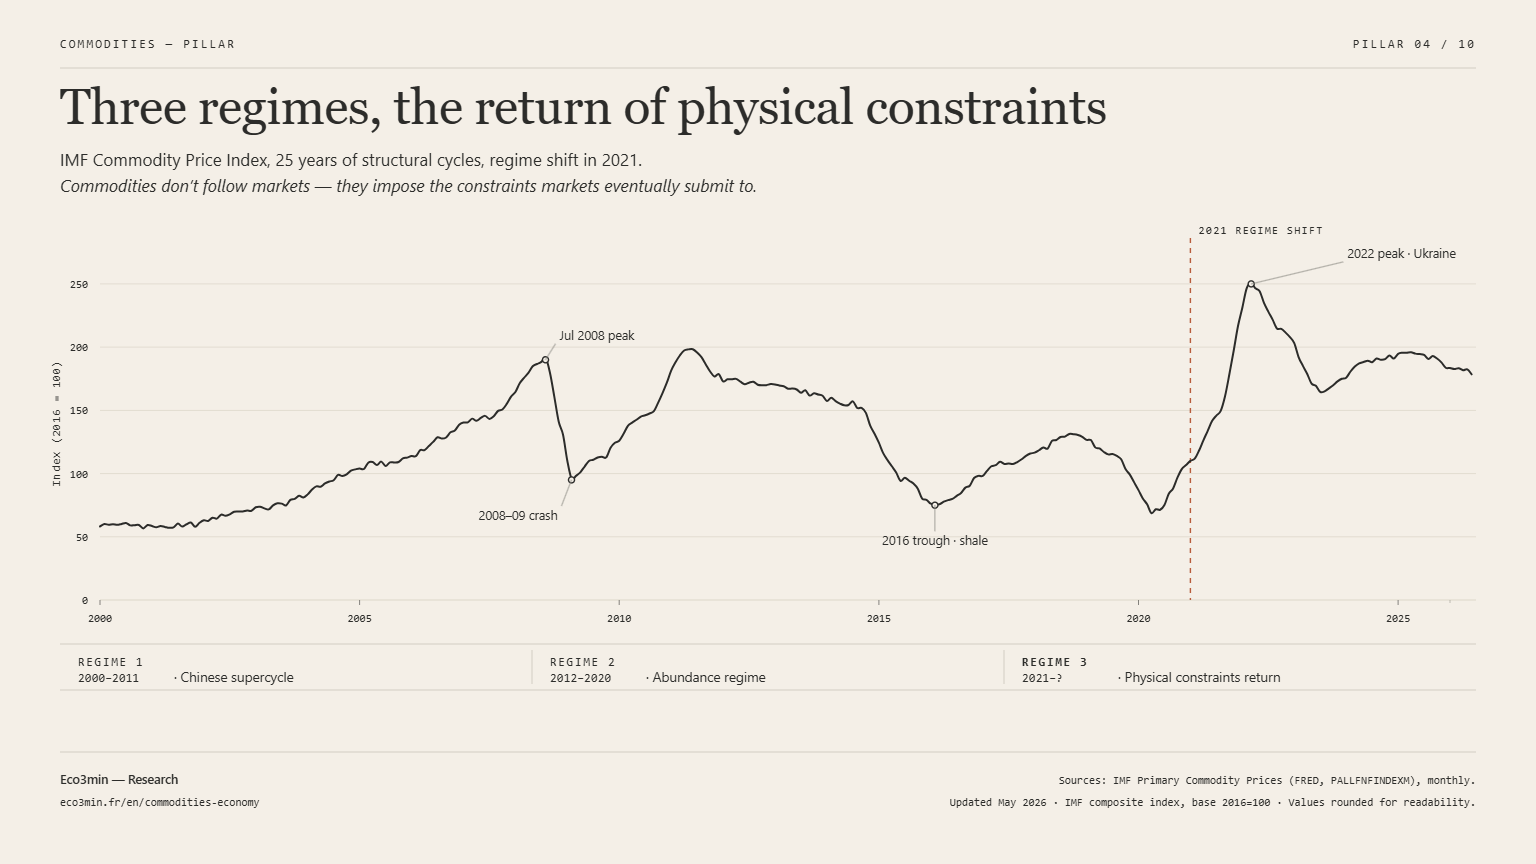
Commodities do not follow markets: they impose the constraints to which markets ultimately submit.
Geological, energy and logistics constraints : the physical determinants that shape economic cycles, inflation and geopolitical balances.
Commodities do not follow markets. They impose the constraints to which markets ultimately submit.
Commodities are not assets like the others. They are physical constraints (geological, energy, climatic, logistical) that impose themselves on the economic system and which neither central banks, financial markets nor fiscal policy can escape. When European natural gas multiplies by 17 in eighteen months (TTF 20 → 340 €/MWh, ICE, 2021–2022), that is not a “market move”: it is the brutal realization of an energy dependency that decades of industrial policy had not corrected. When copper inventories fall to the equivalent of a few hours of global consumption (15,000 tonnes, LME, end-2023), that is not a technical signal: it is a warning that the energy transition is colliding with the inertia of mining capacity. And when the closure of the Strait of Hormuz removes more than 11 mb/d of production from the market in May 2026 relative to pre-conflict levels (EIA) and sends Brent to $116 on 9 March (ICE), that is not merely a risk premium: it is a reminder that roughly one-fifth of the global trade in oil and LNG moves through a single channel.
For the foundational mechanisms this pillar builds on (inflation, rates, cycles), see our investing for beginners hub.
The question that structures this pillar is not “where will commodity prices go?”. It is: what do commodity markets tell us about the physical constraints facing the real economy, the stage of the investment cycle, and the geopolitical power relations that shape access to resources?
Key questions to understand commodities and physical constraints
This pillar constitutes the analytical framework dedicated to commodities within the Eco3min architecture. It does not duplicate the Markets pillar, which treats price formation across asset classes, nor the Macroeconomics & geopolitics pillar, which treats macro regimes. Here the object is specific: irreducible physical constraints (supply, demand, stocks, production costs, geographic concentration) and their transmission to economic cycles, inflation and geopolitical balances. The sub-pillars Price formation, Cycles & macro transmission, Resource geo-economics, Energy constraints and Agricultural commodities develop this framework.
The structural tension: slow physical constraints, fast financial trade-offs
The market for a commodity is the meeting point of two fundamentally different logics. The physical logic evolves on long time horizons: developing a copper deposit takes 10–15 years (S&P Global Market Intelligence), building an LNG terminal requires 4–7 years and $10–15 billion (IEA), oil investment cycles run 5–10 years (Rystad Energy). The financial logic evolves in real time: net speculative positions on WTI swing between +200,000 and +500,000 contracts (CFTC), open interest on commodity futures exceeds $3.5 trillion (BRI, 2023), commodity ETFs have net inflows of over $100 billion since 2020 (Bloomberg).
Geology, investment, infrastructure: supply evolves over decades and cannot be decreed.
- Copper deposit: 10-15 years
- LNG terminal: 4-7 years, $10-15bn
- Observed field decline: 5.6%/yr
Speculative positions, ETF flows, risk premia: finance reprices in real time what the physical takes years to adjust.
- Net WTI positions: ±200-500k contracts
- Commodity futures: > $3.5tn
- ETF flows: > $100bn since 2020
This asymmetry of time horizons produces sometimes-persistent gaps between market prices and physical reality, and it is inside these gaps that the most important signals hide. When price reflects financial expectations but physical reality does not follow (an expected surplus that does not materialize, an anticipated demand that never comes), the correction is usually violent. March 2022: Brent hits $140 on the geopolitical shock of the Russian invasion (ICE) while physical supply fell by only 1 mb/d; the price reflected a financial risk premium, not a proportional physical deficit. August 2022: TTF touches €340/MWh (ICE) while European storage was already refilling; the price reflected supply panic, not the state of actual flows. The Price formation sub-pillar formalizes this mechanism in depth, and the reference article Physical supply vs financial demand provides the fundamental analysis.
2000–2011: the Chinese industrial supercycle
The largest wave of industrialization in history triples commodities, and triggers a massive investment boom.
The last major commodity supercycle was triggered by the largest wave of industrialization in human history. Between 2000 and 2015 China consumed more cement than the United States did during the entire 20th century (USGS). Its copper demand quintupled (ICSG), its oil demand more than doubled (IEA), and its steel production multiplied by five to reach 50% of global output (World Steel Association). The Bloomberg Commodity Index tripled between 2001 and 2008.
This supercycle produced a massive investment boom in production capacity. Global investments in oil exploration & production reached $700 billion per year at the 2014 peak (IEA). Global mining investment exceeded $200 billion per year between 2011 and 2013 (S&P Global MI). New capacities (US shale oil, Canadian oil sands, copper mines in Peru and Mongolia, lithium mines in Australia) entered production between 2012 and 2018, creating a structural supply surplus that weighed on prices for almost a decade.
2012–2020: the abundance regime, overinvestment and the destruction of discipline
The prior decade’s overinvestment floods the market: Brent −77%, collapsing investment, concentrating supply.
The down cycle of 2012–2020 resulted directly from the overinvestment of the prior decade. Brent fell from $115 in June 2014 to $27 in January 2016 (ICE), a 77% drop, due to the rise of US shale (US production from 5 to 13 mb/d between 2008 and 2019, EIA), slowing Chinese demand and an OPEC market share war. Copper fell from $10,000/ton in 2011 to $4,300 in 2016 (LME). Iron ore fell from $190 to $40/ton (Platts). Eco3min’s panorama of regime shifts gathers these episodes.
This low-price regime produced two structural consequences for the current regime. First, the collapse in investment: oil E&P spending was halved between 2014 and 2020 ($700 → $370bn, IEA), mining investment fell by 30% (S&P Global MI), and the number of large copper discoveries dropped from 5–10 per year in the 2000s to 1–2 per year since 2015 (S&P Global MI). Second, the concentration of supply: marginal producers were eliminated, M&A consolidated the majors, and market power concentrated; OPEC+ emerged in 2016 to collectively manage oil supply.
Covid was the inflection point. The demand collapse in 2020 (oil -9 mb/d, IEA; copper -2%, ICSG) destroyed remaining surpluses and drained inventories. WTI briefly went negative in April 2020 (-$37.63, NYMEX), an unprecedented event reflecting a non-storable physical surplus. Paradoxically, this final destruction set the conditions for the subsequent reversal.
2021–?: the new regime, the return of physical constraints
Supply becomes the dominant force again, but not in a straight line: anticipated oil surplus in 2025, Hormuz shock in 2026, copper and gold at record highs.
The regime emerging since 2021 is characterized by the return of supply constraints as the dominant force in commodity markets, after a decade where demand and finance dominated. The regime is not linear: in 2025, the gradual unwinding of OPEC+ cuts and strong non-OPEC supply tipped the oil market into an anticipated surplus, even as copper, gold and lithium tightened. The first half of 2026, with the closure of the Strait of Hormuz, was a reminder that in a physical-constraints regime, an accounting surplus can turn into a logistical shortage within days. Three structural forces converge to define this regime.
Three structural forces converge
After a decade where demand and finance dominated, supply becomes the binding constraint again, under three mutually reinforcing forces.
Upstream oil investment fell 6% in 2025 (IEA), even as decline rates at existing fields accelerate.
Energy constraints →Dependence shifts from fossil fuels to copper, lithium, cobalt, with insufficient mining capacity.
Price formation →Extreme concentration of production and refining: resources become levers of power.
Geo-economics →Chronic underinvestment in hydrocarbons
Upstream oil investment fell by 6% in 2025, to around $420 billion (IEA, Oil 2025): the first decline since 2020 and the largest since 2016, decided in a market forecasters then saw as oversupplied. Yet decline rates at existing fields are accelerating. The observed post-peak decline rate averages 5.6% per year for conventional oil, and without investment global production would lose roughly 5.5 mb/d every year, the equivalent of Brazil and Norway combined (IEA, The Implications of Oil and Gas Field Decline Rates, September 2025). Nearly 90% of upstream investment already goes to offsetting these declines rather than meeting demand growth. US shale, the “swing producer” of the 2014–2019 decade, is maturing: tight-oil spending fell by almost 10% in 2025 (IEA) and new-well productivity is declining as sweet spots deplete (EIA Drilling Productivity Report).
The 2025–2026 sequence provided a full-scale demonstration of what spare capacity is for. OPEC+ cuts peaked at 5.85 mb/d until April 2025, before a gradual unwinding of roughly 2.9 mb/d of quotas between April and December 2025, then a pause as the market faced an anticipated 2026 surplus (OPEC). The closure of the Strait of Hormuz, triggered by the US-Iran conflict in late February 2026, then removed more than 11 mb/d of Middle East production in May relative to pre-conflict levels (EIA): Brent went from around $61 at end-2025 to $116 on 9 March 2026 (ICE), before falling back toward $70 in early July as the strait progressively reopened. The episode also fractured the cartel itself: the United Arab Emirates left OPEC on 1 May 2026. The EIA now expects global oil demand to contract by 1.1 mb/d over 2026 (STEO, June 2026), a direct consequence of the price shock. Field analyses are developed in the Resource Geo-economics sub-pillar.
The energy transition: an explosion in metals demand
The energy transition does not reduce dependence on raw materials: it shifts it from hydrocarbons to metals. An electric vehicle requires six times more copper than an internal-combustion vehicle (IEA). An offshore wind turbine requires 8 tonnes of copper (Copper Alliance). Lithium demand is expected to multiply by 7 by 2040 (IEA, Critical Minerals Market Review). The IEA estimates a cumulative investment shortfall of $360 billion by 2030 in critical minerals, to which the demand from AI data centres now adds a further layer.
The copper signal is structural. LME inventories had fallen to 15,000 tonnes at end-2023, the equivalent of a few hours of global consumption, versus a 200,000–400,000 tonne average in the prior decade (LME). The May 2024 record ($11,000/ton) has since been shattered: copper broke $13,000 on 5 January 2026 and set an all-time high of $14,527.50 on 29 January (LME), driven by the mine disruptions of 2025 (Grasberg, Kamoa-Kakula, El Teniente), electrification demand and the anticipation of US tariffs. The geography of inventories has become a signal in itself: since Washington’s 50% tariffs on semi-finished copper products in August 2025, and in anticipation of tariffs on refined copper, global stocks have migrated to the COMEX (a record of roughly 650,000 tonnes in June 2026) while LME stocks fell back to around 352,000 tonnes (COMEX, LME). Lithium keeps illustrating the violence of adjustments in these narrow markets: roughly $15,000/ton at end-2020, $80,000 at end-2022, back to about $8,300 in June 2025, then a near-tripling to around $26,000 by late January 2026 (Fastmarkets, Benchmark Mineral Intelligence), driven by the boom in stationary storage and production suspensions in China.
Geopolitical fragmentation: resources as instruments of power
The geographic concentration of production and refining creates unprecedented strategic levers. China controls 60% of rare earths production, 70% of cobalt refining, 80% of graphite processing (USGS/IEA). The Congo produces 70% of world cobalt (USGS). Australia and Chile produce 70% of lithium (USGS). Russia produces 40% of world palladium and supplied 40% of European gas before 2022 (Johnson Matthey, Eurostat). This concentration turns commodities into levers of indirect economic policy, a framework detailed in our study of commodities as instruments of economic policy.
The use of these resources as geopolitical levers has become institutionalized. After gallium and germanium (August 2023), graphite (December 2023) and antimony (August 2024), China prohibited in principle exports of these materials to the United States (December 2024, MOFCOM), then placed seven medium and heavy rare earths and their permanent magnets under licensing (April 2025): by early 2026, exports of yttrium, dysprosium and terbium were still running roughly 50% below their pre-restriction baseline (Chinese customs). The extraterritorial extension announced in October 2025, covering any product containing more than 0.1% Chinese-origin rare earths, was suspended for one year after the US-China trade truce of November 2025: the lever now works in both directions, escalation and de-escalation. Consumer countries respond with diversification strategies (US Critical Minerals Act, EU Critical Raw Materials Act), but building alternative capacity takes decades, not years. The Russian invasion of Ukraine had already demonstrated the consequences of uncorrected energy dependence: the cost to Europe exceeded €200 billion in 2022 (Bruegel), and output in Germany’s energy-intensive industrial branches in 2025 was still 17.8% below its 2021 level (Destatis), in a broader context of geopolitical fragmentation reshaping global financial and resource systems.
Three transmission channels to the real economy
Commodities affect the real economy through three distinct channels, whose understanding is essential to interpret the signals they deliver.
Channel 1: inflation, the most direct vector
Commodities are the primary channel through which supply shocks transmit to inflation. Each $10/barrel rise in Brent adds roughly 0.2–0.4 percentage points to headline inflation in importing countries over 6–12 months (ECB, Economic Bulletin). The energy component alone explained 3–4 percentage points of inflation at the 2022 peak (Eurostat, BLS), and the first half of 2026 reactivated this channel in real time: after the closure of Hormuz, the EIA raised its 2026 forecast for US wholesale gasoline prices by around 50% relative to its pre-conflict scenario (STEO, June 2026). This commodity-to-price transmission is placed in its broader macro framework in the complete guide to inflation regimes. Agricultural commodities produce politically sensitive food inflation: the 2008 food riots (FAO) and the 2011 North Africa instability were directly linked to cereal price spikes. Wheat jumped 60% after the invasion of Ukraine (CBOT), with Russia and Ukraine accounting for roughly 30% of global exports (FAO). Cocoa prices tripled in 2024 to exceed $10,000/ton (ICE) due to drought in Côte d’Ivoire and Ghana (70% of world production, ICCO). The ECB estimates that supply-chain fragmentation and energy constraints add 1–2 percentage points of structural inflation per year (Economic Bulletin, 2023). The study Commodities, inflation and monetary policy shows how these supply shocks translate into monetary-policy trade-offs and real-rate adjustments. This channel is analyzed in detail in the Cycles & macro transmission sub-pillar and in the Monetary policy & rates pillar.
Channel 2: the industrial cycle, commodities as a leading indicator
Copper is called “Dr. Copper” because its movements tend to anticipate inflections in global industrial production with an empirical lag of 3–6 months (IMF Working Paper, 2019). This empirical mechanism is documented in depth in our reference study on commodities as leading signals of the cycle, and the historical record behind it in the copper-gold ratio against bond yields. China consumes 55% of global copper, 50% of steel and 50% of coal (USGS, IEA, World Steel Association): when China slows, industrial commodities send a global deceleration signal before GDP statistics. This signal was accurate in 2015 (Chinese slowdown: copper -25%, Brent -50%) and mid-2022 (Chinese property tightening: iron ore -30%). Gold, by contrast, is a barometer of confidence in the monetary system: its rise from $1,060 an ounce in 2015 to a peak of $5,405 in January 2026 (LBMA) reflects a progressive re-pricing of monetary fragmentation risk, amplified by massive central bank purchases (1,037 tonnes in 2023, 1,045 in 2024, 863 in 2025, WGC).
Channel 3: competitiveness and terms of trade
Commodities determine the terms of trade between producing and consuming countries, and therefore relative competitiveness. A related angle: the refining margin as the hidden driver of oil profits. Europe’s €200 billion energy penalty in 2022 (Bruegel) constituted a massive wealth transfer to energy producers (Norway, Qatar, United States). Indonesia banned raw nickel ore exports in 2020 to force domestic refining, and its share of global nickel refining rose from 6% to 40% in five years (USGS). The United States, now a net exporter of oil and LNG, has a structural advantage that Europe and China (net importers) lack; the closure of Hormuz illustrated it, lifting US net exports of crude and petroleum products to a record 5.8 mb/d in April 2026 (EIA). That advantage translates into industrial competitiveness gaps documented in the Macroeconomics & geopolitics pillar.
Analyzing commodity prices as isolated signals. Oil, gas, copper and critical minerals form an interconnected system: energy conditions extraction costs for metals (aluminum is a “bar of electricity”), metals condition the capacity for an energy transition, and the transition redefines energy demand. The relevant signal is not the price of a single commodity but the overall configuration: stocks, forward curve, investment, geographic concentration and geopolitical power relations.
Three regime signals to monitor
Beyond spot prices, three structural indicators provide a more reliable regime diagnosis than any single commodity’s spot level.
The structure of the forward curve. When inventories are abundant the market is in contango (futures > spot); when inventories are tight the market moves into backwardation (spot > futures). The 2021–2026 cycle provided a complete demonstration. Brent stayed in near-continuous backwardation from mid-2021 to 2024 (ICE), signaling a structurally tight physical market. The curve flipped into contango in October 2025, for the first time since December 2023, as accumulating inventories and the anticipated 2026 surplus imposed themselves on traders (Reuters). It then flipped back into pronounced backwardation in March 2026 with the closure of Hormuz, the inversion extending to the most distant maturities (Rystad Energy). At each turn, the curve documented the true state of the physical market before the public debate adjusted to it. Copper experienced episodes of extreme backwardation in 2024, with spot premia exceeding $100/ton (LME). The forward curve is a better indicator of the physical market’s true state than the spot price.
The investment / decline ratio. The observed decline rate of existing oil fields averages 5.6% per year globally for conventional supply, and it is accelerating as output relies more on shale and deep offshore (IEA, September 2025): without investment, production losses would reach roughly 5.5 mb/d each year. For metals, ore grade depletion increases marginal cost cycle after cycle. When investment does not cover decline, deficit is inevitable; the only question is timing. The investment/decline ratio is the most reliable signal for price direction over a 3–5 year horizon.
Central bank purchases (gold). 1,037 tonnes in 2023, 1,045 in 2024, 863 in 2025: three years far above the 473-tonne annual average of 2010–2021 (WGC), and the pace held in early 2026 (a net 244 tonnes in Q1, +3% year on year) while the ounce set a peak of $5,405 in January 2026 (LBMA). Major buyers (Poland, Kazakhstan, Brazil, China, WGC) signal via these purchases a systemic re-assessment of monetary risk and a progressive dedollarization of reserves. This structural signal transcends the gold price and informs confidence in the international monetary architecture.
Commodities are not financial assets: they are irreducible physical constraints that impose themselves on the economic system. Their behaviour relative to other asset classes across regimes is documented in the heatmap that situates commodities and other classes by macro regime. Their cyclicality stems from the structural asymmetry between supply, which evolves over decades (geology, investment, infrastructure), and demand, which evolves over quarters (cycles, monetary policy, geopolitics). Three forces converge to define the current regime: chronic underinvestment in hydrocarbons creating a programmed supply shortfall, an energy transition that shifts dependence from fossil fuels to metals with insufficient mining capacity, and geopolitical fragmentation that turns resources into instruments of power. The first half of 2026 (the Hormuz closure, record copper and gold prices, the UAE’s exit from OPEC) provided a full-scale demonstration. The relevant question is not “where will prices go?” but “what do stocks, the forward curve, the investment/decline ratio and geographic concentration tell us about the true state of the physical constraints facing the global economy?” That is the question this pillar and its sub-pillars seek to answer.
Last updated — 12 July 2026
Disclaimer – Financial Information: The analyses, commentary, and content published on eco3min.fr are provided for informational and educational purposes only. They do not constitute investment advice or a solicitation to buy or sell financial instruments. Past performance is not indicative of future results. All investment decisions involve risk and are the sole responsibility of the reader.
Read next
Physical Commodity Markets: Oil, Gas, Copper, Critical Minerals, and Structural Signals
Four physical markets under structural tension over the 2020-2022 window (IEA World Energy Investment, ICE TTF, LME, Benchmark…
Physical Constraints on the Economy: Energy, Resources, and Structural Limits to Growth
The energy transition shifts dependency more than it eliminates it (Energy Institute 2024; EIA; USGS 2024; IEA Critical…