
Independent macro-financial analysis
Understand the cycles. Measure them with data.
Eco3min classifies the macro regime every month and publishes the long-run series that place each period within its cycle. On institutional data. No personalized advice.
Trace the mechanisms before reading the prices.
Current regime
Transition / mixed signals
Neither growth nor underlying inflation has left its neutral zone: the grid points to none of the seven cyclical regimes.
Growth
On trend
Underlying inflation
Stable
Financial conditions
Neutral
NoteUnderlying inflation stable (2.3%), but an energy shock is under way: Brent +68% year on year (Sep 2026). Headline inflation exceeds the persistent inflation the classification measures.
What can be checked
- Cited byFT Alphaville, Forbes, RTBF, The Conversation, State Street Investment Management, Cornell University and an expert statement submitted to the German Bundestag. Record of mentions and citations
- Open codeThe macro regime classifier is published on GitHub: code under the MIT licence, thresholds and methodology under CC BY 4.0, backtest 1968-2026. macro-regime-classifier repository
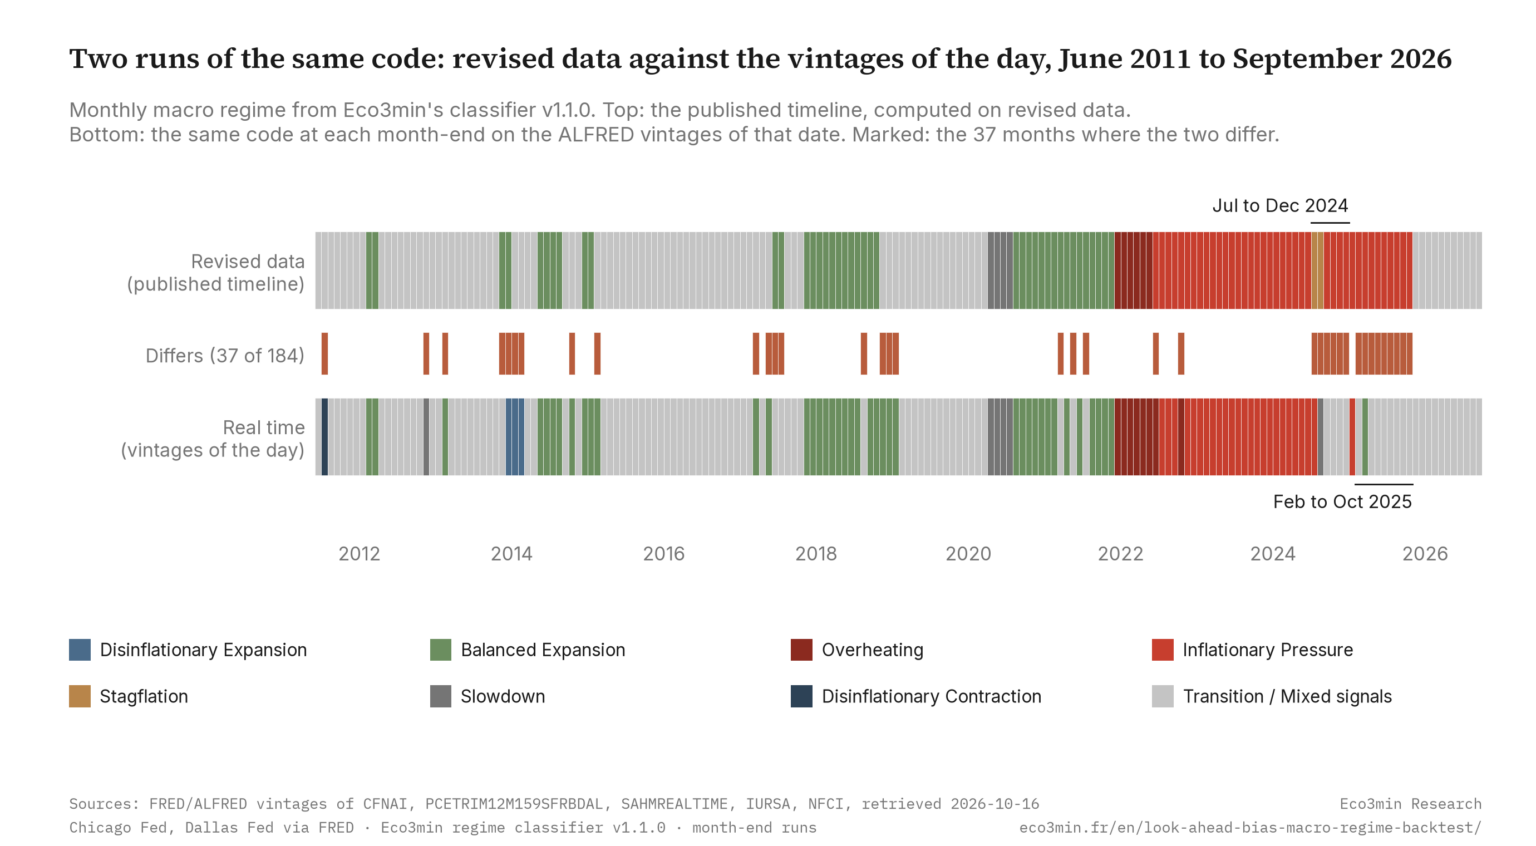
- Measured biasReplayed on the data actually available at each date (ALFRED vintages), the classifier differs from its revised-data timeline on 24.1% of classified days from June 2011 to September 2026. Look-ahead bias study
- Downloadable data240 datasets in CSV, each with its primary source and its reuse terms. Data catalogue
- Written methodFacts, mechanisms and hypotheses kept apart; production tools (Python, R, LLM assistance) and correction policy disclosed. Editorial standards · Editorial team and method
Macro Chart of the Week
A new research chart every week, pulled live from Macro Watch
Long series. Unique data.
Explore the hub →The Oil Burden Index (1970–2026)
70 years of yield curve inversions
A century of US inflation
The dollar across 18 major crises
Q&A Hub · 176 macro answers
Macro concepts explained by the data.
Sourced answers to fundamental questions in macroeconomics.
Why does the yield curve invert before recessions?
Read →Real vs nominal rates: why the first matters more
Read →How does the Fed balance sheet affect stock prices?
Read →What happens to markets during stagflation?
Read →The CAPE ratio: what it really says about stock valuations
Read →What is Ray Dalio’s All Weather portfolio, and how has it performed?
Read →Tools · long-run references
Calculators, calendars and historical records.
Each page cites its primary source and its method.
What are French francs from 1960 or 1985 worth in today’s euros?
Convert →When is the next ECB rate decision? Dates and times in CET and ET.
Open →Every US recession since 1948: duration, depth and what preceded each one.
Read →Nominal vs real wages: why can a raise still cut living standards?
Read →Argentina since 1945: how did inflation become a regime?
Read →Why has the OAT-Bund spread become a gauge of French sovereign risk?
Read →Three levels, one progression: understand, analyze, measure.
Start at your level, then progressively access more advanced analyses and data. Each level prepares the next.
First bearings
Build the macro framework
Understand what the markets are really saying.
Vocabulary, general framework and first macro signals to make sense of what’s happening on markets.
- Macro basics & economic cycles
- Simplified reading of indicators
- Q&A Hub: 176 sourced answers
« I understand what’s happening. »
Cycle reading
Read regimes, interpret transmissions
Connect a published figure to the regime behind it.
Macro-financial mechanisms, rate transmission, indicator reading and cycle framing.
- Structural in-depth analyses
- Monthly macro newsletter
- Proprietary cycle barometer
« I know how to interpret. »
Data & backtests
Test a hypothesis against history
Check a hypothesis against 50+ years of data.
CSV datasets, documented long series and quantitative analyses for advanced readings.
- CSV long-history datasets
- Unique historical series
- Quantitative analyses & backtests
« I can check it myself. »
Featured
News describes events. Eco3min analyzes the mechanisms that produce them, with sourced figures.
Macro · Energy
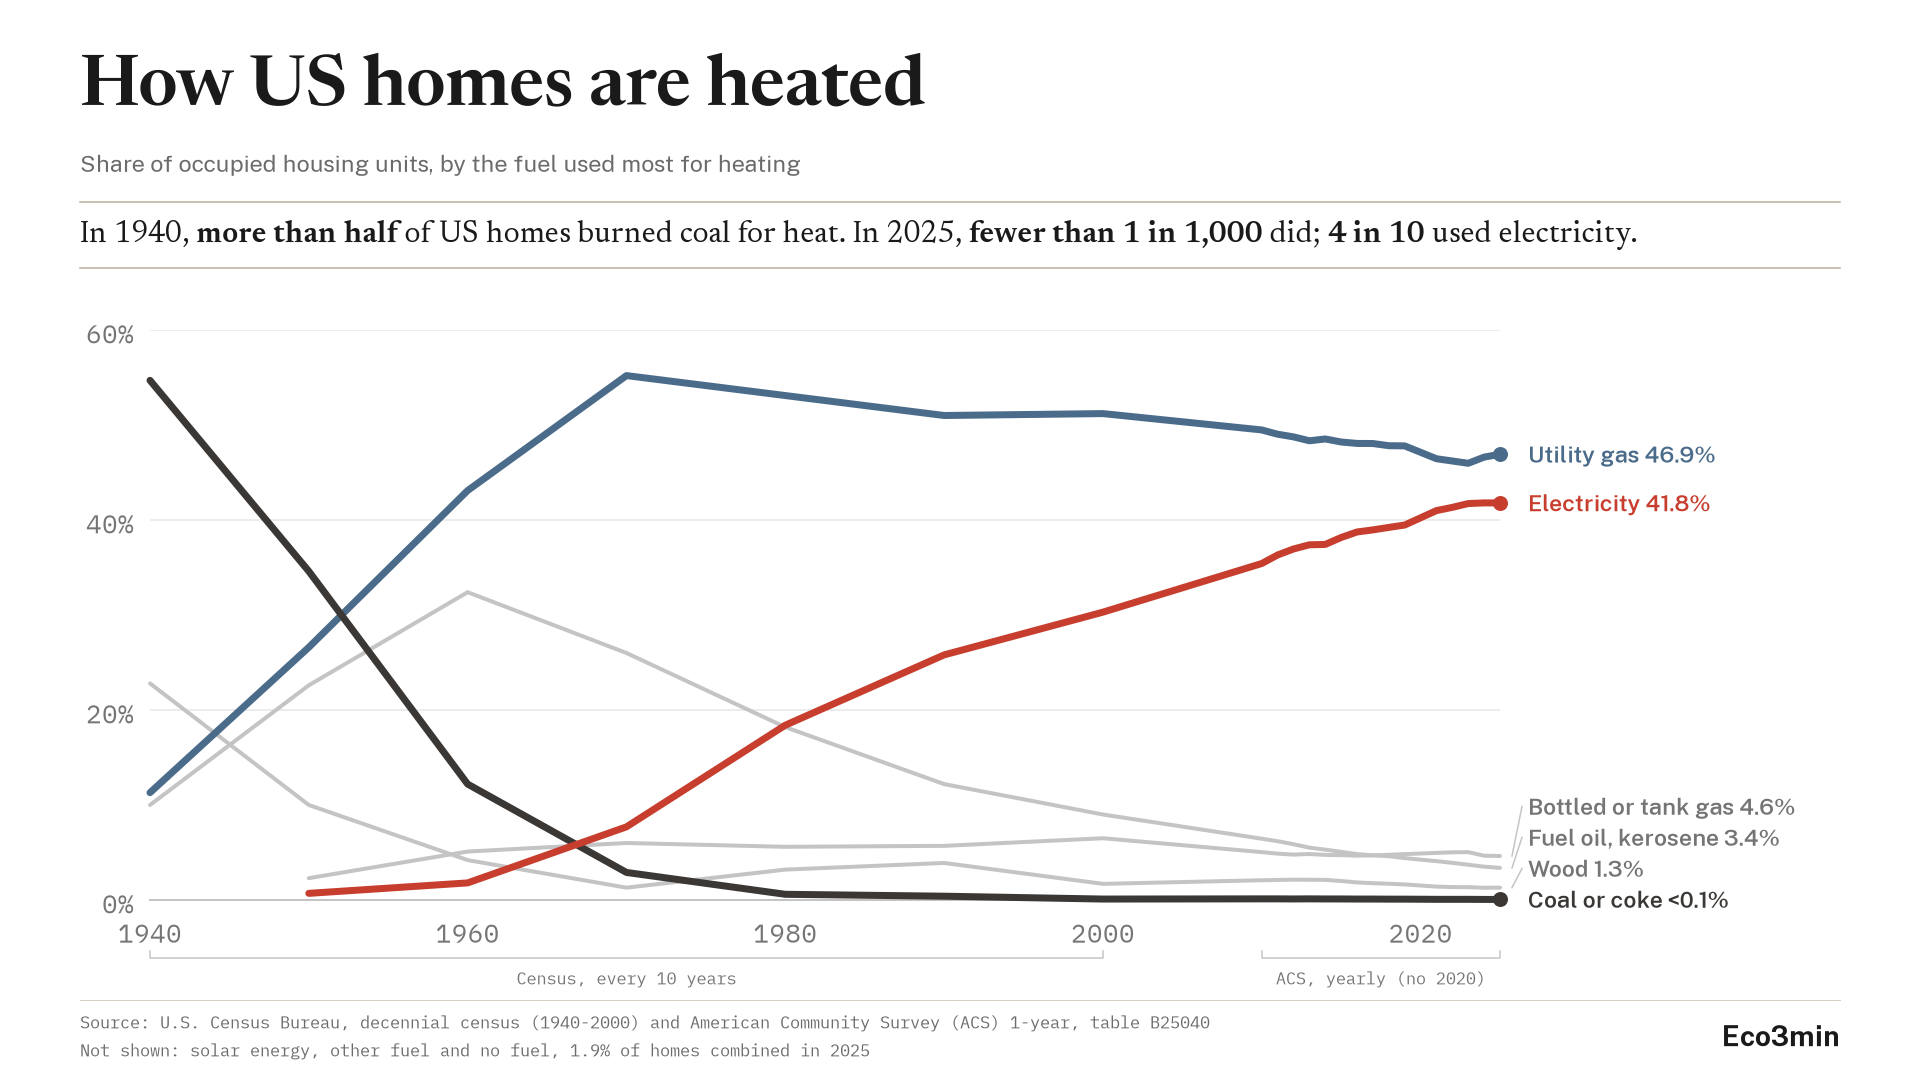
How are American homes heated? Main heating fuel, 1940 to 2025
In 1940, coal heated 54.7% of the US homes that reported a heating fuel in the decennial census. In 2025, fewer than 1 in 1,000 homes used it as their main heating fuel.
Macro · Food prices
Beef prices vs chicken in the US, adjusted for inflation, 1980 to 2026
Featured study
Recent analyses and cycle readings
Core analyses
Dossiers built to last.
View all dossiers → eco3min.fr01
The yield curve and monetary policy expectations
How the term structure of rates signals growth and inflation expectations, and how that signal behaved in past cycles.
02
Monetary policy transmission to the real economy
Lags, channels and exceptions: the mechanisms through which central bank decisions affect credit, equity markets and employment.
03
Market microstructure and behavior
Liquidity, concentration and passive flows: what shapes prices beyond fundamentals.
04
Commodities, real cycles and macro transmission
How real cycles respond to oil cycles, and how they pass through to inflation and gaps between sectors.
Editorial positioning
Mainstream reading
Reaction to announcements
Short-term commentary
Unsourced market opinions
Eco3min reading
Mechanism analysis → transmission chains
Cycles and macro regimes → context reading
Historical data → checks against history
What readers do with Eco3min
01
Place a period within the cycle
Connect the macro regime to how sectors have historically behaved in comparable regimes.
02
Read the current macro regime
The monthly barometer synthesizes growth, inflation, liquidity and real rates into a single grid to place the cycle.
03
Decode central bank decisions
Measure the lag between a rate decision and its effects on credit, jobs and prices.
04
Leverage historical data
Download documented CSV series for your own analyses.
Last updated — 3 November 2026