Physical Constraints on the Economy: Energy, Resources, and Structural Limits to Growth
This page is an analytical subset of the Commodities pillar. It formalizes the structuring thesis of this pillar: physical constraints — energy, resources, logistics corridors — cap growth, shape inflation, and reshape power dynamics, independently of monetary or financial policies. The sub-pillars Price Formation, Cycles and Macro Transmission and Resource Geoeconomics develop market mechanics and field analyses; this page addresses the core conceptual framework — why physical constraints ultimately dominate the economic system.
Commodities are not an asset class. They are physical constraints to which economies ultimately adjust — through prices, growth, inflation, or geopolitical power dynamics. No monetary policy creates a barrel of oil. No fiscal stimulus produces a ton of copper. No central bank decision shortens the 10–15 years required to develop a mine (S&P Global Market Intelligence) or the 4–7 years needed to build an LNG terminal (IEA). This irreducibility of the physical to the monetary is the blind spot of conventional macroeconomic analysis — and the central thesis of this sub-pillar.
The European energy crisis of 2022 demonstrated this reality with unmistakable force. Europe had a single currency, a powerful central bank, deep capital markets, and a combined GDP of $17 trillion (Eurostat). None of this prevented a 17-fold surge in gas prices (TTF €20 → €340/MWh, ICE), an excess energy bill above €200 billion (Bruegel), an industrial contraction from which German output has not recovered (Destatis), and inflation reaching 10.6% (Eurostat, October 2022). Forty years of industrial policy had not corrected a dependence on Russian gas that accounted for 40% of European imports (Eurostat). The adjustment occurred through prices — that is, through industrial demand destruction.
Energy and Growth: An Irreducible Coupling
The correlation between primary energy consumption and global GDP is one of the most robust regularities in economic history. Between 1965 and 2024, global primary energy consumption rose from 3,700 to 14,400 Mtoe — a 3.9-fold increase (BP Statistical Review / Energy Institute, 2024). Real global GDP increased 5.5-fold over the same period (World Bank). The ratio — energy intensity — declined by 30%, meaning the global economy produces more value per unit of energy. Yet no economy has ever sustained long-term growth without increasing its absolute energy consumption. China multiplied its energy use sixfold between 1990 and 2024 (Energy Institute) while multiplying real GDP thirteenfold (World Bank). India doubled its energy consumption since 2000 while tripling real GDP.
Efficiency gains — producing more with less energy per unit of GDP — are real but have never been sufficient to durably decouple growth from energy consumption at the global scale. Global energy intensity declines by roughly 1.5% per year on average (IEA). But global GDP growth averages 3–3.5% per year — implying a 1.5–2% annual rise in absolute energy demand. “Relative” decoupling (less energy per dollar of GDP) is real. “Absolute” decoupling (less total energy with more GDP) has never been observed globally over a meaningful duration (Vaclav Smil, Energy and Civilization; IEA, World Energy Outlook).
This physical reality has direct macroeconomic consequences. Every $10/barrel rise in oil prices adds 0.2–0.4 percentage points to headline inflation in importing countries over a 6–12 month horizon (ECB, Economic Bulletin). The oil shocks of 1973, 1979, 1990, 2008, and 2022 all preceded or accompanied recessions in importing economies (NBER, CEPR). Energy is not just another sector — it is the substrate underpinning all productive activity.
Fossil Underinvestment: A Programmed Supply Deficit
The global economy consumes 100 million barrels of oil per day (IEA), 4 trillion cubic meters of gas per year (IEA), and 8.5 billion tons of coal annually (Energy Institute). The energy transition has not yet reduced these volumes — consumption of each fossil fuel reached a record high in 2023 (Energy Institute, Statistical Review of World Energy). Renewables are adding to the energy mix more than replacing fossil fuels: between 2010 and 2023, solar and wind output increased by 3,800 TWh (IEA), while total primary energy demand rose by 80 EJ — equivalent to 14,000 TWh (Energy Institute). Renewables covered roughly one quarter of incremental demand.
Meanwhile, investment in hydrocarbon exploration and production remains around $500 billion per year at end-2024 (IEA, World Energy Investment) — 30% below the 2014 peak ($700bn). The natural decline rate of existing oil fields is 4–5% annually (IEA) — a loss of 4–5 million barrels/day each year that must be replaced just to keep output flat. Newly sanctioned conventional projects remain 40% below the 2010–2014 average (Rystad Energy). Major new field discoveries have fallen from 5–10 per year in the 2000s to 1–2 annually since 2015 (S&P Global Market Intelligence).
This underinvestment reflects three converging forces: transition uncertainty (companies hesitate to commit to 20–30 year projects in a world announcing the end of fossil fuels), ESG pressures on Western majors (BP, Shell, TotalEnergies reduced exploration spending), and post-2014 financial discipline (US shale producers prioritize shareholder returns over output growth). If demand does not decline as fast as expected — and empirical data suggests it is not — while supply stagnates, a deficit is programmed. Field analyses in the Resource Geoeconomics sub-pillar document this tension market by market.
Energy Transition: Substitution of Dependencies, Not Elimination
The energy transition does not reduce dependence on physical constraints — it displaces it. Fossil hydrocarbons are replaced by metals required for low-carbon technologies: lithium and cobalt for batteries, copper for electrification, rare earths for permanent magnets in wind turbines and electric motors, silicon for photovoltaics, graphite for anodes. An electric vehicle requires six times more copper than an internal combustion vehicle (IEA), 53 kg of lithium and 8 kg of cobalt (IEA). A large offshore wind turbine contains around eight tons of copper (Copper Alliance) and several tons of rare earth elements.
The IEA estimates that demand for critical minerals tied to clean technologies must increase four- to sixfold by 2040 in climate-aligned scenarios (Critical Minerals Market Review, 2024). Lithium demand may rise sevenfold, graphite fivefold, and clean-tech copper demand could double. Yet supply is constrained by 10–15 year mining development timelines (S&P Global MI), growing local opposition, stricter environmental standards, and a cumulative investment shortfall estimated at $360 billion by 2030 (IEA).
Geographic concentration creates new structural vulnerabilities. China controls 60% of rare earth production, 70% of cobalt refining, and 80% of graphite output (USGS/IEA) — a refining concentration with no modern precedent. The Democratic Republic of Congo extracts 70% of global cobalt under documented social conditions (USGS). Australia and Chile account for 70% of lithium production (USGS). Chinese export restrictions on gallium and germanium (August 2023) and graphite (December 2023, MOFCOM) demonstrate that these resources are already instruments of geopolitical leverage — not a hypothetical scenario, but present reality.
Assuming the energy transition reduces geopolitical risks linked to energy. It shifts them — from hydrocarbon dependence (where supply is geographically diversified: Middle East, Russia, North America, Africa) to dependence on critical metals (where both production and refining are far more concentrated — a single country, China, controls 60–80% of most transformation chains). The transition substitutes a long-managed dependency (OPEC+, strategic reserves, diversified sourcing) with a new dependency lacking established governance mechanisms.
Energy Corridors: The Physical Geography of Risk
Global energy trade relies on maritime routes whose security conditions the supply of importing economies — and whose disruption can transmit instantly to prices, inflation, and global value chains. Three chokepoints concentrate systemic risk.
The Strait of Hormuz — 21 km wide at its narrowest — carries around 21 million barrels of oil per day, roughly 20% of global consumption (EIA). It is the most critical bottleneck in the global energy system. Closure — a scenario raised with each escalation in Iran–US or Iran–Israel tensions — would trigger a 15–20 Mb/d supply shock that global strategic reserves (1.2 billion barrels, IEA) could buffer for only two to three months.
The Strait of Malacca — a vital artery for China’s energy supply (80% of its oil imports transit through it, EIA), Japan, and South Korea — channels 16 million barrels/day (EIA). Any Sino–US confrontation in the Pacific would potentially involve this corridor, with energy consequences spreading across the Asian economy.
The Red Sea and Suez Canal — shortening Gulf–Europe routes by 10–15 days — carry 10% of global trade (UNCTAD). Repeated Houthi attacks on commercial vessels since November 2023 forced part of traffic to reroute around the Cape of Good Hope, adding 10–15 days to voyages and raising freight costs by 200–300% at the peak (Freightos, Drewry). Detailed analysis appears in our article on the Red Sea corridor. The broader framework is covered in geopolitical energy risk in the Middle East.
Physical Constraints as a Driver of Structural Inflation
The convergence of fossil underinvestment, surging metals demand, geographic resource concentration, and corridor vulnerability does not represent isolated tail risks — it defines a structurally higher inflation regime than that of the 2010–2020 decade.
The ECB estimates that supply chain fragmentation and energy constraints add 1–2 percentage points of structural inflation per year (Economic Bulletin, 2023). The IMF, in its October 2023 World Economic Outlook, identifies “recurrent commodity supply shocks” as a driver of inflation persistence. Energy contributes directly (fuel, electricity and gas bills) and indirectly (production, transport, fertilizers → food). Critical metals feed through transition technology costs (batteries, grids, renewables), affecting electricity and vehicle prices. These pressures then propagate through the economy via the monetary transmission chain — from costs to expectations, financial conditions, and aggregate demand — as detailed in the article How interest rates transmit to the economy and markets.
This structural inflation regime has direct implications for monetary policy — documented in the Monetary Policy & Rates pillar. Central banks face a dilemma: commodity supply shocks raise inflation but compress growth. Rate hikes fight inflation but do not create barrels of oil or tons of copper. Monetary policy is powerless against physical constraints — it can only manage demand consequences, at the cost of recession if the shock is severe. Detailed transmission channels — energy, metals, agriculture — are analyzed in the Cycles and Macroeconomic Transmission sub-pillar.
Implications for the Economic System
Physical constraints on energy and resources are not tail risks — they are a structural parameter of the macroeconomic regime emerging since 2021. Their implications unfold across three dimensions.
Competitiveness. Net energy-importing economies — Europe, Japan, Korea — are structurally disadvantaged relative to producing economies — United States (now a net exporter of oil and LNG), Canada, Norway, Australia. Industrial gas prices in Europe remain 3–4 times US levels (Henry Hub vs TTF, 2024). European chemicals output has fallen 10% since 2022 (Cefic). Energy-intensive sectors — aluminum, steel — face noncompetitive costs. This divergence is structural as long as energy price gaps persist.
Value chains. Geographic concentration of critical minerals and refining creates supply-chain vulnerabilities that diversification strategies (US Critical Minerals Act, EU Critical Raw Materials Act, friend-shoring) seek to address — but with 10–20 year timelines for alternative capacity. Indonesia showed that producer countries can capture value-added by banning raw ore exports — its share of global nickel refining rose from 6% to 40% in five years (USGS). This model is spreading.
Monetary architecture. Record central bank gold purchases — 1,037 tons in 2023 and 1,045 tons in 2024 (WGC) — and the proliferation of local-currency trade agreements (yuan, rupee, dirham) signal a systemic reassessment of the dollar’s role and financial assets in reserves. Commodities — tangible resources immune to sanctions freezes — are regaining a reserve-of-value role that financialization had marginalized. This trend fits within the monetary fragmentation framework documented in the Macroeconomics & Geopolitics pillar.
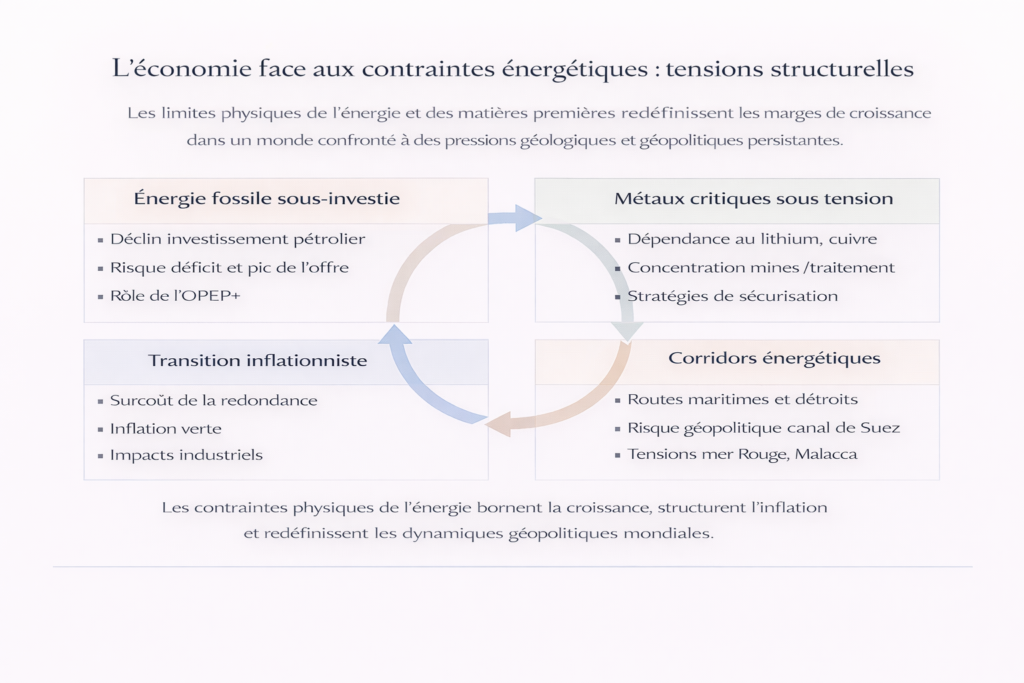
The economy ultimately runs on physical flows — barrels, cubic meters, megawatt-hours, tons of copper and lithium. The correlation between energy use and GDP is among the most robust patterns in economic history — and no efficiency gain has ever durably decoupled growth from absolute energy consumption. The regime emerging since 2021 reflects four converging physical constraints: chronic hydrocarbon underinvestment despite record consumption, an energy transition that shifts dependence from fossil fuels to critical metals amid insufficient capacity, extreme geographic concentration of production and refining that turns resources into power levers, and vulnerable energy corridors highlighted by Red Sea attacks. Monetary policy is powerless against these constraints — it can only manage demand-side consequences. The relevant diagnosis is not “what are energy prices?” but “which physical constraints bound the productive capacity of the global economy, and how do they transmit to growth, inflation, and geopolitical power balances?”
← Back to pillar page Commodities