
Physical Commodity Markets: Oil, Gas, Copper, Critical Minerals, and Structural Signals
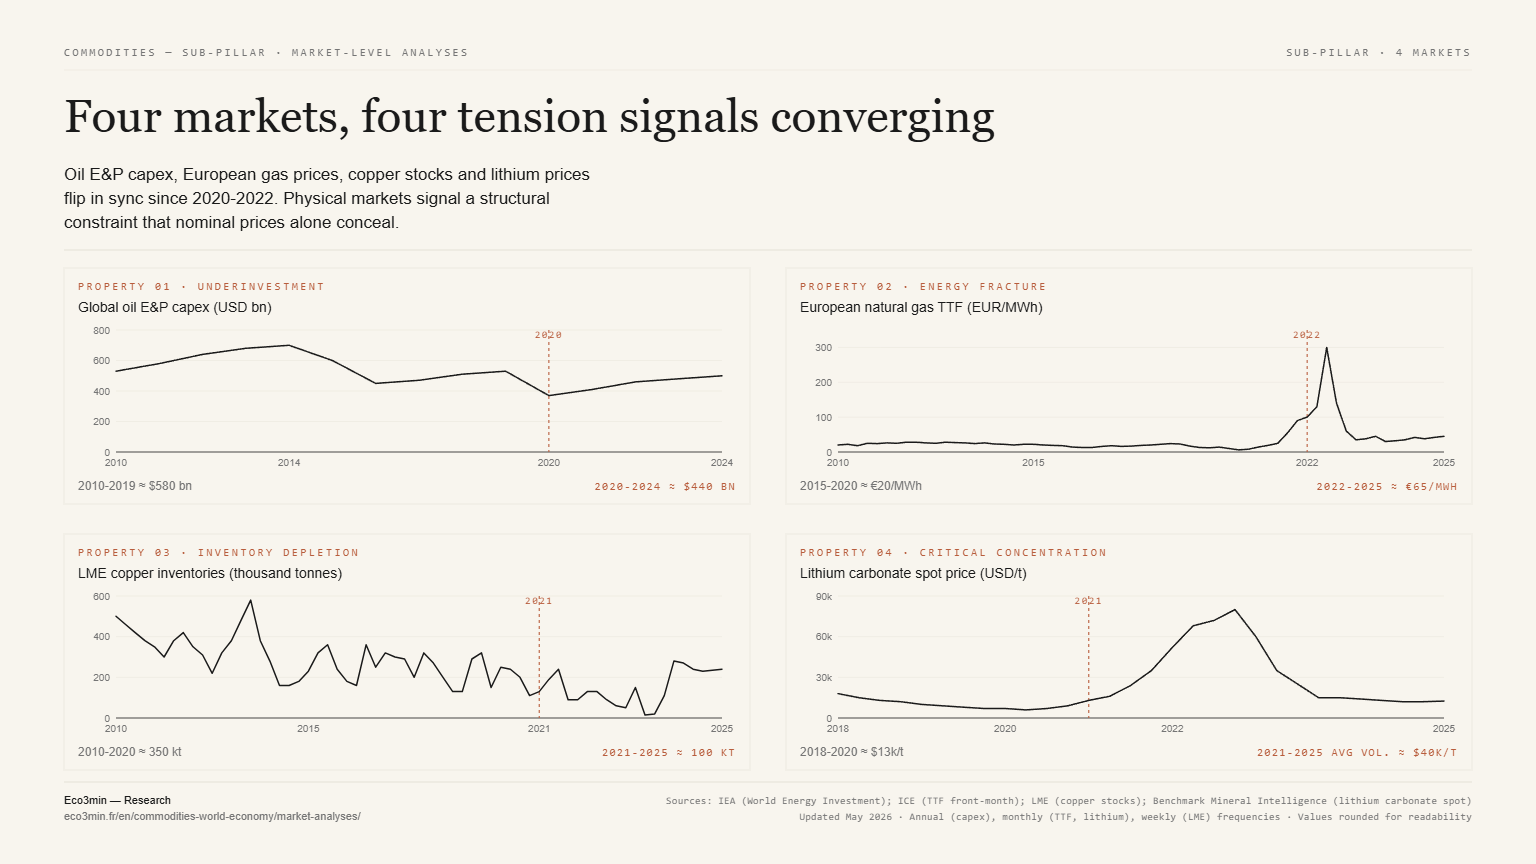
Nominal prices tell only part of the story; the tension configuration — underinvestment, energy fracture, inventory depletion, critical concentration — is the leading signal physical markets deliver.
This page develops one analytical strand of the Commodities pillar. It brings together market-level field analyses — oil, gas, copper, palladium, and critical minerals — documenting physical constraints, supply–demand imbalances, and the forward signals each commodity market provides. The sub-pillars Price Formation and Cycles & Macro Transmission provide the analytical framework; this page applies it to physical markets.
Commodities are not just price charts on a Bloomberg terminal. Each is a physical market with its own geological constraints, logistical bottlenecks, geopolitical power dynamics, and proprietary signals. European natural gas delivered a warning signal of energy vulnerability in 2022 that equity markets only priced in months later. Copper signals a structural tension between the acceleration of the energy transition and the inertia of mining capacity. Oil sits at the intersection of the business cycle, OPEC+ discipline, and structural underinvestment in exploration. Critical minerals are redrawing the map of global geopolitical dependence.
The question structuring this sub-pillar is not “should one invest in commodities?” — it is: what do physical markets — oil, gas, copper, critical metals — reveal about the structural constraints weighing on the real economy, and what forward signals do they provide? These market-by-market price signals are gathered in our commodity prices hub.
Oil: between OPEC+ discipline and structural underinvestment
The global oil market — 100 million barrels per day, more than $3 trillion in annual flows (IEA) — remains the largest commodity market and the one most directly linked to the macroeconomic cycle. Three forces define the current regime. A complementary angle: uranium’s macro behaviour.
Three forces define the current market
100 million barrels per day, more than $3 trillion in annual flows (IEA): the largest commodity market and the one most directly tied to the macro cycle. Down to the mechanism: WTI: Reading Crude Oil Price as a Macro Signal of Economic Cycles.
Underinvestment in exploration
Global E&P capex fell from $700bn/yr at the 2014 peak to $370bn in 2020, recovering only to ~$500bn by end-2024 (IEA). That is insufficient against the natural decline of existing fields (4–5%/yr, IEA) — 4–5 mb/d to replace every year just to keep output flat. New conventional projects sanctioned in 2023 ran 40% below the 2010–2014 average (Rystad Energy). Further detail: Our analysis of iron ore as a China construction signal.
Physical resource constraints → Brent: underestimated supply crisis →OPEC+ discipline
Cumulative cuts of 5.86 mb/d in 2024 (OPEC+) — the highest level of restriction since the alliance formed in 2016. Saudi Arabia produced 9 mb/d, about 3.5 mb/d below its nominal 12.5 mb/d capacity (Saudi Aramco). A price floor, but also the only meaningful spare capacity in the event of a supply shock. Related work: the structural shift in U.S. electricity generation.
US shale in a maturity phase
Record output of 13.3 mb/d by end-2024 (EIA), but structurally slowing growth: active rigs from 627 (2022 peak) to ~480 by end-2024 (Baker Hughes), and declining new-well productivity in the Permian as sweet spots deplete (EIA). Shale can no longer play the 2014–2019 “swing producer” role. This specific point is developed further in our analysis of the wti–brent spread.
Brent: reading the price pullback →Refining margins: the intermediate signal
The price of crude tells only part of the story. Refining margins — the spread between crude prices and refined products (gasoline, diesel, jet fuel) — often provide a more revealing signal of real energy-market conditions. The European diesel crack spread exceeded $60 per barrel in 2022 (Platts), against a $10–15 average over the previous decade, and it returned above $60 in 2026: the 2022 spike reads less as an anomaly than as a template. What the spread priced was a refining bottleneck rather than crude scarcity — global refining capacity fell in 2021 for the first time in thirty years (IEA), with roughly 3.5 mb/d of capacity shut or converted since 2020, only partly offset by new plants in Asia and the Middle East. Crude carries the cyclical signal, which is the frame of our study on WTI: Reading Crude Oil Price as a Macro Signal of Economic Cycles; the crack spread carries the transformation signal, reconstructed over the long run in Refining margins: the true barometer of oil profits; and the price of energy relative to monetary assets adds a third layer, documented in the gold-to-oil ratio as an energy-money regime signal. At the household end of that chain, fuel as a share of income can be quantified with the fuel burden calculator.
Natural gas: the Europe–world energy fracture
The natural gas market experienced the most violent dislocation in its history in 2022 — and the structural consequences remain far from resolved. European TTF natural gas reached €340/MWh in August 2022 (ICE) — 17 times its €20/MWh average over 2015–2020. US Henry Hub, tied to a self-sufficient domestic market, remained below $10/MMBtu (NYMEX). This benchmark divergence is the subject of why natural gas has no single world price. This price gap — a peak ratio of 1 to 8 — represented the largest competitiveness shock faced by European industry since the 1970s. Source data: the jet fuel spot price dataset.
The restructuring of Europe’s gas market after the Russian supply break (Russian imports fell from 155 bcm/year in 2021 to under 15 bcm in 2024, Eurostat/Bruegel) was absorbed through three mechanisms: a massive rise in LNG imports (+60%, mainly US and Qatar, IEA), industrial demand destruction (European industrial gas consumption -15% to -20% in 2022–2023, Eurostat), and accelerated renewables deployment. The cumulative cost to Europe exceeded €200 billion in additional energy expenses in 2022 (Bruegel). German industrial competitiveness was structurally affected — industrial output has not returned to pre-2022 levels (Destatis). Field analysis is developed in Natural gas market: the signal nobody is watching. Related material: our study on the uranium cycle now driven by compute demand.
Copper: the metal of transition and macro diagnosis
Copper holds a unique position among commodities: it is both a leading cyclical indicator (“Dr. Copper”) and a marker of structural transformation (electrification, energy transition, data centers). Annual demand of 26 million tons (ICSG, 2024) is distributed across construction (25%), electronics (25%), transport (12%), and energy (15%) — diversification that makes copper a barometer of global economic activity. WTI crude as a macro cycle signal extends this reading.
The structural signal is a growing deficit. The IEA estimates copper demand linked to clean technologies will double by 2040 (Critical Minerals Market Review). Doubling demand for one metal by 2040 presumes a build-out whose economics now turn on the falling cost of battery storage. Meanwhile, global LME copper inventories fell to critical levels — 15,000 tons at end-2023, equivalent to only a few hours of global consumption (LME), versus a 200,000–400,000 ton average over the prior decade. The pipeline of new mining projects is insufficient: long development timelines (10–15 years, S&P Global MI), regulatory constraints, and rising capex limit supply response. Copper exceeded $11,000/ton in May 2024 (LME), an all-time high. Field analyses are developed in Copper prices: a quiet signal of global reindustrialization and Copper inventories: a ticking time bomb.
Critical minerals: the new map of dependency
The energy transition has created a new geography of resource dependence. Lithium, cobalt, nickel, rare earths, graphite, and gallium have become the strategic commodities of the 21st century — and their geographic concentration is unprecedented. A related perspective: our study of the gold-silver ratio as a mean-reversion signal.
China controls 60% of rare earth production, 70% of cobalt refining, and 80% of graphite production (USGS/IEA). The Democratic Republic of Congo extracts 70% of global cobalt (USGS). Because those concentrations sit upstream of every battery line and every turbine, permitting and mine development weigh as heavily as order books on the capital the energy transition actually requires. Australia and Chile produce 70% of lithium (USGS). Lithium prices illustrate the violence of cycles in these narrow markets: from $15,000/ton at end-2020, prices surged to $80,000 by end-2022 before falling to $12,000 by end-2024 (Benchmark Mineral Intelligence) — 500% volatility in four years, reflecting the collision between exploding demand (EV sales tripled between 2020 and 2024, IEA) and mining investment cycles that cannot keep pace, within a broader context of geopolitical fragmentation reshaping global market structures. More context: our study on the 2022 LME nickel squeeze as structural fragility.
The use of these minerals as geopolitical leverage is already underway. China restricted exports of gallium and germanium (Aug 2023), graphite (Dec 2023), and antimony (Aug 2024, MOFCOM). Export controls used this way turn a mining statistic into a policy instrument, which is the whole subject of the geopolitics of critical mineral supply chains. Consumer countries responded with diversification strategies — the US Critical Minerals Act and the EU Critical Raw Materials Act — but timelines to build alternative capacity are measured in decades. Analysis is developed in Critical minerals and new geopolitical risks.
Palladium: a narrow market under structural pressure
The palladium market illustrates dynamics specific to narrow and highly concentrated commodity markets. The macro context is developed in our study on why European gas has no global price and what it cost. Global palladium production is dominated by Russia (40%) and South Africa (35%) (Johnson Matthey). Demand depends 80% on the automotive sector (catalytic converters, Johnson Matthey). Palladium reached a record $3,440/oz in March 2022 (NYMEX) — driven by Russian sanctions and semiconductor shortages limiting car production (and thus catalyst recycling) — before falling below $1,000 in 2024 as electric vehicle adoption rose (which does not use catalytic converters). This structural reversal — from chronic shortage to anticipated surplus in two years — is analyzed in Automotive palladium: a pressured market that may tip. A broader view: the access routes to commodities and their costs.
Same metal, two market regimes in two years.
PALLADIUM · DEMAND REGIMEA market that moved from chronic shortage to anticipated surplus in two years — an observed structural reversal, not a price signal. Reference framework: gold as a Monetary Signal: Real Yields, the Dollar and Central Bank Buying.
Analyzing individual commodity prices as isolated signals. Oil, gas, copper, and critical minerals form an interconnected system: energy determines metal extraction costs, metals determine the pace of the energy transition, and the transition reshapes energy demand. The relevant signal is not the price of one commodity but the overall configuration: inventories, forward curves, investment pipelines, geographic concentration, and geopolitical power dynamics across each market. Related framing: Gold as a safe haven and reserve asset.
Physical commodity markets deliver signals that financial markets do not capture — or capture with delay. This is set in context in this analysis of critical minerals energy transition. Oil signals a regime of structural underinvestment masked by OPEC+ discipline. The price-pressure side of that oil signal is quantified in WTI supply shocks and US core inflation since 1986. Natural gas revealed Europe’s energy vulnerability before macroeconomic indicators documented it. Copper signals a widening deficit between energy-transition demand and mining-capacity inertia. An illustration of it is found in copper demand driven by electrification. Critical minerals are redrawing the map of global geopolitical dependence. The relevant diagnosis is not “what is the price of copper?” but “what are inventories, forward curves, investment pipelines, and geographic concentration in each market — and what do these data reveal about the physical constraints shaping the real economy?”
Further reading
Refining margins: the true barometer of oil profits — The intermediate signal in energy markets.
Brent: the market underestimates a supply crisis — Structural underinvestment and its consequences.
Natural gas market: the signal nobody is watching — The Europe–world energy fracture.
Copper prices: a quiet signal for reindustrialization — The transition metal as macro diagnostic.
Copper inventories: the ticking time bomb — Critical levels and implications.
Automotive palladium: a market that may tip — A narrow market in structural reversal.
Critical minerals and new geopolitical risks — The new map of dependency.
← Back to the pillar page Commodities
Last updated — 25 July 2026
Disclaimer – Financial Information: The analyses, commentary, and content published on eco3min.fr are provided for informational and educational purposes only. They do not constitute investment advice or a solicitation to buy or sell financial instruments. Past performance is not indicative of future results. All investment decisions involve risk and are the sole responsibility of the reader.
Read next
Full pillar →Nuclear Baseload vs Renewable Intermittency in the Energy Transition
Nuclear's distinctive value lies not in low carbon alone but in firmness: dispatchable, round-the-clock output with a capacity…
Small Modular Reactors (SMRs) and Uranium Demand: A 2030s Story
Small modular reactors concentrate the nuclear revival's hopes, backed by the tech giants, yet almost none are built:…
Uranium Enrichment, SWU and the Russian Bottleneck in the Western Chain
Not mining, but enrichment is the fuel chain's most binding constraint: Russia holds the largest share, the SWU…