ETF Liquidity and Market Risk: Understanding the Invisible Fragility
ETF liquidity does not reside in the volumes displayed on screen. It depends on an intermediation chain whose weakest links only reveal themselves during stress — precisely when liquidity is most needed.
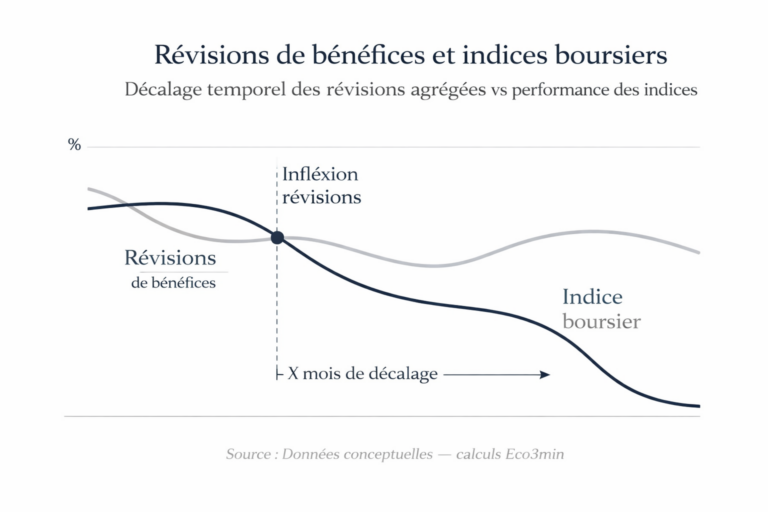
Why ETF Liquidity Can Disappear at the Worst Moment
ETF liquidity is not a stock — it is a conditional flow shaped by the market regime.
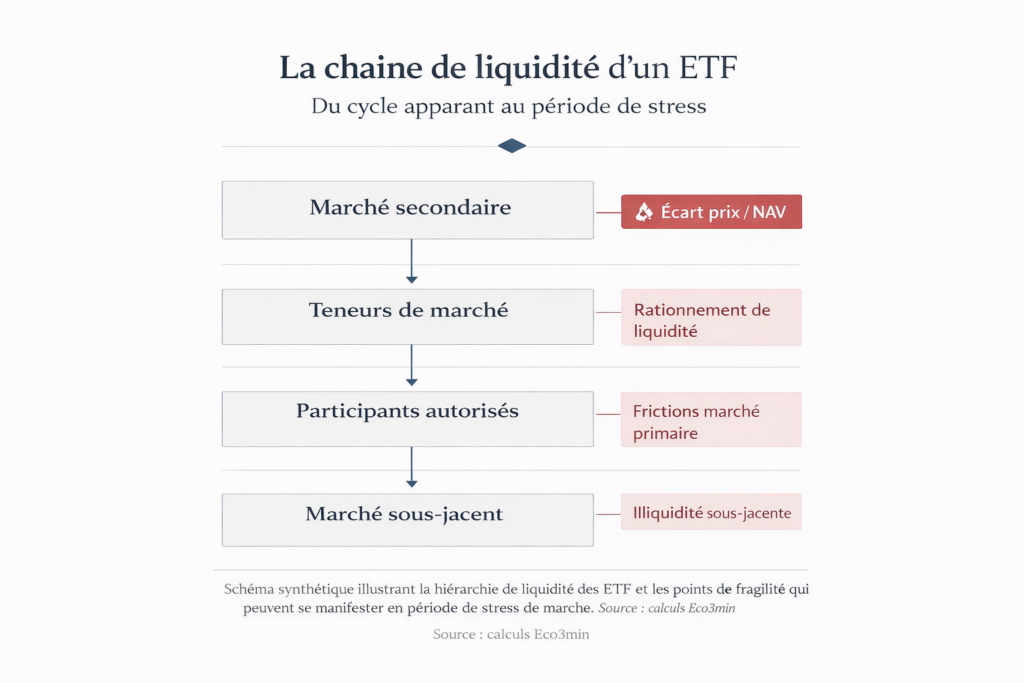
ETF liquidity architecture relies on a three‑tier intermediation chain — the secondary market, market makers, and authorized participants — whose resilience depends on carry costs, volatility, and underlying asset liquidity. In normal regimes, this chain operates with remarkable efficiency. Under stress, its weakest links surface simultaneously.
This mechanism creates a counter‑intuitive risk: ETF liquidity appears abundant precisely when it is least needed (calm periods) and becomes scarce when it is most sought after (crisis periods). For investors and allocators, understanding this conditionality fundamentally changes portfolio risk assessment.
At first glance, everything seems smooth: deep order books, tight bid‑ask spreads, and substantial trading volumes. This picture conceals a structural reality highlighted by several recent episodes. Since summer 2025, sharp correction sessions across major global exchanges have revealed temporary gaps of 1–3% between bond ETF prices and the true value of their underlying portfolios — versus typical gaps of around 0.2% during 2021–2023. In March 2020, discounts of 3–5% were observed on high‑yield ETFs for several consecutive sessions. These episodes are not technical anomalies: they reveal the conditional nature of ETF liquidity — a phenomenon whose implications intensify as passive management concentrates a growing share of flows into these vehicles.
This latent fragility is part of the passive and index investing revolution, where flow concentration reshapes price formation. This article focuses on the concrete mechanics through which ETF liquidity deteriorates under stress — and on the signals that help detect this deterioration before it materializes in prices.
- ETF liquidity depends on a three‑tier intermediation chain whose resilience is conditional on the market regime
- Under stress, three weak links emerge: price/NAV dislocation, market maker retreat, primary market frictions
- Key indicators: price/NAV gap > 1%, bid‑ask spreads, ETF share of total trading volumes
ETF liquidity is not a stock — it is a conditional flow shaped by the market regime. Liquidity architecture relies on continuous arbitrage between ETF price and its underlying basket, ensured by market makers and authorized participants (APs). This mechanism functions as long as transaction costs remain reasonable and the underlying stays liquid. Under stress — sharp volatility spikes, surging carry costs, underlying market dry‑ups — all three levels of the chain deteriorate simultaneously. The risk is not inherent to ETFs as instruments; it stems from a market architecture that concentrates massive flows on an intermediation chain whose absorption capacity is procyclical. This mechanism is documented by the BIS (2019, 2024), the SEC (2015), and market data; its calibration in the new regime of positive real rates remains an open question.
Core Mechanism: How the Liquidity Chain Works — and Fails
ETF liquidity relies on a three‑level architecture whose strength depends on its weakest component — not its most visible one.
Volatility shock → Hedging costs ↑ → Market makers: wider spreads, smaller size → APs: slower creations/redemptions → Price/NAV dislocation → The ETF becomes a magnifying mirror of stress
All three levels deteriorate simultaneously, not sequentially. Transmission speed is measured in minutes, not days.
Level 1: The secondary market (visible liquidity). Exchange trading between investors — order books, volumes, quoted spreads — forms the most visible and most discussed liquidity layer. It is also the most misleading. In normal regimes, major equity ETFs show bid‑ask spreads below 0.05% and daily volumes in the billions of dollars. Yet a meaningful share of these volumes stems from technical flows (index rebalancing, quantitative arbitrage, portfolio adjustments) that can evaporate as soon as volatility spikes. Market data show that on sessions when the VIX exceeded 30 in 2025, order‑book depth (available size at best prices) for major ETFs fell by 40–60% — even as volumes paradoxically increased. Confusing volume with depth is the most common misinterpretation of ETF liquidity.
Level 2: Market makers (intermediate liquidity). Market makers continuously quote buy and sell prices while hedging through the underlying basket. Their ability to maintain tight spreads depends on hedging costs — which in turn depend on volatility and underlying liquidity. A BIS working paper (Sushko & Turner, 2018, “The implications of passive investing for securities markets”) formalizes this mechanism, showing ETF market‑making activity is procyclical: it expands when volatility is low (cheap hedging) and contracts when volatility rises (expensive hedging). This procyclicality creates the conditional liquidity paradox: abundant when least needed, rationed when critical.
Level 3: Authorized participants (structural liquidity). APs — major institutions authorized to create or redeem ETF shares in exchange for the underlying basket — form the chain’s final backstop. Their arbitrage keeps ETF prices aligned with net asset value (NAV). But this mechanism is not a contractual obligation: APs intervene when arbitrage is profitable and step back when transaction costs and inventory risks make it uneconomic. An SEC report (2015, “ETFs: Trading and Liquidity”) and a BIS Quarterly Review (March 2019) document episodes where the number of active APs on certain ETFs fell to one or two under stress — an operational risk concentration invisible in normal times.
Implication: price/NAV dislocation as a signal. When all three levels deteriorate simultaneously, ETF prices detach from NAV. This is not a malfunction; it is the price incorporating real‑time information that NAV (typically calculated once daily, often using modeled prices) has not yet reflected. A bond ETF trading at a 3% discount is not overstating risk — it may be measuring it more accurately than NAV based on stale reference prices. Such episodes indicate a liquidity shift: the underlying market is frozen, and the ETF becomes the primary venue for price discovery. Fixed‑income platform data show that during certain 2024–2025 sessions, rate ETF volumes accounted for 30–40% of total trading in corresponding government bonds — evidence that ETFs intermittently become the main price‑formation venue.
- Price/NAV gap in normal regimes: < 0.1–0.2% for large equity ETFs (2018–2023). Source: asset managers’ data, exchanges.
- Price/NAV gap in stress: 1–3% for bond ETFs (summer 2025), 3–5% for high‑yield ETFs (March 2020). Sources: Bloomberg, market data.
- Order‑book depth in stress: decline of 40–60% during sessions with VIX > 30 (2025). Source: market microstructure data.
- ETF market share: 30–40% of total traded volume in some fixed‑income segments during stress sessions (2024–2025). Source: fixed‑income trading platforms.
- BBB credit spreads — eurozone: roughly 120 bps (mid‑2021) to 190–220 bps (autumn 2025). Source: aggregated bond indices.
What the Consensus Gets Right — and the Structural Risk It Downplays
The mainstream view, shared by ETF providers, a large portion of market consensus and major exchange analyses, rests on a solid argument: the liquidity chain has broadly withstood recent turbulence, including the March 2020 COVID shock and the mini‑crises of 2023–2025. Price/NAV dislocations have generally been temporary. APs have continued to operate. Markets have not jammed permanently. This diagnosis is not false — resilience mechanisms have worked in observed episodes.
Its limitation lies in an implicit extrapolation: if the chain resisted shocks of magnitude X, it will resist shocks of magnitude 2X. This ignores the mechanism’s non‑linearity. The BIS (Quarterly Review, March 2024) notes that market makers’ and APs’ absorption capacity is not proportional to stress: it deteriorates sharply when volatility crosses certain thresholds, when carry costs become prohibitive, or when the underlying market itself dries up. Recent episodes have tested the chain under moderate stress — not in a configuration combining a fixed‑income liquidity crisis, an equity sell‑off and a breakdown in credit confidence.
The consensus is therefore right to note past resilience, but conflates tested robustness with absolute robustness. The ETF liquidity architecture is designed to absorb shocks, but its absorption capacity is itself procyclical — it declines as stress increases, precisely when it would be most needed.
Confusing volume with depth in ETF markets. High daily volume does not guarantee liquidity in stress: a significant portion stems from technical flows (arbitrage, rotations, quant) that evaporate when volatility spikes. Order‑book depth (size available at best prices) is a more relevant indicator — and it falls by 40–60% when the VIX moves from 15 to 30. Another mistake: treating all ETFs as homogeneous. Liquidity tensions play out very differently for an S&P 500 ETF versus a vehicle exposed to high‑yield credit or emerging‑market debt.
| View: “the chain proved resilient” | View: liquidity is conditional | |
|---|---|---|
| Implicit assumption | Past resilience guarantees future resilience | Absorption capacity is procyclical and non‑linear |
| Observed signal | Temporary, resolved price/NAV dislocations | Simultaneous deterioration across the three levels under stress |
| Type of test endured | Moderate shocks (isolated volatility spikes, localized sell‑offs) | No full test combining fixed‑income liquidity crisis + equity sell‑off + credit breakdown |
| Main risk | Over‑regulation that reduces market flexibility | Liquidity discontinuity on the most fragile segments |
| Key variable | Volumes, number of APs, spreads in normal regime | Order‑book depth under stress, price/NAV gap, ETF share of total volumes |
Heterogeneity, Procyclicality and Feedback: the Complexity of ETF Liquidity
The general degradation pattern conceals sources of complexity that alter the risk profile depending on ETF type and the macro environment.
Radical heterogeneity across segments. The liquidity profile of an ETF tracking the S&P 500 (ultra‑liquid underlying, 500 continuously traded names, dozens of active APs) is practically unrelated to that of a high‑yield ETF (structurally illiquid underlying, over‑the‑counter bonds, prices often model‑based). Historical data confirm this asymmetry: during March 2020, price/NAV discounts on high‑yield ETFs reached 3–5%, while S&P 500 ETFs dislocated only by 0.2–0.5% (Bloomberg). The same logic applies to emerging‑market debt, small‑cap equity ETFs and structured credit exposures — segments where the underlying is less liquid than the ETF itself. This radical heterogeneity makes blanket analyses of “ETF liquidity” structurally misleading.
Procyclicality of intermediation. Market‑making costs for ETFs are directly linked to the market regime. During a low‑rate, low‑volatility period (2015–2021), market makers could offer ultra‑tight spreads because hedging carry costs were negligible. The monetary regime shift since 2022 has mechanically raised these costs: with 10‑year real rates around 1.5–2.5% and structurally higher volatility (the MOVE index has remained roughly 40% above its 2015–2021 average), market‑making conditions have deteriorated. This degradation is gradual and hard to detect day‑to‑day — yet it lowers the chain’s capacity to absorb a sudden shock. The delayed effects of restrictive monetary policy weigh on market microstructure as much as on the real economy.
ETF→underlying feedback loop. When ETFs account for an increasing share of traded volume in a segment, a feedback loop can emerge: a large ETF sell‑off forces market makers to sell the underlying to hedge, which reduces underlying liquidity, which worsens ETF arbitrage conditions, which deepens the ETF discount. This mechanism — described by the BIS (Quarterly Review, March 2019) as a “feedback loop” — transforms ETFs from mere mirrors into stress amplifiers. The risk rises with ETF market share: data show ETF share reaches 30–40% in certain fixed‑income segments during stress sessions — a level where feedback becomes mechanically relevant.
Regulatory and structural risk. A less‑discussed but plausible scenario is tighter regulation targeting market makers or APs — for example, higher capital requirements for market‑making activities under Basel IV or balance‑sheet constraints. Such changes would reduce absorption capacity without the end investor noticing — ETFs would look liquid in normal times but become more sensitive to stress. The interaction between prudential constraints and market structure is part of a broader discussion on monetary policy and interest rates.
Measuring Liquidity Risk: Relevant Indicators
ETF liquidity risk is not measured by daily volumes — it is measured by the quality of the intermediation chain under pressure. Three complementary indicators can reveal deterioration before it shows up in prices.
The premium/discount between ETF price and net asset value (NAV) is the most direct indicator. In normal regimes, this gap stays below 0.1–0.2% for large equity ETFs. Persistent gaps above 1% — especially for bond or less‑liquid segments — signal structural tension between ETF and underlying. Bid‑ask spread evolution and order‑book depth measure instantaneous absorption capacity: widening spreads combined with shrinking depth indicate liquidity rationing even if volumes stay high. ETF share of total traded volume in the segment is a systemic indicator: when it regularly exceeds 30–40%, the ETF→underlying feedback risk becomes mechanically significant.
Implications for Market Readings in the Current Cycle
If the conditional‑liquidity framework holds, it changes how we read several ongoing dynamics.
For portfolio‑risk assessment. ETFs’ apparent liquidity in calm times overstates available liquidity in stress — especially when the underlying is structurally illiquid (credit, high yield, emerging markets, small caps). This does not mean avoiding these segments, but it implies embedding an implicit “liquidity haircut” in risk measurement: exiting in stress will cost structurally more than normal‑time spreads suggest. Market microstructure mechanisms confirm liquidity is procyclical across asset classes — ETFs merely crystallize this dynamic more visibly.
For the reading of the new rates regime. The environment of positive real rates and structurally higher volatility mechanically degrades intermediation conditions. Hedging carry costs rose, balance‑sheet constraints weigh on market makers, and credit spreads reflect a risk premium that raises costs across the chain. The “real cost of money” framework shows how the rates regime affects market microstructure as much as macro fundamentals — a link often overlooked.
For passive‑concentration analysis. Passive management now exceeds 50% of total assets in the United States (source: ICI, 2025) and is growing rapidly in Europe. This concentration mechanically amplifies feedback risk: the more flows are concentrated in a handful of mega‑ETFs, the more a coordinated withdrawal can overwhelm the chain’s absorption capacity. Our weekly macro bulletin integrates liquidity condition readings as a standing element.
Invalidation condition. This framework loses relevance if market architecture evolves to decouple ETF liquidity from underlying liquidity — for example, if regulators implement liquidity guarantees or risk‑sharing mechanisms among APs. It would also be invalidated by a reversion of real rates toward zero restoring the ultra‑favorable intermediation conditions of 2015–2021. Conversely, tighter regulation (Basel IV, balance‑sheet rules) or a severe liquidity shock (fixed‑income crisis combined with equity sell‑off) would amplify vulnerabilities.
Three Time Horizons to Monitor Liquidity Risk
Short horizon (0–6 months): monitor ETF price/NAV gaps for bond and credit ETFs, order‑book depth during volatile sessions, and ETF market share in total traded volume on sensitive segments. VIX and the MOVE index (bond volatility) are alert indicators. Short‑term risk is a dislocation session triggered by an exogenous shock (monetary surprise, geopolitical event) while positions are concentrated.
Cycle horizon (1–3 years): the structural question is whether the intermediation architecture adapts to the new rates and volatility regime. If market makers and APs permanently widen spreads and reduce sizes, ETF liquidity will structurally be lower than in the prior decade — an adjustment investors may not have fully priced into allocations. Regulatory trajectory (Basel IV, MiFID updates) will determine whether absorption capacity is reinforced or constrained. Interaction with the economic cycle governs the size of reallocation flows that will test the architecture.
Structural horizon (5+ years): passive concentration poses a long‑term question about market structure. If ETF share of assets and volumes continues to grow, ETF→underlying feedback risk intensifies — gradually turning ETFs from access vehicles into structural price‑formation agents. This evolution, documented in academic literature (Israeli, Lee & Sridharan, 2017) and BIS work, challenges market architecture resilience over a decade horizon.
ETF liquidity is not a stock — it is a conditional flow shaped by the market regime. The three‑tier architecture (secondary market, market makers, authorized participants) performs efficiently in calm periods and degrades procyclically and non‑linearly under stress. The risk is not intrinsic to ETFs alone; it is the risk of a market architecture concentrating massive flows on an intermediation chain whose absorption capacity is itself procyclical. The new regime of positive real rates and structurally higher volatility reduces the chain’s headroom before a severe shock tests it. The danger is particularly insidious because it remains invisible in normal times.
Robust: The three‑tier ETF liquidity architecture is a structural fact. Intermediation procyclicality is formalized in BIS (Sushko & Turner, 2018) and supported by market data. Radical heterogeneity between liquid equity ETFs and bond/credit ETFs appears in historical price/NAV gaps. The ETF→underlying feedback loop is documented (BIS, 2019; Israeli et al., 2017). The degradation of intermediation conditions in the new rates regime is measurable.
Uncertain: The stress threshold at which the chain “breaks” (a lasting dislocation, not a transient one) has not been reached in the current cycle and therefore remains unknown. APs’ and market makers’ adaptive capacity is still under assessment. The precise impact of Basel IV and future rules on intermediation capacity is debated. The possibility of a combined shock (fixed‑income crisis, equity sell‑off, credit confidence failure) — the true stress test — remains hypothetical.
Reading ETF liquidity through conditionality — rather than raw volumes — provides a sturdier framework to assess the real vulnerability of the intermediation chain and anticipate fragility points before they show up in prices.
- ETF liquidity is not a stock — it is a conditional flow whose quality depends on market regime, hedging costs and underlying liquidity.
- The three‑tier architecture (secondary market, market makers, APs) degrades procyclically and non‑linearly: abundant in calm periods, rationed in stress.
- Radical heterogeneity across segments: an S&P 500 ETF and a high‑yield ETF have completely different liquidity risk profiles — broad statements about “ETF liquidity” are structurally misleading.
- The new regime of positive real rates and elevated volatility worsens intermediation conditions, lowering the chain’s headroom before a severe shock.
- This framework would be invalidated if liquidity guarantees or AP risk‑sharing mechanisms were introduced, or if real rates reverted to near zero restoring prior intermediation conditions.
Mis à jour : 20 March 2026
This article provides economic and financial analysis for informational purposes only. It does not constitute investment advice or a personalized recommendation. Any investment decision remains the sole responsibility of the reader.