Deglobalization and Fragmentation: Geopolitics, Supply Chains, and Global Trade Shifts
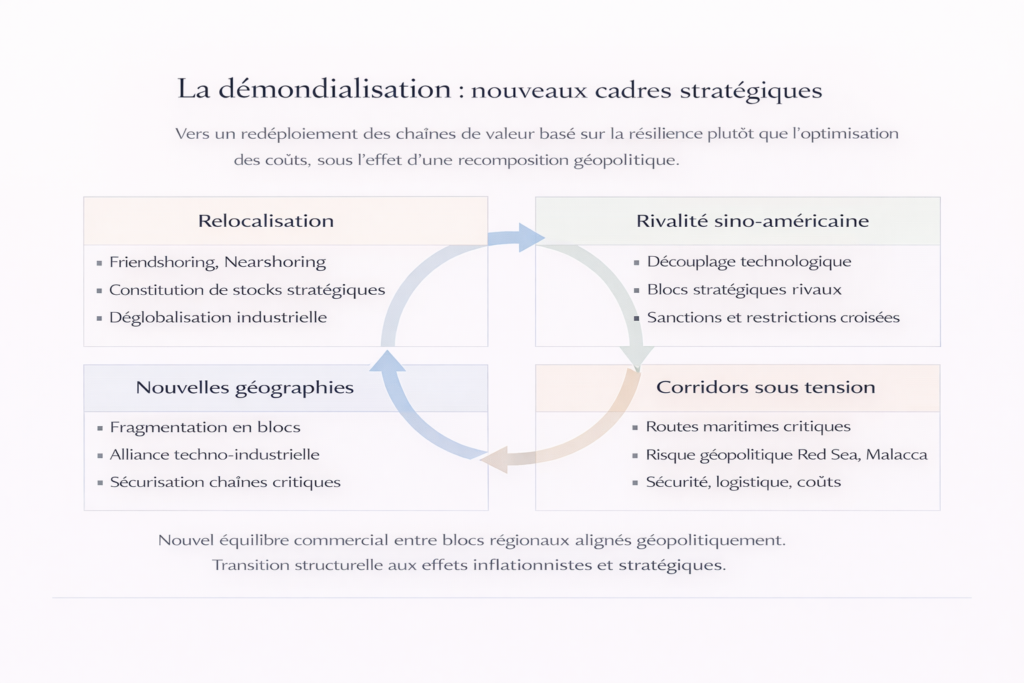
Three decades of trade integration optimized global value chains for cost efficiency at the expense of resilience. The Sino-American rivalry, the pandemic, and the war in Ukraine abruptly exposed this fragility. The logic has now reversed: reshoring, friendshoring, and the buildup of strategic inventories. Globalization was not a historical accident — nor is its reconfiguration. This structural shift, described by some as deglobalization and by others as regionalization, is redrawing the map of trade and financial flows. Its effects on inflation, industrial margins, and capital allocation will unfold over at least a decade.
Globalization as it developed since the 1990s — the free movement of goods, capital, and to a lesser extent people — is no longer the dominant regime. A new trade order is emerging, characterized by fragmentation into blocs, the return of security considerations in economic decisions, and the growing politicization of trade. This page analyzes this recomposition as a structural macroeconomic phenomenon, whose implications for inflation, productivity, and financial markets extend far beyond foreign trade alone.
What is deglobalization?
Deglobalization refers to the slowdown, fragmentation, or reconfiguration of global trade flows driven by geopolitical, health, and strategic factors. It does not mean economic closure — global trade still represented 59% of world GDP in 2023 (World Bank), versus a peak of 61% in 2008 — but rather a regionalization of flows within politically aligned blocs at the expense of global cost optimization.
The phenomenon can be measured through several indicators. The global trade-to-GDP ratio has plateaued since 2008 after three decades of continuous growth (World Bank). Foreign direct investment (FDI) into China fell from $344 billion in 2021 to $33 billion in 2023 — the lowest level in 30 years (MOFCOM, UNCTAD). Trade restrictions recorded by Global Trade Alert increased fivefold between 2017 and 2024, rising from 600 to more than 3,000 measures per year. Global trade is not collapsing: it is reorganizing along geopolitical fault lines.
How Eco3min analyzes deglobalization
Analyses published on Eco3min approach deglobalization through its logistical, geopolitical, industrial, and macroeconomic dimensions. The analytical challenge is not to determine whether globalization is “retreating” or “advancing,” but to understand how the reconfiguration of value chains alters the structural parameters of the global economy — inflation, productivity, capital flows, and comparative advantages. This page provides the interpretive framework connecting these different perspectives.
Three phases of globalization: peak, fragilization, recomposition
Commercial globalization as we know it is not timeless. It unfolded in three distinct phases, whose understanding is essential to contextualize today’s fragmentation.
1990–2008: hyper-globalization
The collapse of the Soviet bloc (1989–1991), China’s entry into the WTO (December 2001), and the creation of the euro (1999) ushered in an unprecedented phase of trade integration. Global trade in goods and services quadrupled in value between 1990 and 2008, rising from $4.3 trillion to $16.1 trillion (WTO). The global trade-to-GDP ratio increased from 38% to 61% over the same period (World Bank).
China was the primary engine of this expansion. Its exports grew from $62 billion in 1990 to $1.43 trillion in 2008 (WTO), making it the world’s leading exporter. Western multinationals massively offshored production to Asia: between 1990 and 2008, cumulative FDI into China exceeded $900 billion (UNCTAD). This offshoring exerted substantial disinflationary pressure — U.S. imported manufactured goods prices fell 7% in real terms between 2000 and 2008 (BLS), contributing significantly to the Great Moderation.
The downside of this extreme efficiency was risk concentration. In 2020, Taiwan produced 92% of the world’s most advanced semiconductors (SIA). China controlled 60% of global rare earth production (USGS). Europe depended on Russia for 40% of its natural gas (Eurostat). These cost-optimal dependencies were latent systemic vulnerabilities.
2008–2020: the first cracks
The 2008 financial crisis marked the first major interruption. Global trade contracted by 12% in 2009 (WTO) — the sharpest decline since World War II. The subsequent recovery never regained the integration pace of the previous era: the global trade-to-GDP ratio plateaued around 57–60% and never exceeded it again.
Several structural factors explain this plateau. The exhaustion of easy offshoring gains — wage cost gaps between China and Western economies narrowed significantly, with Chinese manufacturing hourly wages increasing fivefold between 2005 and 2020 (BLS International Comparisons). The rise of trade populism in advanced economies, symbolized by Brexit (June 2016) and Donald Trump’s election (November 2016) on a protectionist platform. Growing awareness of risks tied to supply chain concentration.
The trigger for active fragmentation was the U.S.–China trade war. Tariffs imposed by the Trump administration starting in March 2018 affected more than $370 billion of Chinese imports (USTR), with average rates rising from 3% to 19% on Chinese goods. China retaliated with tariffs on $110 billion of U.S. products. The Biden administration not only maintained these tariffs — it expanded them with unprecedented technology restrictions.
2020–?: accelerated recomposition
The Covid-19 pandemic acted as both a revealer and an accelerator. Disruptions to global logistics chains reached unprecedented levels: the New York Fed’s Global Supply Chain Pressure Index rose to 4.3 standard deviations above its average in December 2021. Supplier delivery times hit record highs (S&P Global PMI). The cost of a 40-foot container on the Shanghai–Rotterdam route surged from $1,500 in early 2020 to a peak of $14,000 in September 2021 (Drewry World Container Index) — a ninefold increase.
Russia’s invasion of Ukraine in February 2022 added an energy and food dimension to fragmentation. European natural gas prices (TTF) briefly reached €340/MWh in August 2022, versus a €20/MWh average over the previous decade (ICE). Wheat prices jumped 60% in two weeks, with Russia and Ukraine together accounting for 28% of global wheat exports (FAO). The disruption of Russian energy supplies forced Europe to urgently reconfigure its entire gas mix — an adjustment estimated to cost more than €200 billion in excess expenses for the European economy in 2022 (Bruegel).
The shift: from optimization to resilience
For forty years, multinational corporations built supply chains under a single principle: minimize costs. This logic led to geographic hyper-specialization and a drastic reduction in inventories, seen as unproductive tied-up capital. The U.S. inventory-to-sales ratio fell from 1.53 in 1992 to 1.25 in 2019 (Census Bureau) — an efficiency gain that turned into vulnerability once supply chains stalled.
The new doctrine emerging — sometimes under political pressure, sometimes through strategic corporate calculation — prioritizes resilience over cost. A McKinsey survey (2022) of global corporate executives found that 93% planned to diversify supply chains within three years, and 44% were considering active nearshoring. U.S. industrial inventories rebounded — the manufacturing inventory-to-sales ratio rose to 1.46 in 2022 (Census Bureau), the highest level since 2009.
This structural shift, analyzed in our report on the tension between strategic stability and economic efficiency, carries a measurable macroeconomic cost: redundancy, diversification, and safety inventories absorb capital and reduce apparent productivity. The BIS estimates that value chain fragmentation could reduce global GDP by 1% to 7% in the long term depending on the extent of decoupling (BIS, Annual Economic Report 2023).
The U.S.–China rivalry: the matrix of fragmentation
At the core of the ongoing reconfiguration lies the confrontation between the United States and China for global technological and economic supremacy. This systemic rivalry — opposing two visions of capitalism, two governance models, and two conceptions of international order — now structures global economic relations.
The tools of this confrontation have diversified considerably. Tariffs are the most visible instrument: the average effective rate on Chinese imports into the United States rose from 3.1% in 2017 to about 19% in 2024 (Peterson Institute for International Economics). In May 2024, the Biden administration added targeted tariffs of 100% on Chinese electric vehicles, 50% on semiconductors and solar cells, and 25% on steel and aluminum.
But technology restrictions represent a far more powerful lever. In October 2022, the U.S. Bureau of Industry and Security (BIS) imposed export controls aimed at preventing China from accessing the most advanced chips (< 14 nm) and the equipment needed to manufacture them — notably EUV lithography machines produced by the Dutch firm ASML, whose global monopoly on this technology makes it a strategic chokepoint. These restrictions were expanded in October 2023 and reinforced through cooperation with the Netherlands and Japan, which imposed their own export controls.
China, for its part, is accelerating its technological autonomy strategy. The “Made in China 2025” plan and its successors aim at self-sufficiency in semiconductors, artificial intelligence, aerospace, and new energy technologies. The national semiconductor industry fund (“Big Fund”) has mobilized more than $50 billion since 2014 (CSIS). In 2023, Huawei developed a 7 nm processor (Kirin 9000S) despite sanctions — an unexpected breakthrough demonstrating the limits of pure technological containment. This technological fragmentation, analyzed in our study of China-related geopolitical risk, outlines a world of two partially incompatible technological systems.
Interpreting deglobalization as a return to the classic protectionism of the 1930s. It is rather a regionalization of trade within geopolitically aligned blocs, with strong intra-bloc integration maintained. Trade between the United States and Mexico reached a record $800 billion in 2023 (Census Bureau) — proof that trade is not retreating, it is reconfiguring.
Strategic corridors under strain
Globalization relies on a network of maritime corridors whose security was long taken for granted. About 80% of global trade by volume moves by sea (UNCTAD, Review of Maritime Transport 2023). Chokepoints — the Strait of Malacca (30% of global maritime trade), the Suez Canal (12–15%), and the Strait of Hormuz (21% of global oil flows) — concentrate growing geopolitical risks.
The Red Sea illustrates this new reality. Since late 2023, attacks by Yemeni Houthi forces on commercial vessels have forced a significant share of traffic to reroute around the Cape of Good Hope. Suez Canal traffic fell by 50% between December 2023 and February 2024 (Suez Canal Authority). This detour adds 10 to 15 days to Asia–Europe routes, raises transport costs — the Shanghai–Rotterdam container rate rebounded from $1,500 to $5,500 in early 2024 (Drewry) — and exerts upward pressure on imported goods prices. Our analysis of Red Sea corridor geopolitical risk details these implications.
The most closely monitored risk remains the Taiwan Strait. A military crisis in the area would not only disrupt 50% of global container traffic passing through surrounding waters (UNCTAD), but also threaten global supply of advanced semiconductors — Taiwan-based TSMC produces 92% of the most advanced chips (< 10 nm) according to the Semiconductor Industry Association. A CSIS simulation (2023) estimated the economic cost of a Chinese blockade of Taiwan at more than $2 trillion to the global economy in the first year — a shock comparable in scale to the 2008 crisis.
These tensions along logistics corridors are not cyclical. They reflect a broader challenge to the maritime order guaranteed by U.S. naval power since 1945. As China expands its navy — from 200 to more than 370 combat ships between 2005 and 2024, becoming the world’s largest navy by number of vessels (U.S. Department of Defense) — and as other regional actors assert their ambitions, the security of trade routes becomes a structural parameter in sourcing and investment decisions.
New geographies of production
In response to these risks, firms and governments are redrawing the global industrial map. Three overlapping movements are underway, each supported by measurable investment flows.
Nearshoring: proximity as insurance
Nearshoring involves relocating production closer to end-consumer markets. The most striking case is Mexico, which in 2023 became the United States’ top trading partner again with $800 billion in bilateral trade (Census Bureau), surpassing China for the first time since 2003. FDI into Mexico reached a record $36 billion in 2023 (Secretaría de Economía), driven by automotive, electronics, and aerospace suppliers. In Europe, the trend is reflected in renewed interest in industrial sites in Eastern Europe, North Africa, and Turkey.
Friendshoring: geopolitical alignment as a criterion
Friendshoring extends this logic by adding a geopolitical alignment criterion. The objective is no longer just to produce nearby, but to produce in trusted allied countries. Vietnam saw exports to the United States triple between 2018 and 2023, rising from $50 billion to $114 billion (Census Bureau) — reflecting its role as a “China substitute” in “China+1” strategies. India is attracting massive investment in electronics assembly: Apple shifted about 14% of its global iPhone production to India in 2024 (JPMorgan), up from less than 1% in 2020.
Reshoring and industrial policy: the return of the state
Certain strategic productions are being reshored to national territories, supported by industrial policy programs on a scale unseen since the 1960s. The U.S. CHIPS and Science Act (August 2022) mobilizes $53 billion in direct subsidies and more than $200 billion in induced private investment to bring semiconductor manufacturing back onshore. Intel is building two plants in Arizona ($20 billion), TSMC is investing $40 billion in the same region, and Samsung $17 billion in Texas. The Inflation Reduction Act (IRA) allocates $369 billion to clean energy, with local content clauses favoring domestic production.
Europe is responding with the European Chips Act (€43 billion), the Net Zero Industry Act, and the Critical Raw Materials Act. Japan has allocated $25 billion to rebuild its semiconductor sector. These industrial policies, financed through massive subsidies, mark a break with the free-trade orthodoxy that prevailed since the 1980s — and raise questions about their impact on public finances, competitive distortions, and the risk of subsidy wars among allies.
Macroeconomic and financial consequences
This recomposition of global trade produces deep macroeconomic effects whose scale is measured in decades, not quarters.
Structural inflationary impact
For three decades, globalization exerted disinflationary pressure estimated at 0.3 to 0.5 percentage points per year on manufactured goods inflation in advanced economies (BIS, 2023). Its retreat reverses this dynamic: producing closer, more redundantly, and more securely costs more. The ECB estimates that value chain fragmentation could add 1 to 2 percentage points to imported goods inflation over the medium term (ECB, Economic Bulletin 2023). This structural cost contributes to keeping inflation structurally higher than in the 2010s — an aggravating factor in debates about the post-Covid inflation regime.
Reorientation of capital flows
Foreign direct investment is being massively reconfigured. FDI into China fell from $344 billion in 2021 to $33 billion in 2023 (UNCTAD) — a 90% collapse in two years reflecting both tighter Chinese regulations and multinational diversification strategies. Meanwhile, FDI into India reached $71 billion in 2023 (DPIIT), ASEAN excluding China attracted $230 billion (UNCTAD), and industrial investment in Mexico surged to record levels.
Winners and losers in financial markets
In financial markets, this fragmentation creates exploitable sectoral and geographic asymmetries. Countries benefiting from relocations — Mexico, Vietnam, India, Poland, Morocco — see structurally strengthened attractiveness. Industrial infrastructure firms (automation, logistics, energy), critical materials producers (lithium, copper, rare earths), and defense companies directly benefit from the new paradigm. Conversely, business models built on permanent global cost arbitrage — certain fast-fashion retailers and electronics assemblers dependent on a single source country — lose relevance and valuation.
Three scenarios for the decade ahead
The evolution of globalization in the coming years remains uncertain and will largely depend on geopolitical factors that are difficult to predict. Three scenarios deserve consideration.
In a managed fragmentation scenario — considered most likely by the consensus view — the U.S.–China rivalry stabilizes at a high but manageable level. Global trade reorganizes into regional blocs with sustained intra-bloc trade and more limited but maintained inter-bloc exchanges. The WTO estimates this configuration would reduce global GDP by 1% to 2% in the long term compared to full integration. Structural inflation remains moderately above central bank targets.
An escalation scenario would see the U.S.–China confrontation intensify, with deeper technological decoupling, broader cross-sanctions, and potentially a major crisis around Taiwan. In this configuration, the IMF estimates fragmentation costs could reach 7% of global GDP (World Economic Outlook, 2023). Inflation would become structurally elevated and stagflation a central risk.
A detente scenario, less likely given current dynamics, would see tensions ease due to leadership changes or recognition of the mutual costs of confrontation. Globalization would resume an upward trajectory, albeit in a more regulated form than before 2018. This scenario would require a retreat from interventionist industrial policy, which appears unlikely given bipartisan U.S. consensus favoring a tough stance toward China.
Deglobalization is not a step backward but a structural recomposition: trade flows are reorganizing along geopolitical lines rather than purely economic ones. The relevant diagnosis is not “is globalization retreating?” but “how does the reconfiguration of value chains alter the structural parameters of the global economy — inflation, productivity, capital allocation?”. The answer implies a structural cost (redundancy, proximity, security), massive investment reallocation, and a geopolitical risk premium now embedded in both sourcing and investment decisions.
← Back to the pillar page Macroeconomics and geopolitics