Soft Stagflation in 2026: How a Quiet Regime Erodes Real Returns
Moderate growth, persistent core inflation, limited room for rate cuts: the 2026 macro risk is not a crash but the slow erosion of real returns. What soft stagflation has historically done to portfolios and corporate margins, in descriptive terms — not as a playbook.

Moderate global growth, inflation still above pre-2019 norms, and resilient wage dynamics: the central macro risk in 2026 is not a crash but a soft-stagflation regime that gradually erodes real returns. Quiet on the surface, corrosive over a full cycle.
TL;DR
Soft stagflation defines the 2026 macro risk: moderate growth near 2.3–2.6% with core inflation stuck around 2.5–3% quietly erodes real returns over a full cycle.
- The IMF's January 2026 update sees 2026 global growth near 2.3–2.6%, below the roughly 3% average of 2010–2019, with the euro area running well under the global figure.
- Core inflation still sits near 2.5–3% in several developed economies, with nominal wages rising around 3–4% and squeezing margins at firms with limited pricing power.
- At 2.5–3% inflation, idle cash has historically lost roughly 10–15% of real purchasing power over five years even when nominal yields stay positive.
- Across past episodes, the late-1970s US, the 2011–2013 euro area, and 2022–2023 US windows, real equity returns ran below long-run averages with wide dispersion by pricing power.
This regime combines positive but moderate activity with persistent inflation, particularly in services. Central banks have limited room for manoeuvre, and the variable that matters for portfolios shifts from nominal performance to real performance.
In brief
- Global growth expected around 2.3–2.6% in 2026, below the 2010–2019 average of roughly 3% (IMF World Economic Outlook, January 2026 update), with the euro area running well below the global figure.
- Core inflation still near 2.5–3% in several developed economies in early 2026, despite the retreat from the 2022 peak (OECD CPI dataset, March 2026).
- Nominal wages rising around 3–4%, supporting household income but maintaining pressure on margins for firms with limited pricing power (ECB negotiated wages indicator, Q4 2025; US ECI, December 2025).
- Central-bank stance: room for rate cuts is constrained as long as services inflation remains sticky (Fed projections, December 2025; ECB Economic Bulletin, December 2025).
- For portfolios, the dominant risk in this soft-stagflation regime is weak or negative real performance over a 3–5 year horizon, rather than a sharp market drawdown.

Key trends to watch
1. Moderate and uneven growth. In the United States, annualised growth is running at around 1.5–2% in early 2026 (BEA, advance estimates Q4 2025); the euro area remains closer to 0.5–1% (Eurostat flash estimate, February 2026). The dominant trajectory is a controlled slowdown rather than an outright contraction.
2. Persistent underlying inflation. Headline inflation has converged closer to 2%, but core inflation remains around 2.5–3%, primarily driven by services. Disinflation is gradual rather than complete.
3. Resilient but cooling labour market. Official unemployment stays contained (around 4–5% across major developed economies, December 2025), but hours worked and underemployment trends suggest a gradual cooling beneath the headline figures.
4. Productivity still adjusting. Despite the wave of investment in AI and automation since 2023, measured productivity gains remain modest, around 1–1.5% per year on average across the OECD — well below the dominant technological narrative. The evidence is brought together in the breakdown of cycle phases and their market signals, and the productivity gap itself is documented in our analysis of the real economic cycle and the hidden drivers of growth.
Soft stagflation: what the macro data is signalling
The defining concept in 2026 remains “soft stagflation”. Growth is insufficient to easily absorb rising costs, but it is not weak enough to trigger a large fiscal or monetary response. Inflation does not spiral, but it does not return durably to the 1–1.5% range that prevailed in the 2010s either. The regime sits in an analytical grey zone, which is precisely what makes it harder to read than either a clear expansion or a clear recession. A companion question: what a soft landing requires.
This configuration has to be read within a broader framework combining restrictive monetary policy, high debt levels, and geopolitical fragmentation. These three forces are reshaping the trajectory of potential growth, as detailed in our broader analysis of macroeconomic and geopolitical regimes.
At the microeconomic level, the regime weighs disproportionately on:
- firms with limited pricing power (retail, industrial subcontracting);
- energy-intensive or labour-intensive sectors;
- highly indebted sovereigns facing structurally higher interest burdens than before 2020.
Take a firm operating with a 5–6% margin and facing a cumulative 4–5% cost increase without the ability to fully pass it through to prices: profitability compresses fast. The regime is less dramatic than a crisis, but more corrosive over time. The drawdown is invisible in any single quarter; it accumulates over the cycle.
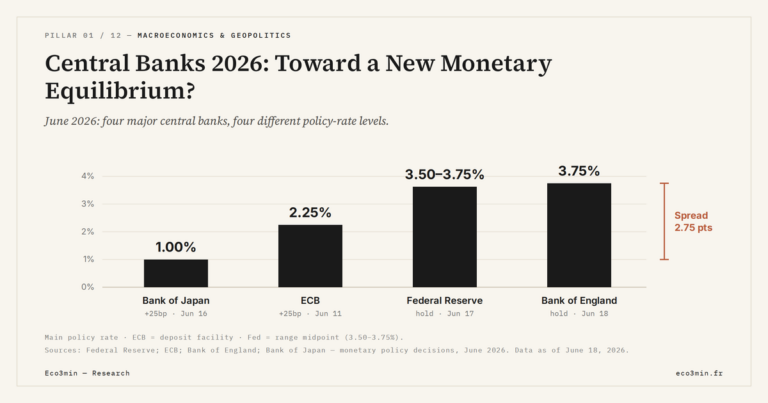
Central banks are walking a narrow path. Cutting rates too quickly risks reigniting inflationary pressures; keeping real rates too high for too long raises default risks and constrains investment. The chain of effects is traced in the inflationary macro regime atlas. That intermediate stance produces an environment in which no asset class clearly dominates after adjusting for inflation — which is the structural signature of soft stagflation.
How the regime has historically been transmitted to asset returns
Historical episodes of soft stagflation in advanced economies — the late 1970s in the United States, parts of the 2011–2013 euro-area sequence, and shorter US windows in 2022–2023 — share a recurring statistical pattern (BIS Quarterly Review datasets, December 2025):
- Real returns on broad equity indices have been below their long-run averages, with strong dispersion between sectors with stronger pricing power and sectors without.
- Nominal bond returns have been positive in periods when central banks held rates above realised inflation, but real returns have remained modest until disinflation became visible.
- Excess cash holdings, once yielding had returned, have continued to lag inflation cumulatively over multi-year windows, with a typical erosion of around 10–15% in real purchasing power over five years at a 2.5–3% inflation rate.
- Real assets (selected commodities, gold, inflation-linked bonds) have, in some windows, partially offset the erosion of cash, but with significant variability across episodes.
These observations are descriptive, not normative. They document what has happened, not what should be done.
Corporate data from the late 1970s and from 2022–2024 (IMF Corporate Vulnerability Reports, 2024 and 2025 editions) point to a few recurring patterns among firms that protected margins:
- Indexation clauses in long-term contracts were more frequent in regulated and B2B sectors than in retail-facing ones, mechanically smoothing the pass-through of input costs.
- Variable compensation tied to measurable productivity gains has, on average, accompanied earnings resilience in the same firms.
- Firms that locked in financing during the lower-rate windows of 2020–2021 reported lower financial expenses in the 2023–2025 cycle than peers who refinanced at peak rates.
These are observations from the corporate dataset, not playbooks. The transmission of the regime to firm-level results depends heavily on sector, balance-sheet structure, and contract architecture.
Weak signals to monitor
- Wage share of value added: a persistent rise would signal sustained margin pressure.
- Household savings rate: a sharp decline could support short-term consumption but weaken future demand.
- Corporate default rates: a significant rise would indicate that the real-rate environment has become overly restrictive.
- Services inflation: as long as it stays above headline inflation, full disinflation is delayed.
Outlook: 3–12 months
Scenario 1 — Prolonged soft stagflation (≈50%)
Global growth around 2–2.5%, core inflation near 2.5–3%. Moderate real returns on broad portfolios, with measurable dispersion in favour of sectors with stronger pricing power.
Scenario 2 — More pronounced slowdown (≈30%)
Credit stress and weakening demand. Central banks ease more aggressively. Higher equity volatility, with comparatively better behaviour from higher-quality bonds in historical analogues.
Scenario 3 — Gradual productivity acceleration (≈20%)
AI-driven gains begin to materialise more clearly in 2026–2027, allowing growth closer to 3% with contained inflation. Historically the most favourable backdrop for profitable-growth equities.
What the regime asks of analysis
The central risk in 2026 is neither a sharp collapse nor an overheating surge. It is the gradual erosion of real returns in a regime of moderate growth and persistent inflation. The relevant variable for portfolio analysis stops being the nominal headline and becomes the spread between portfolio return and realised inflation over a multi-year window. For firms, the corresponding variable is the spread between revenue pricing power and unit cost growth.
The 2010s reflex of treating cash, bonds, and equities as broadly interchangeable engines of real return loses traction in this regime. None of the three operates the same way. That is the part of the cycle Eco3min flags as worth watching, because it is the part the dominant 2026 narrative still under-prices.
- The dominant 2026 risk is weak real performance over several years rather than a sudden crash.
- With core inflation near 3%, idle cash erodes purchasing power even when nominal yields are positive.
- The regime rewards close attention to pricing power, contract architecture, and real-rate dynamics — variables that aggregate index data tends to flatten.
Last updated — 12 July 2026
Disclaimer – Financial Information: The analyses, commentary, and content published on eco3min.fr are provided for informational and educational purposes only. They do not constitute investment advice or a solicitation to buy or sell financial instruments. Past performance is not indicative of future results. All investment decisions involve risk and are the sole responsibility of the reader.
Read next
Full pillar →Monetary Tightening: How Central Banks Are Reshaping Financial Markets
After more than a decade of ultra-accommodative policy, monetary tightening has reintroduced the real cost of capital as…
Hidden Unemployment: Reading the Real Labor Market in 2026
Headline unemployment is stabilizing while broad underemployment still runs above pre-2020 levels. Reading the gap between official rates…
2026 Economic Outlook: Key Trade-Offs After the End of Cheap Money
2026 ushers in a more constrained macro regime where real rates stay positive, fiscal space narrows and geoeconomic…