The Fed’s Track Record: A Quantitative Audit of 70 Years of Rate Decisions — What It Got Right, What It Got Wrong, and How Late It Always Is

A monthly dataset of every Federal Reserve rate decision since 1954, cross-referenced against inflation, unemployment, and the Taylor Rule — quantifying the systematic timing errors that define central banking in practice.
The Federal Reserve is the most powerful economic institution in the world, yet its decision-making record has never been subjected to the kind of systematic, quantitative audit that any financial analyst would demand of a portfolio manager. This page provides a comprehensive monthly dataset of every federal funds rate observation from 1954 to the present, paired with CPI inflation, unemployment, NBER recession dates, and a Taylor Rule benchmark — producing the first open-access dataset designed to measure precisely how early or late the Fed has been at every turning point in the past 70 years.
The Federal Reserve has operated below the Taylor Rule in 70% of all months since 1954 — meaning its default posture is systematically too accommodative relative to the most basic policy rule in macroeconomics. Of the 14 tightening cycles in the dataset, 8 were followed by a recession within 18 months of the last rate hike. The median cycle lasts 20 months, raises rates by 306 basis points, and pauses just 4 months before the first cut. The 2022–2023 tightening — the fastest in 40 years — featured the largest hiking lag in the dataset: CPI had surged from 0.2% to 8.6% over 22 months before the first hike occurred.
Effective Fed Funds Rate
Real Fed Funds Rate
Taylor Gap
Historical Percentile
- The Fed has operated below the Taylor Rule in 70% of all months since 1954. The decades of greatest deviation — the 1970s (99% of months below, average gap of −4.53 percentage points) and the 2020s (97% below, average gap of −4.13 pp) — were also the decades of greatest inflationary stress. The only decade in which the Fed was systematically above the Taylor Rule was the 1980s under Volcker (average gap of +0.63 pp).
- Of the 14 completed tightening cycles since 1954, 8 (57%) were followed by a recession within 18 months of the last rate hike. The median tightening cycle lasts 20 months, raises the fed funds rate by 306 basis points, and pauses just 4 months before the first cut — suggesting a pattern where the Fed tightens until the economy breaks, then reverses.
- The 2022–2023 tightening cycle featured the largest hiking lag in the dataset: CPI inflation rose from 0.2% in May 2020 to 8.6% in March 2022 — a 22-month surge — before the first rate hike occurred. By the time the Fed acted, inflation had already exceeded the Taylor Rule prescription by 13.66 percentage points, the widest gap ever recorded.
- The median lag from the trough in CPI inflation to the first rate hike is 15 months across all 14 cycles, confirming that the Fed systematically waits for inflation to become well-established before responding. The median lag from the trough in unemployment to the first rate cut is 7.5 months, showing a similar delay in recognizing labor market deterioration.
- As of February 2026, the effective federal funds rate of 3.64% stands at the 42.7th percentile of its 70-year distribution. The real fed funds rate of +1.21% is almost exactly at its long-run median of 1.20%. Yet the Taylor Rule prescribes 4.65%, placing the current rate approximately 101 basis points below the rule — a gap that is moderate by historical standards but suggests policy remains mildly accommodative. For context on how real interest rates interact with equity valuations in this environment, see the Real Rates vs CAPE dataset.
859 monthly observations · CC BY 4.0 · Updated monthly · Methodology · Cite this dataset
Monthly Obs.
Tightening Cycles
FFR Maximum
FFR Minimum
Months Below Taylor
Cycles → Recession
Chart: US Federal Funds Rate — Monthly, July 1954 to February 2026
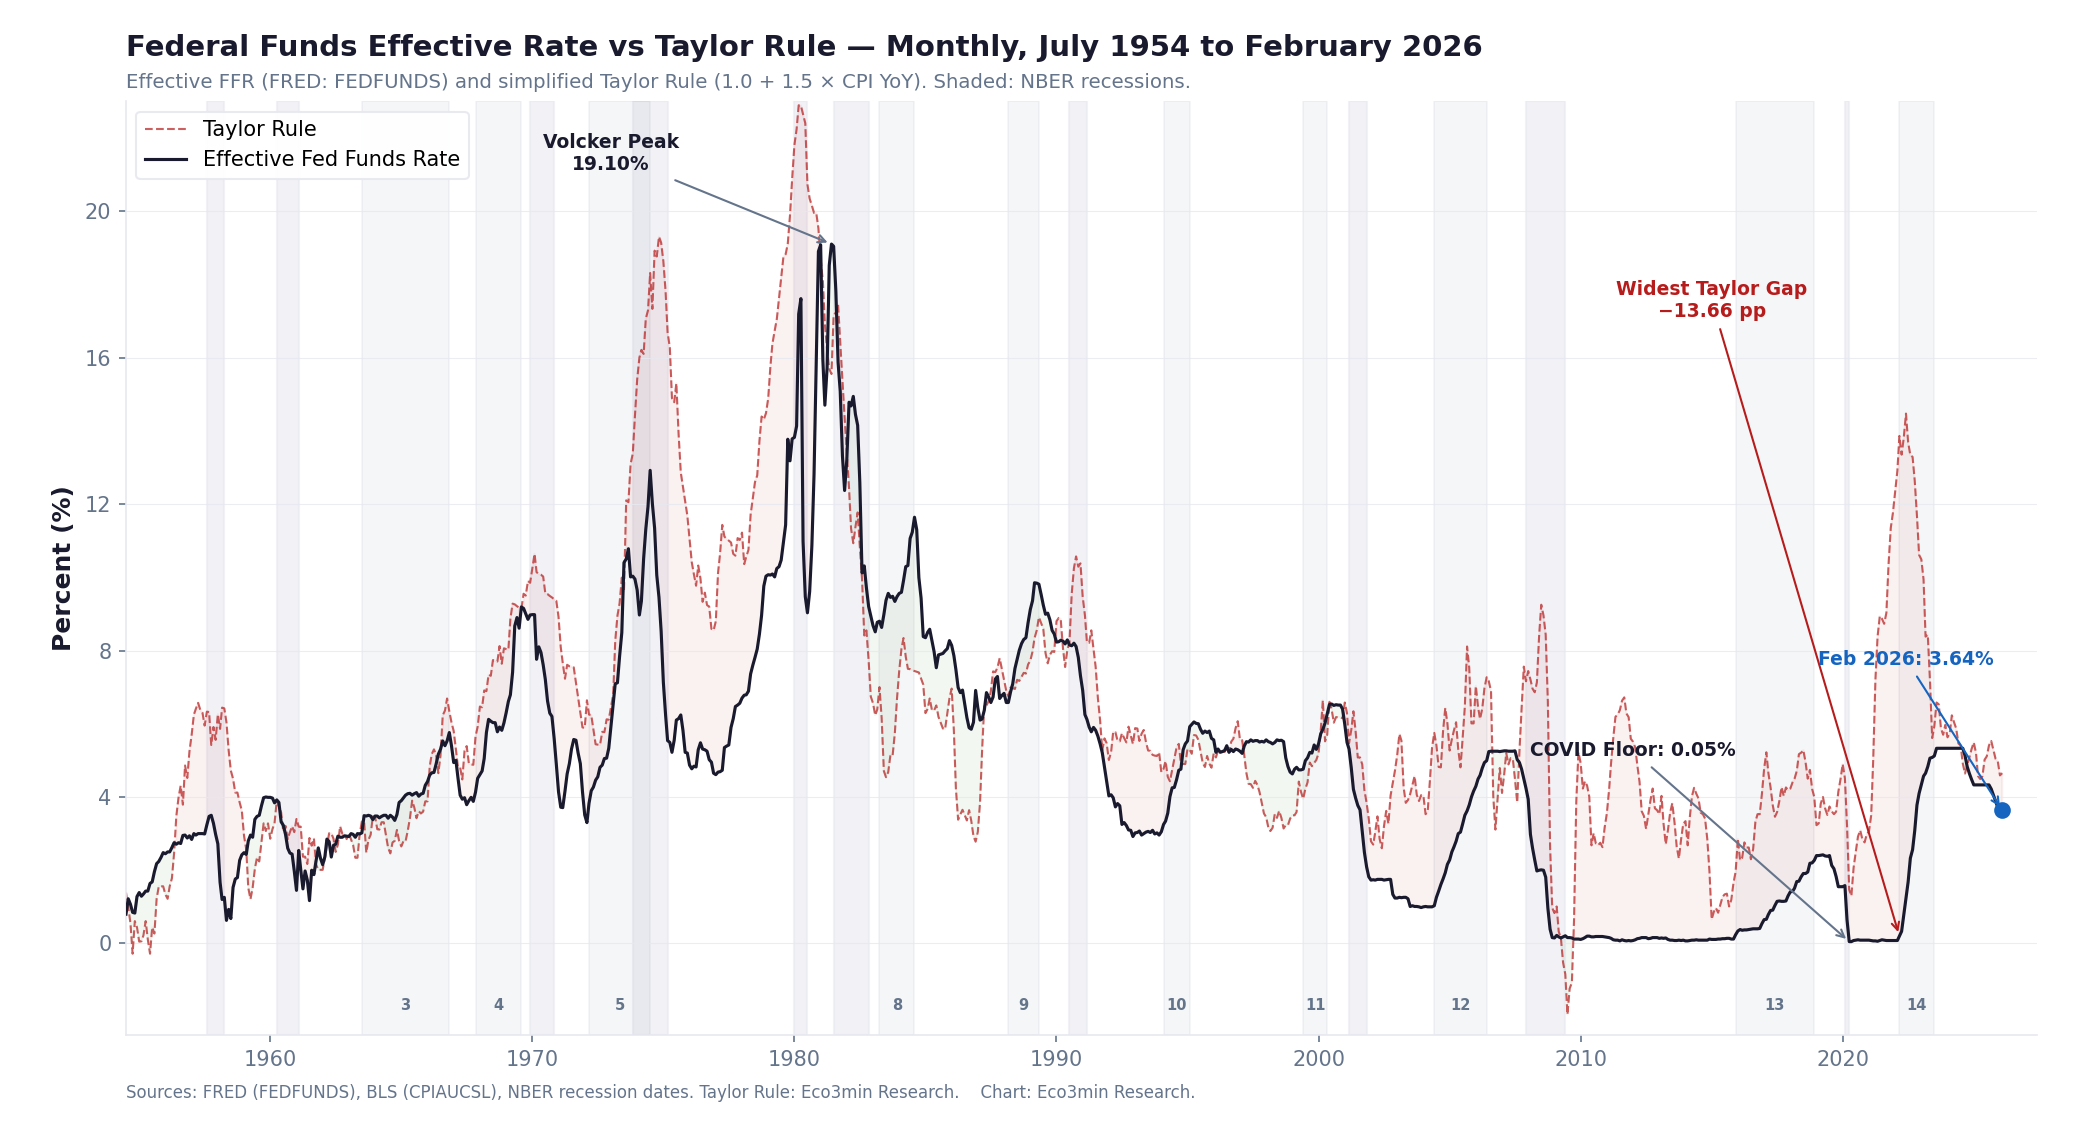
Federal Funds Effective Rate vs Taylor Rule — Monthly, July 1954 to February 2026
Effective federal funds rate (FRED series FEDFUNDS) and simplified Taylor Rule estimate (r* + 1.5×CPI YoY − 0.5×π*). Shaded areas: NBER recessions. 14 tightening cycles annotated.

The chart reveals a striking asymmetry: the Taylor Rule line runs above the actual federal funds rate for the majority of the 70-year history. The Fed’s default posture is accommodation, not restraint. The sole sustained period of the Fed operating above the Taylor Rule was the Volcker era (1980–1986), which was also the only period in the dataset where a deliberate policy of aggressive over-tightening successfully broke an inflationary regime. Every other decade shows systematic under-tightening relative to the rule.
Sources: FRED (FEDFUNDS), BLS (CPIAUCSL), NBER recession dates. Taylor Rule calculation: Eco3min Research.
Updated monthly. Latest observation: February 2026.
How to Read This Chart
The chart plots two lines across 70 years: the actual effective federal funds rate (black) and the Taylor Rule benchmark (red dashed). The Taylor Rule represents the rate that a mechanical formula — calibrated to a 2% inflation target and a 2% equilibrium real rate — would prescribe based on the prevailing level of CPI inflation. When the black line runs below the red line, the Fed is more accommodative than the rule recommends. When it runs above, the Fed is more restrictive.
Shaded gray areas mark NBER-dated recessions. The 14 tightening cycles — periods during which the Fed was actively raising rates — are annotated with their cycle numbers. For context on how the yield curve has behaved during these tightening cycles, inversions have preceded the recession that followed 8 of these 14 episodes.
The visual message is immediate: the Fed spends most of its time in catch-up mode. The Taylor Rule crosses above the actual rate well before each tightening cycle begins, and the Fed typically takes 12 to 24 months to close the gap — by which point the economy has often already shifted into a configuration where tightening triggers a slowdown.
The Reactive Central Bank: Why the Fed Is Always Late
The Federal Reserve presents itself as a forward-looking institution. The language of FOMC statements is saturated with anticipatory phrasing: “the outlook for economic activity,” “expectations of future inflation,” “balance of risks.” The empirical record tells a different story. When measured against the simplest possible policy benchmark — the Taylor Rule — the Fed has systematically lagged behind the curve at virtually every turning point in the past seven decades.
This is not a judgment about the Fed’s competence. It is a structural observation. Central banks face three institutional constraints that make reactive behavior inevitable, regardless of the quality of their analysis. First, they operate under a political mandate that penalizes premature tightening — the cost of hiking too early (recession blamed on the Fed) is more visible than the cost of hiking too late (inflation that can be attributed to external shocks). Second, they rely on lagging economic data: CPI, employment, and GDP figures arrive weeks or months after the conditions they describe, and are frequently revised. Third, their own policy transmits with a lag of 6 to 18 months, meaning the effects of any rate change will not be visible until long after the decision was made. For a detailed examination of how the CPI series itself introduces measurement delays, see the accompanying inflation history dataset.
The result is a pattern visible across every tightening cycle in the dataset: the Fed waits until inflation is well above its target, then hikes aggressively, then keeps hiking until the labor market deteriorates, then cuts — often just months after the last hike. The pattern is not episodic. It is structural.
- The median lag from the trough in CPI YoY to the first rate hike is 15 months — meaning the Fed typically waits over a year after inflation begins accelerating before it starts responding.
- The median lag from the trough in unemployment to the first rate cut is 7.5 months — meaning the labor market must deteriorate for over half a year before the Fed recognizes the damage.
- The median pause between the last hike and the first cut is just 4 months — suggesting the Fed consistently tightens to the point of economic stress, then rapidly reverses.
- In the 2022–2023 cycle, CPI rose from 0.2% to 8.6% over 22 months before the first hike — the largest hiking lag in the 70-year dataset. By March 2022, the Taylor Gap had reached −13.66 percentage points, the widest ever recorded.
The Taylor Gap: 70 Years of Systematic Policy Deviation
John Taylor’s 1993 rule — which prescribes an interest rate based on the deviation of inflation from target and the deviation of output from potential — remains the most widely used benchmark for evaluating monetary policy. The simplified version used in this dataset (which omits the output gap term due to the well-documented measurement problems with real-time potential GDP estimates) produces a single number: the rate the Fed “should” set given the current inflation rate, assuming an equilibrium real rate of 2% and an inflation target of 2%.
The Taylor Gap — defined as the actual fed funds rate minus the Taylor Rule prescription — is the proprietary metric at the core of this dataset. A negative Taylor Gap means the Fed is more accommodative than the rule recommends; a positive gap means it is more restrictive. The gap provides a consistent, mechanical measure of policy stance that can be compared across decades with very different interest rate and inflation environments.
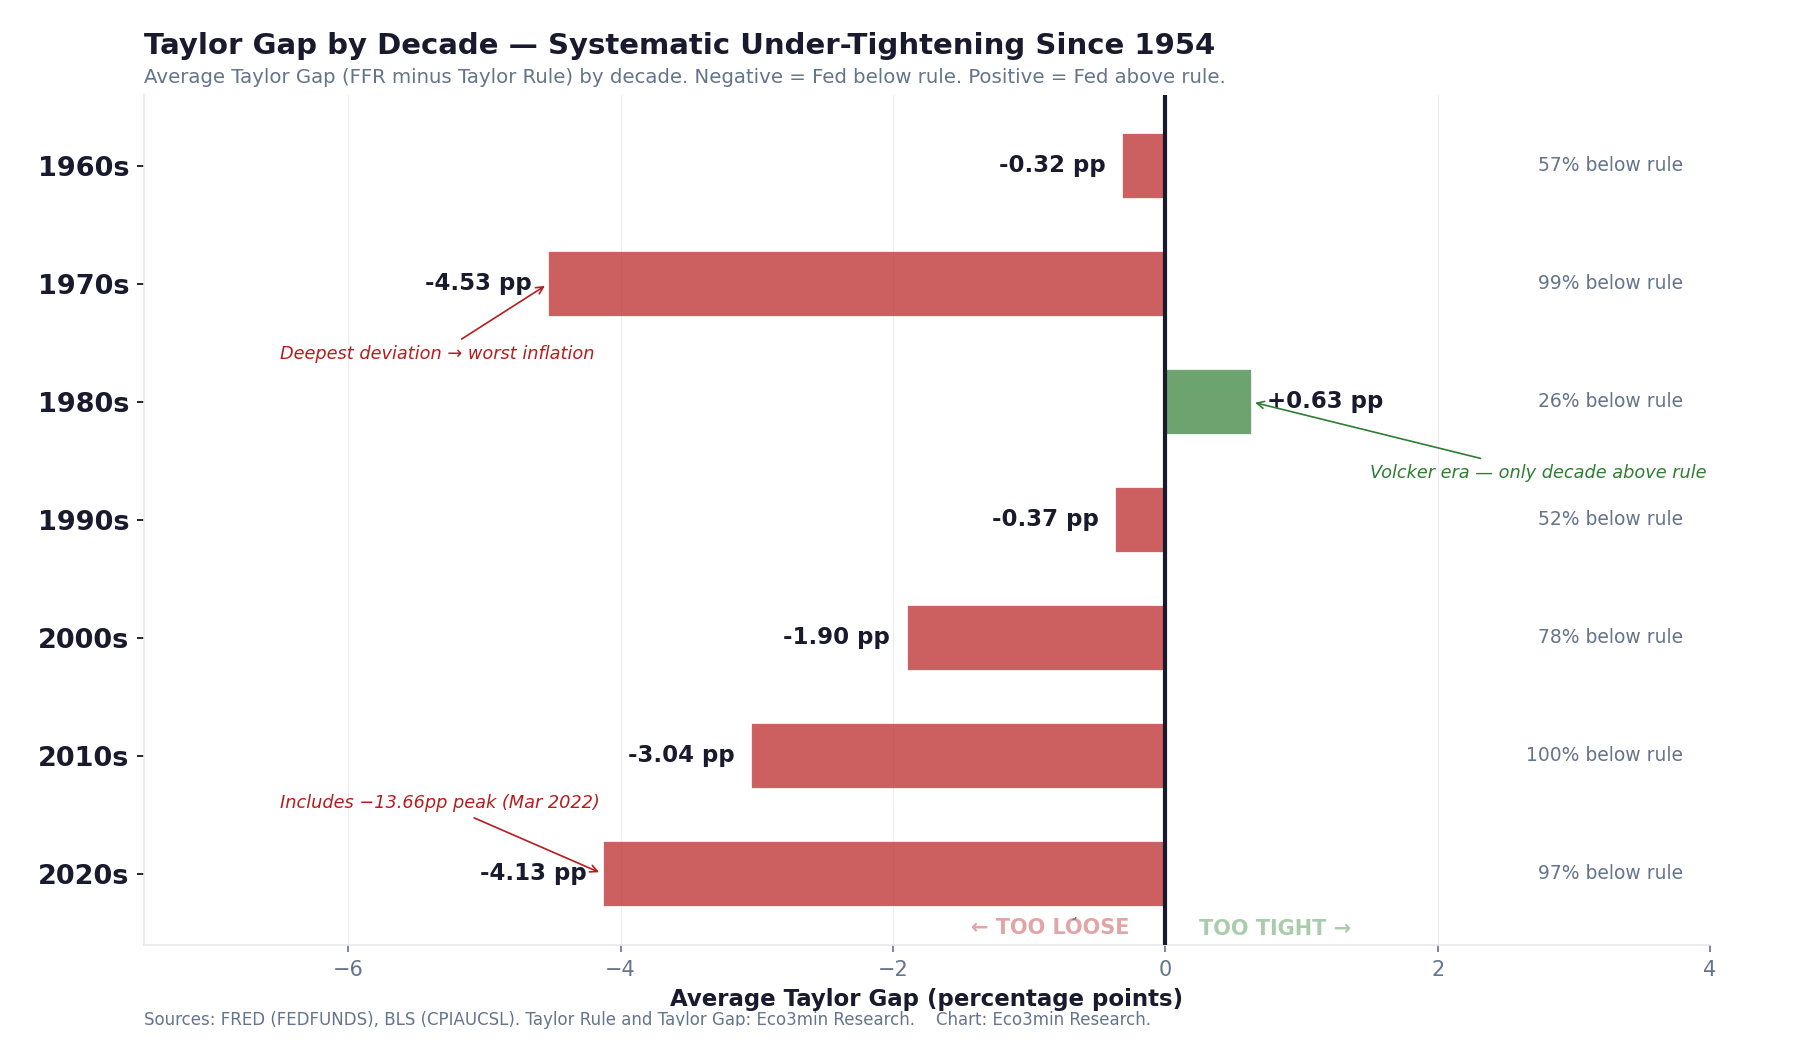
Taylor Gap by Decade — Systematic Under-Tightening Since 1954
Average Taylor Gap (actual FFR minus Taylor Rule) by decade. Negative values = Fed below rule (too accommodative). Positive values = Fed above rule (too restrictive).
The Fed’s default mode is accommodation. In six of seven decades since 1960, the average Taylor Gap has been negative — meaning the Fed has been systematically looser than even the simplest rule-based framework would prescribe. The 1980s stands alone as the only decade of above-rule policy, and it was the only decade that permanently broke an inflationary regime. The 1970s and 2020s — the two decades of deepest Taylor deviation — were also the two periods of greatest inflationary damage.
Sources: FRED (FEDFUNDS), BLS (CPIAUCSL). Taylor Rule and Taylor Gap: Eco3min Research calculation.
Updated monthly. Latest observation: February 2026.
Taylor Gap by Decade
| Decade | Avg Taylor Gap | % Months Below Rule | Median FFR | Policy Character |
|---|---|---|---|---|
| 1960s | −0.32 pp | 57% | 3.90% | Mildly accommodative |
| 1970s | −4.53 pp | 99% | 6.27% | Deeply behind the curve |
| 1980s | +0.63 pp | 26% | 9.00% | Above rule (Volcker era) |
| 1990s | −0.37 pp | 52% | 5.29% | Near-neutral |
| 2000s | −1.90 pp | 78% | 2.38% | Accommodative (post-dot-com, GFC) |
| 2010s | −3.04 pp | 100% | 0.16% | Zero lower bound era |
| 2020s | −4.13 pp | 97% | 3.72% | Post-COVID, then rapid tightening |
The decade-by-decade pattern reveals a structural asymmetry in Fed behavior. After the Volcker correction of the 1980s — the sole period of sustained above-rule policy — the Fed gradually reverted to below-rule accommodation, with each successive decade drifting further from the Taylor benchmark. The 2010s represent the extreme case: a decade spent entirely below the rule, with the effective rate at the zero lower bound for 84 of 120 months. For a broader examination of how this extended period of accommodation affected monetary regimes and market cycles, see the accompanying study.
The correlation between deep Taylor deviations and subsequent inflationary stress is not coincidental. The two decades with the worst Taylor Gaps — the 1970s (−4.53 pp) and the 2020s (−4.13 pp) — were the two decades that produced the most severe inflationary episodes in the post-war era. This does not prove causation; it does suggest that sustained under-tightening creates the conditions for inflationary breakouts when supply shocks arrive.
The 14 Tightening Cycles: Anatomy of Every Fed Hike Since 1954
The dataset identifies 14 distinct tightening cycles — defined as periods during which the Fed was actively raising the federal funds rate. Each cycle has a start date (the month of the first hike), an end date (the month of the last hike), and a set of measurable characteristics: total rate increase, duration, inflation at entry, inflation at peak, Taylor Gap at peak, and whether a recession followed within 18 months.
Complete Tightening Cycle Table
| # | Period | Duration | FFR Start | FFR Peak | Total Hike | CPI at Start | Recession |
|---|---|---|---|---|---|---|---|
| 1 | Apr 1955 – Aug 1957 | 29 mo | 1.35% | 3.24% | +189 bp | −0.3% | Yes (Aug 1957) |
| 2 | Sep 1958 – Sep 1959 | 13 mo | 1.53% | 3.76% | +223 bp | 2.1% | Yes (Apr 1960) |
| 3 | Jul 1963 – Nov 1966 | 41 mo | 2.99% | 5.76% | +277 bp | 1.6% | No |
| 4 | Nov 1967 – Aug 1969 | 22 mo | 3.88% | 9.19% | +531 bp | 3.1% | Yes (Dec 1969) |
| 5 | Mar 1972 – Jul 1974 | 29 mo | 3.30% | 12.92% | +962 bp | 3.5% | No |
| 6 | Jan 1977 – Apr 1980 | 40 mo | 4.65% | 17.61% | +1,296 bp | 5.2% | Yes (Jan 1980) |
| 7 | Aug 1980 – Jun 1981 | 11 mo | 9.03% | 19.10% | +1,007 bp | 12.9% | Yes (Jul 1981) |
| 8 | Apr 1983 – Aug 1984 | 17 mo | 8.77% | 11.64% | +287 bp | 4.0% | No |
| 9 | Mar 1988 – May 1989 | 15 mo | 6.58% | 9.81% | +327 bp | 3.8% | Yes (Jul 1990) |
| 10 | Feb 1994 – Feb 1995 | 13 mo | 3.05% | 5.92% | +287 bp | 2.5% | No |
| 11 | Jun 1999 – May 2000 | 12 mo | 4.74% | 6.27% | +153 bp | 2.0% | Yes (Mar 2001) |
| 12 | Jun 2004 – Jun 2006 | 25 mo | 1.00% | 4.99% | +399 bp | 3.2% | No |
| 13 | Dec 2015 – Dec 2018 | 37 mo | 0.12% | 2.27% | +215 bp | 0.6% | Yes (Feb 2020) |
| 14 | Mar 2022 – Jul 2023 | 17 mo | 0.08% | 5.12% | +504 bp | 8.6% | No (as of Mar 2026) |
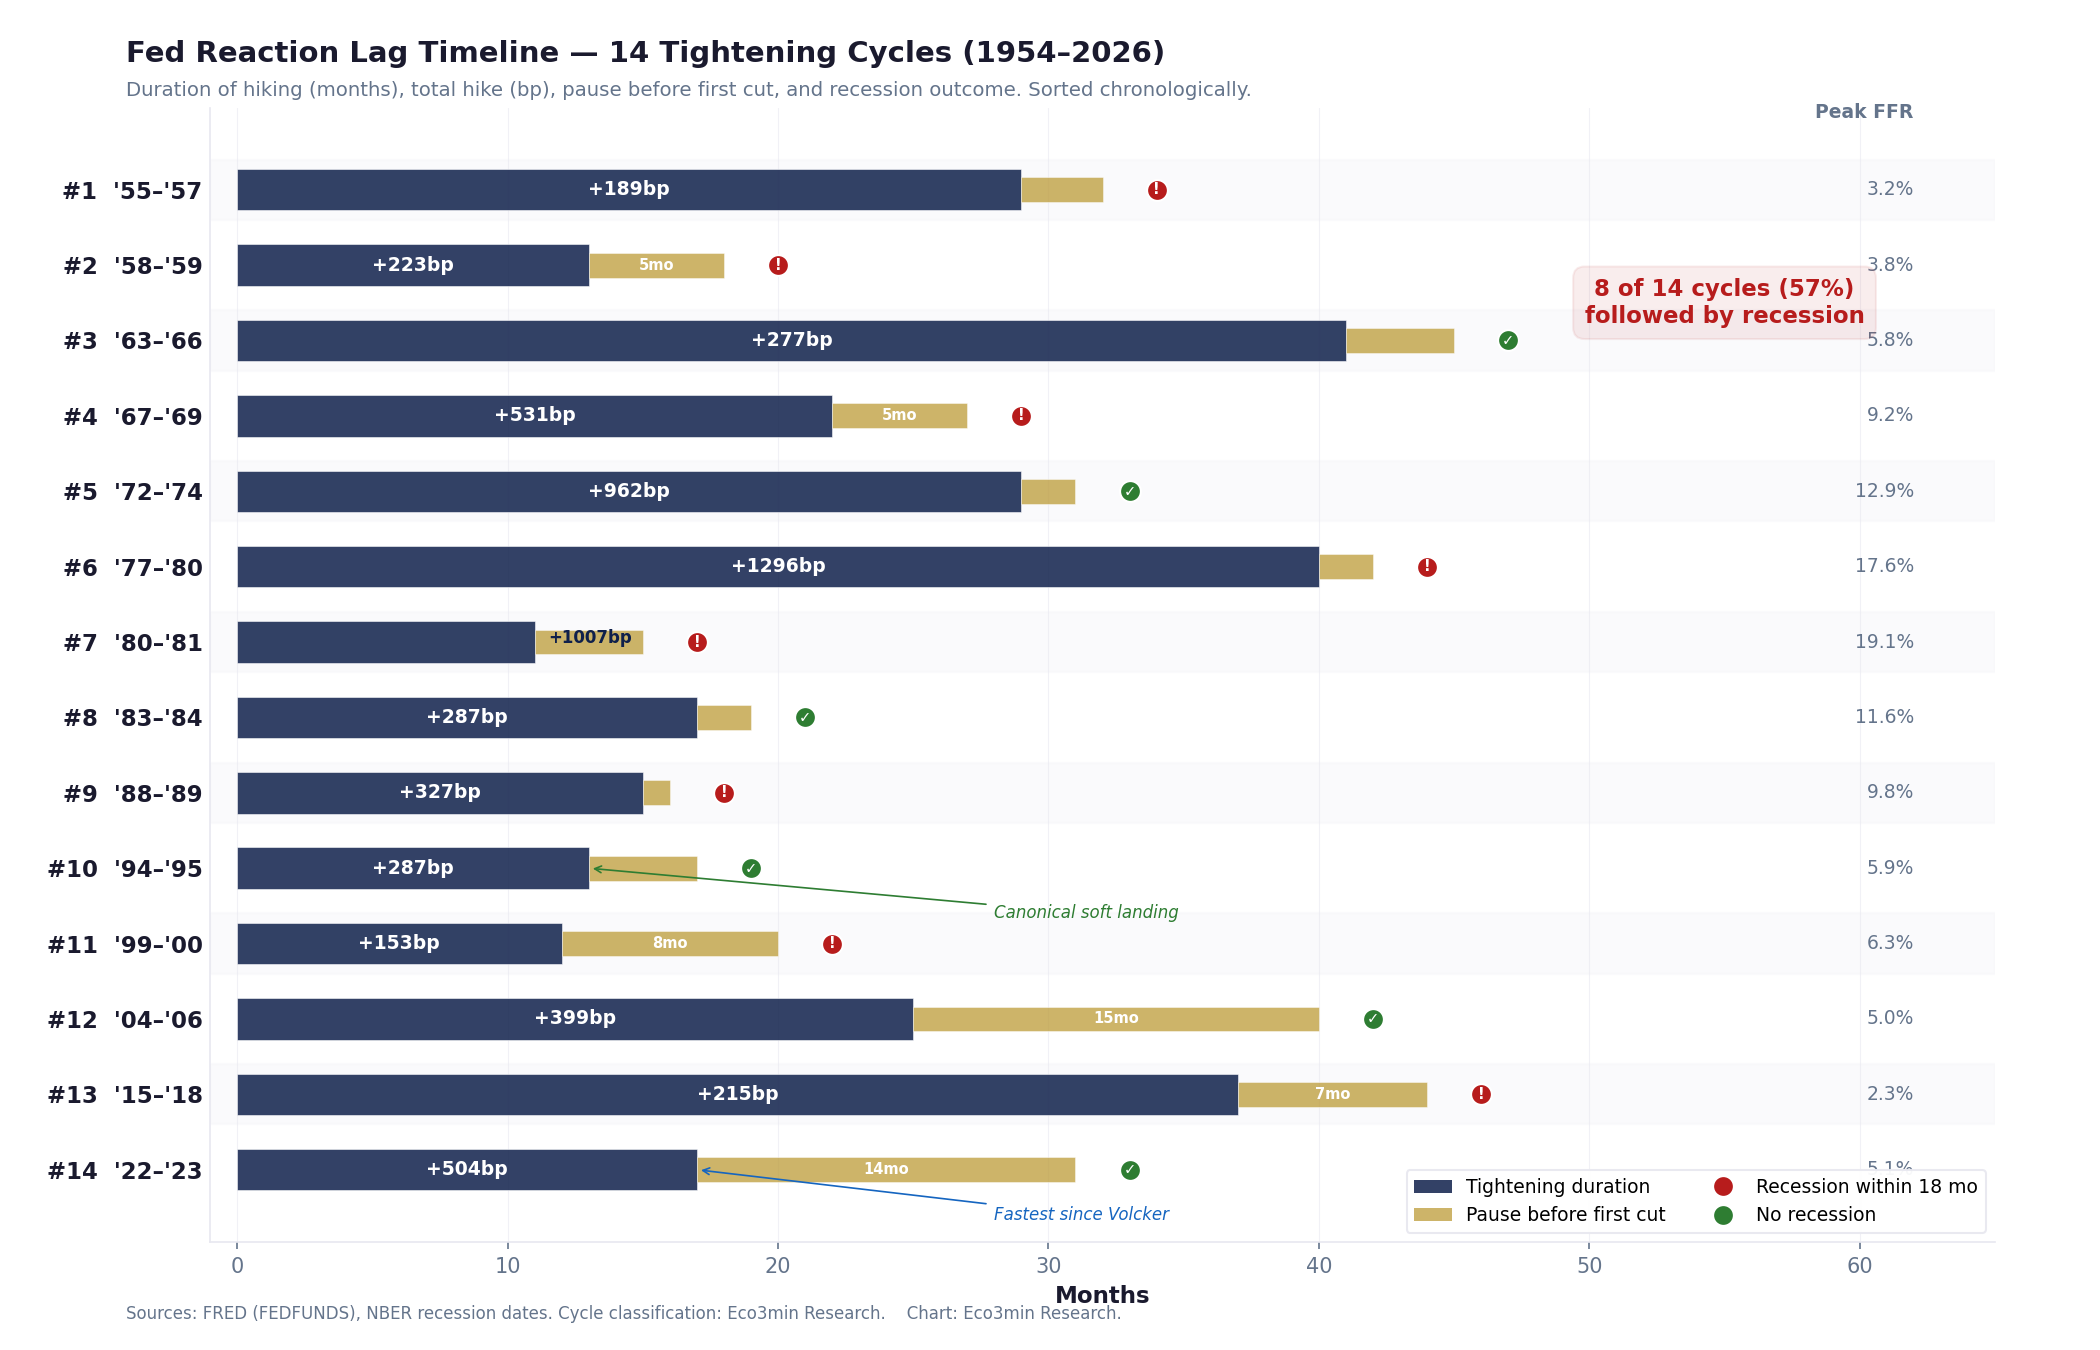
The 14 tightening cycles span a remarkable range — from the 11-month sprint of Cycle 7 (Volcker, 1,007 bp) to the 41-month crawl of Cycle 3 (1963–1966, 277 bp). The median cycle raises rates by 306 basis points over 20 months. The largest single-cycle hike was 1,296 bp in Cycle 6 (1977–1980), and the fastest pace of tightening was Cycle 14 (504 bp in 17 months — the fastest since Volcker). The two cycles with the highest CPI at their start (Cycles 7 and 14) were the two with the most aggressive tightening.
A notable pattern emerges when examining the CPI level at the start of each cycle. In 6 of the 14 cycles, CPI YoY was at or below 2.5% when the first hike occurred — suggesting the Fed acted preemptively, before inflation had clearly breached its comfort zone. In the remaining 8 cycles, CPI was already well above 3%, indicating a reactive posture. The reactive cycles — particularly Cycles 5, 6, 7, and 14 — produced the largest total hikes, because the Fed had to compensate for lost time with more aggressive tightening. The 2-year Treasury yield has historically signaled these pivot points before the Fed itself acts.
The Overshoot Pattern: How Often Does the Fed Tighten Into a Recession?
Of the 14 tightening cycles in the dataset, 8 were followed by a recession within 18 months of the last rate hike. This 57% hit rate is remarkably consistent across eras — it is not a feature of early, less-sophisticated monetary policy. Cycles 9 (1989), 11 (2000), and 13 (2018) all occurred in the era of inflation targeting and forward guidance, yet all three were followed by recessions.
The pattern suggests a structural mechanism, not a series of individual policy errors. When the Fed tightens, it does so in response to inflation — but the inflation data it responds to is backward-looking, and the tightening transmits to the economy with a lag. By the time the tightening is sufficient to slow inflation, it has often already been sufficient to push the economy into contraction. The median pause between the last hike and the first cut — just 4 months — confirms this interpretation: the Fed typically realizes it has overtightened within a few months of its last move. For an analysis of how credit spreads have signaled this stress before equity markets in each of these episodes, see the accompanying study.
Cycles 1, 4, 6, 7: The recession started during or within a year of the last hike. These are the most aggressive overshoots — the Fed kept tightening as the economy was already weakening. The Volcker cycles (6 and 7) are the deliberate versions; Cycles 1 and 4 were unintentional.
Cycles 2, 9, 11, 13: The recession arrived 7–14 months after the last hike. These represent the lag effect — the tightening was sufficient to cause a downturn, but the economy took longer to deteriorate visibly. The 2001 and 2020 recessions are the clearest examples.
Cycles 3, 8, 10, 12: No recession followed within 18 months. These are often cited as evidence that soft landings are possible. Notably, Cycle 10 (1994–1995) is the canonical example: a preemptive, well-calibrated tightening that slowed growth without causing contraction.
The fastest tightening in 40 years (+504 bp in 17 months). As of March 2026 — 32 months since the last hike — no recession has occurred. If sustained, this would join Cycles 3, 8, 10, and 12 as a soft landing. However, the real interest rate remains above its long-run median, and the Taylor Gap persists at −1.01 pp, suggesting policy is still mildly accommodative.
The Reaction Lag Timeline: A Visual Audit of Every Cycle
Fed Reaction Lag Timeline — 14 Tightening Cycles (1954–2026)
For each cycle: duration of tightening (months), total rate increase (bp), pause before first cut (months), and whether a recession followed within 18 months. Sorted chronologically.

The visual pattern is unmistakable: the majority of tightening cycles end with a recession marker. The “soft landing” cycles — 3, 8, 10, 12 — share two characteristics: the tightening began when inflation was relatively low (preemptive), and the total hike was moderate (under 400 bp). The “hard landing” cycles share the opposite: the tightening began late, when inflation was already elevated, and the Fed had to hike aggressively to compensate — producing larger total moves that the economy could not absorb without contraction.
Sources: FRED (FEDFUNDS), NBER recession dates. Cycle classification: Eco3min Research.
Updated monthly. Latest observation: February 2026.
Taylor Rule Calculator
Adjust your CPI inflation assumption to see the implied Taylor Rule rate and policy gap. Based on a simplified Taylor Rule with r* = 2% and π* = 2%.
Taylor Rule Rate
Taylor Gap
Real Fed Funds
Policy Stance
Historical Turning Points: When Rate Decisions Defined Decades
June 1981 — The Volcker Peak: 19.10%
The federal funds rate reached its all-time high of 19.10% in June 1981, the culmination of the Volcker shock — the most aggressive monetary tightening in modern history. CPI inflation had peaked at 14.6% in April 1980 and was running at 9.7% when the rate reached its zenith. The Taylor Gap was +3.5 percentage points — one of only a handful of months in the entire dataset where the Fed was above the Taylor Rule by a wide margin. This deliberate overshoot — the Fed intentionally running tighter than any rule would prescribe — was the mechanism that ultimately broke the 1970s inflationary regime. The unemployment rate rose from 7.2% to 10.8% over the following 17 months, the highest level since the Great Depression. But CPI inflation fell from 9.7% to 3.2% by the end of 1983. The Volcker episode demonstrates that breaking an entrenched inflationary regime requires above-rule tightening — precisely the posture the Fed has otherwise avoided for the entire 70-year dataset. For context, the real interest rate exceeded +9% during this period, the highest ever recorded.
March 2022 — The Widest Taylor Gap Ever: −13.66 pp
In March 2022, the Fed raised rates for the first time since 2018. CPI inflation had been rising for 22 months — from 0.2% in May 2020 to 8.6% in March 2022 — making this the largest hiking lag in the 70-year dataset. The Taylor Rule prescribed approximately 13.86% at the time; the effective fed funds rate averaged just 0.20% for the month (reflecting the mid-month hike from near-zero). The resulting Taylor Gap of −13.66 percentage points was the widest policy deviation ever recorded. From this starting point, the Fed launched the most aggressive tightening cycle since Volcker: 504 basis points in 17 months. This partial parallel to Volcker — aggressive tightening from a position of extreme accommodation — is the key structural comparison for the 2020s monetary policy episode. The critical difference: Volcker operated above the Taylor Rule throughout; the 2022–2023 Fed was still below it at the peak of tightening. For an analysis of how equity returns behaved during this extreme rate adjustment, see the S&P 500 historical returns dataset.
February 1994 — The Preemptive Ideal: Cycle 10
Cycle 10 is the canonical soft landing. The Fed began raising rates in February 1994 when CPI inflation was 2.5% — already at or near target, not materially above it. The total hike was 287 basis points over 13 months. No recession followed. The Taylor Gap at the cycle peak was +0.6 pp — meaning the Fed was slightly above the rule. This is the only modern tightening cycle that combined preemptive timing, a moderate total hike, and a positive Taylor Gap at the peak. The contrast with the 2022 cycle — which began 22 months late, required 504 bp, and never closed the Taylor Gap — could not be sharper.
March 2026 — Current Observation
As of February 2026, the effective federal funds rate stands at 3.64% within a target range of 3.50%–3.75%. The Fed has been on hold since the three consecutive 25bp cuts in September, October, and December 2025. CPI YoY is 2.4%, unemployment is 4.4%, and the real fed funds rate of +1.21% is essentially at its long-run median. The Taylor Gap of −1.01 pp places the current policy stance in the “mildly accommodative” category — similar to the 1990s average. The FOMC’s March 2026 Summary of Economic Projections signals one more 25bp cut in 2026, contingent on inflation continuing to decline toward target. The yield curve is no longer inverted, and the 10-year Treasury yield remains above the fed funds rate, suggesting the bond market does not anticipate near-term recession.
Methodology
This dataset combines three FRED monthly series — the effective federal funds rate, CPI-U, and the unemployment rate — with NBER recession dates and a computed Taylor Rule benchmark to produce a single panel optimized for monetary policy analysis.
Federal Funds Rate. The effective federal funds rate (FRED series FEDFUNDS), a monthly average of daily observations. This is the actual rate at which depository institutions lend reserve balances overnight, not the target range set by the FOMC.
CPI inflation. Year-over-year change in the Consumer Price Index for All Urban Consumers (BLS series CPIAUCSL), not seasonally adjusted. This is the same ex-post inflation measure used in the real interest rates dataset.
Taylor Rule. Simplified formulation: Taylor Rule = 1.0 + 1.5 × CPI YoY. This derives from the standard Taylor (1993) specification with r* = 2%, π* = 2%, and the output gap term omitted. The output gap is excluded because real-time estimates are unreliable and subject to large revisions — a limitation acknowledged in Taylor’s own subsequent work.
Taylor Gap. Computed as FFR − Taylor Rule. A proprietary metric unique to this dataset, measuring the deviation of actual policy from the Taylor benchmark.
Dataset Design
| Variable | Description | Unit | Source |
|---|---|---|---|
| date | Monthly observation date | YYYY-MM | — |
| fed_funds_rate | Effective Federal Funds Rate (monthly average) | Percent | FRED (FEDFUNDS) |
| cpi_index | CPI for All Urban Consumers | Index | BLS (CPIAUCSL) |
| cpi_yoy | Year-over-year CPI inflation | Percent | Calculated |
| unemployment_rate | Civilian unemployment rate | Percent | BLS (UNRATE) |
| nber_recession | NBER recession indicator (1 = recession) | Binary | NBER |
| real_fed_funds_rate | FFR minus CPI YoY | Percent | Calculated |
| taylor_rule_rate | Simplified Taylor Rule estimate | Percent | Eco3min |
| taylor_gap | FFR minus Taylor Rule | Percentage points | Eco3min |
| ffr_monthly_change | Month-over-month change in FFR | Percentage points | Calculated |
| ffr_12m_change | 12-month change in FFR | Percentage points | Calculated |
| cycle_phase | Rate direction (Hiking / Hold / Cutting) | Categorical | Eco3min |
| tightening_cycle_id | Tightening cycle number (1–14, 0 if not in cycle) | Integer | Eco3min |
| months_into_tightening | Months elapsed since cycle start | Integer | Eco3min |
| cumulative_hike_pct | Cumulative rate increase within current cycle | Percentage points | Eco3min |
| ffr_historical_percentile | Percentile rank of current FFR in full history | Percent (0–100) | Eco3min |
| cpi_yoy_percentile | Percentile rank of current CPI YoY in full history | Percent (0–100) | Eco3min |
Python Reproduction Code
import pandas as pd
import numpy as np

# Fetch data from FRED
ff = pd.read_csv(
    "https://fred.stlouisfed.org/graph/fredgraph.csv?id=FEDFUNDS"
)
cpi = pd.read_csv(
    "https://fred.stlouisfed.org/graph/fredgraph.csv?id=CPIAUCSL"
)

# Compute CPI YoY and merge
cpi['cpi_yoy'] = cpi['CPIAUCSL'].pct_change(12) * 100

# Taylor Rule (simplified, no output gap)
# r* = 2%, π* = 2%: Taylor = 1.0 + 1.5 * CPI_YoY
df['taylor_rule'] = 1.0 + 1.5 * df['cpi_yoy']
df['taylor_gap'] = df['fed_funds_rate'] - df['taylor_rule']

# Real Fed Funds Rate
df['real_ffr'] = df['fed_funds_rate'] - df['cpi_yoy']

# Export
df.to_csv("us-federal-funds-rate-history-1954-present.csv")Eco3min Macro Data Hub
— inflation, yield curves, equity returns, credit spreads and global indicators.
Dataset Download & Reproducibility
The complete dataset is provided in open formats for quantitative analysis and academic research. Updated monthly following the FRED data release.
License: Creative Commons Attribution 4.0 (CC BY 4.0). Free for research, academic, and journalistic use with attribution to Eco3min.
For researchers: The dataset includes the Taylor Gap as a precomputed variable, enabling direct use in regime-switching models, reaction function estimation, and policy rule comparisons. All 14 tightening cycles are coded with cycle IDs and intra-cycle timing variables.
Data Sources & Academic References
- Primary
Federal Reserve Bank of St. Louis (FRED) — Effective Federal Funds Rate (FEDFUNDS), monthly average of daily observations. - Primary
Bureau of Labor Statistics (BLS) — Consumer Price Index for All Urban Consumers (CPIAUCSL), not seasonally adjusted. - Primary
Bureau of Labor Statistics (BLS) — Civilian Unemployment Rate (UNRATE), seasonally adjusted. - Primary
National Bureau of Economic Research (NBER) — US Business Cycle Expansions and Contractions, recession peak and trough dates. - Research
Taylor, John B. (1993) — “Discretion versus Policy Rules in Practice,” Carnegie-Rochester Conference Series on Public Policy, 39, pp. 195–214. The original Taylor Rule formulation. - Research
Taylor, John B. (1999) — “A Historical Analysis of Monetary Policy Rules,” in Monetary Policy Rules, University of Chicago Press. Extended analysis of rule-based policy across regimes. - Research
Orphanides, Athanasios (2003) — “Historical Monetary Policy Analysis and the Taylor Rule,” Journal of Monetary Economics, 50(5), pp. 983–1022. Demonstrated that real-time Taylor Rule calculations differ significantly from retrospective estimates. - Reference
Board of Governors of the Federal Reserve System — Federal Funds Target Range (DFEDTARU/DFEDTARL), FOMC meeting statements and press conferences.
Methodological Limitations
- Taylor Rule simplification. The rule used in this dataset omits the output gap term. Taylor’s original formulation includes 0.5 × (y − y*), which requires an estimate of potential GDP — a variable that is unreliable in real time and subject to large revisions. The simplified version used here overstates the prescribed rate during recessions (when the output gap is negative) and may understate it during booms.
- Ex-post inflation. The Taylor Rule calculation uses realized CPI inflation, not the inflation expectations available to policymakers at the time of their decisions. Orphanides (2003) demonstrated that real-time Taylor Rule calculations — using only data available at the time — produce different prescriptions than retrospective calculations using revised data.
- Evolving equilibrium real rate. The dataset assumes a constant r* of 2%. In practice, the neutral real interest rate has likely declined over the past four decades, particularly since 2008. Using a time-varying r* would reduce the measured Taylor Gap in recent decades.
- Pre-1979 monetary framework. Before Volcker, the Fed did not operate with a clear inflation-targeting framework. Applying the Taylor Rule to 1950s–1970s policy involves an anachronistic benchmark that the Fed was not attempting to follow. The Taylor Gap for these periods measures deviation from a rule that did not yet exist.
- Tightening cycle boundaries. The 14 cycles are defined using the first and last months of sustained rate increases. Alternative definitions — based on FOMC meeting dates, or using the target range rather than the effective rate — would produce slightly different cycle boundaries and statistics.
- Recession attribution. Classifying a recession as “following” a tightening cycle does not establish causation. The 2020 recession (COVID-19) followed Cycle 13 by 14 months, but was caused by a pandemic, not by monetary tightening. The association is temporal, not necessarily causal.
Frequently Asked Questions
Has the Federal Reserve ever followed the Taylor Rule?
The only sustained period in which the Fed operated at or above the Taylor Rule was the Volcker era (approximately 1980–1986), when the average Taylor Gap was positive. In the 1990s under Greenspan, the Fed came close to rule-consistent behavior, with an average gap of −0.37 percentage points. Outside these two periods, the Fed has been systematically below the Taylor Rule in 70% of all months since 1954 — meaning its revealed preference has consistently been for accommodation over restraint.
How often do Fed rate hikes cause a recession?
In the dataset covering 1954–2026, 8 of 14 tightening cycles (57%) were followed by a recession within 18 months of the last rate hike. However, correlation does not establish causation — in some cases (notably the 2020 recession after Cycle 13), the downturn was caused by external factors rather than monetary tightening. The cycles most clearly linked to recessions are those where the Fed began hiking late and had to raise rates aggressively: Cycles 4 (1967–1969), 6 (1977–1980), 7 (1980–1981), and 11 (1999–2000).
What is the Taylor Rule and how is it calculated?
The Taylor Rule, proposed by John Taylor in 1993, prescribes a short-term interest rate based on the deviation of inflation from a target and the deviation of output from potential. The simplified version used in this dataset — Taylor Rule = 1.0 + 1.5 × CPI YoY — assumes an equilibrium real rate (r*) of 2% and an inflation target (π*) of 2%, and omits the output gap term due to measurement unreliability. When CPI inflation is exactly 2%, the rule prescribes 4.0%. When CPI is 5%, it prescribes 8.5%.
What is the current Fed Funds rate and how does it compare historically?
As of February 2026, the effective federal funds rate is 3.64%, within a target range of 3.50%–3.75%. This places the rate at the 42.7th percentile of its 70-year distribution — roughly in the middle of its historical range. The real fed funds rate (FFR minus CPI YoY) is approximately +1.21%, essentially at the long-run median of +1.20%. The Taylor Rule prescribes 4.65%, placing the current rate approximately 101 basis points below the rule.
Why did the Fed wait so long to raise rates in 2022?
The 2022 tightening cycle featured the largest hiking lag in the dataset: CPI inflation rose from 0.2% in May 2020 to 8.6% in March 2022, a 22-month surge, before the first rate hike occurred. By that point, the Taylor Gap had reached −13.66 percentage points. The delay reflected several factors: the Fed’s framework shift to “flexible average inflation targeting” (FAIT) in August 2020, which explicitly tolerated above-target inflation; its characterization of the inflation surge as “transitory” through most of 2021; and a labor market that had not yet fully recovered from the pandemic. The resulting late start required the most aggressive tightening since Volcker — 504 basis points in 17 months.
Can I use this dataset for academic research?
Yes. The complete dataset is available for download in CSV and Excel formats under a Creative Commons Attribution 4.0 (CC BY 4.0) license. It includes all variables needed for Taylor Rule analysis, reaction function estimation, and tightening cycle event studies. The Taylor Gap and cycle classification variables are unique to this dataset and not available in any single public source. Please cite as: Eco3min Research (2026), “The Fed’s Track Record: Federal Funds Rate History Dataset (1954–Present).”
Source
The Fed’s Track Record: Federal Funds Rate History Dataset (1954–Present).
Eco3min Macro Data Hub — Research Indicators.
Eco3min.fr/en/fed-funds-rate-track-record-dataset/
Dataset released under the Creative Commons Attribution 4.0 International License (CC BY 4.0).
Free to reuse with attribution.