Macroeconomic Analysis Tools — The Eco3min Analytical Frameworks
Reading time: 4 minutes
Macroeconomic analysis tools — the Eco3min analytical frameworks
Too often, economic and financial decisions rely on shortcuts: a single indicator taken in isolation, a recently released statistic, or a few weeks of market fluctuations.
The Eco3min approach takes the opposite view. It is structured around analytical frameworks designed to decipher underlying mechanisms, incorporate transmission delays, and identify the regimes currently at work — without ever resorting to prediction or prescription.
The tools presented here are neither automated calculations nor simulations.
They are conceptual reasoning instruments, used throughout Eco3min analyses to clarify a key stage of the analytical process.
Analysis rather than indicators: a methodological necessity
An economic indicator captures a snapshot. It rarely explains how that situation emerged or what underlying dynamics it may conceal.
The same figure can lead to completely different interpretations depending on the macroeconomic context, the timing of adjustments, or the presence of latent financial tensions.
The Eco3min tools were developed to address a fundamental question:
How can we build a rigorous economic interpretation without falling into speculative forecasting, confirmation bias, or simple reactions to headlines?
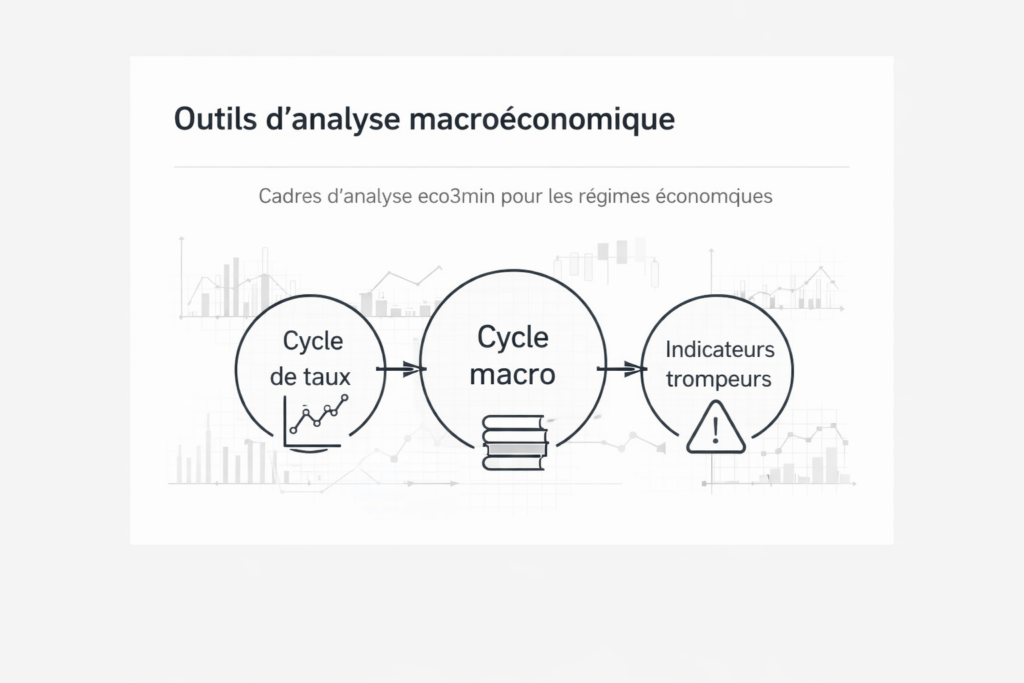
Three instruments serving economic analysis
1 — Decoding the interest rate cycle
Reducing monetary policy to the level of policy rates alone would be misleading.
Economic and financial effects depend above all on the position within the cycle, its duration, and the transmission channels involved.
The interest rate cycle framework provides an analytical structure allowing us to distinguish:
- phases of rising or falling rates and stabilization periods,
- monetary plateaus and their delayed economic effects,
- apparent easing phases versus genuine policy normalization.
This tool is used whenever analysis concerns interest rates, credit conditions, financing dynamics, or their delayed effects on the real economy and financial markets.
2 — Mapping the macroeconomic cycle
Economies do not shift from one regime to another overnight.
Transitions unfold over time, take multiple forms, and often appear reassuring on the surface.
The macroeconomic cycle mapping framework offers a qualitative approach to positioning an economic regime along several dimensions:
- real economic activity dynamics,
- financial conditions,
- behavior of economic agents,
- underlying vulnerabilities.
The objective is neither to date cycles precisely nor to forecast turning points, but to structure the interpretation of uncertain phases and conflicting signals.
3 — Anatomy of a misleading indicator
Some indicators appear “reassuring” because they remain stable or positive.
This does not guarantee that they reflect genuine structural strength in the economy or financial markets.
The tool anatomy of a misleading indicator helps identify situations where:
- apparent resilience conceals delayed vulnerabilities,
- overall stability masks sectoral or geographic imbalances,
- a consensus forms around a partial interpretation.
It is used when analysis aims to challenge a dominant interpretation or a signal perceived as excessively optimistic.
Targeted use within Eco3min publications
Each tool is used with discernment and precision.
An article references a tool only when — and only when — it provides a decisive analytical contribution to a specific part of the reasoning.
- Never more than one tool per article,
- never for decorative or promotional purposes,
- never as a substitute for genuine analysis.
If removing the link to a tool does not change the reader’s understanding of the article, then its presence is not justified.
Empirical reference base — Yield curve inversions
In addition to conceptual analytical frameworks, Eco3min provides a documented empirical database of 2Y–10Y yield spread inversions since 1976 (FRED data), as well as the observed delays preceding each recession (NBER).
This resource is not a methodological tool but a factual reference base used to contextualize restrictive monetary regimes, prolonged inversion phases, and early signals of economic slowdown.
→ Explore the database:
Complete historical record of yield curve inversions (2Y–10Y)
What these tools provide — and their limits
The Eco3min analytical tools generate neither investment signals, nor operational recommendations, nor quantitative projections.
Their purpose is to structure reasoning, clarify causal relationships, and reduce interpretative errors.
They are intended for readers seeking to understand the deeper dynamics of the economy, beyond short-term noise and conventional narratives.