
Reassuring Economic Indicators: What They Hide About Real Macro Risks
A framework for identifying three named patterns — Latency, Hidden Concentration, Consensus Crystallization — through which a reassuring indicator can mask structural vulnerability. A critical reading tool, not a forecasting one: it analyzes the reading being made of an indicator, not the indicator itself.
Operational application page for the tool. For the underlying logic, see the analysis tools hub.
- 1. The trap of apparent stability
- 2. Three patterns of misleading indicators
- 3. Pattern 1 — Latency
- 4. Pattern 2 — Hidden Concentration
- 5. Pattern 3 — Consensus Crystallization
- 6. Three historical cases with figures
- 7. Six-step application method
- 8. Common application mistakes
- 9. Scope and limits
- 10. Further reading
1. The trap of apparent stability
A stable, flat, or favorable-territory indicator is not, by construction, a sign of a robust economy or robust financial markets. Several documented historical configurations illustrate this: an unemployment rate at its multi-decade low at the end of a cycle (typical cases in the US before the 2001 and 2008 recessions), market volatility crushed just before a reversal (VIX averaging 12.8 in 2007), still-robust earnings growth on the cusp of a market downturn. In each of these cases, the indicator was not wrong — it was misread. In the same vein: the release schedule for US economic data.
The analytical difficulty stems from the fact that apparent stability feeds itself. The longer an indicator remains reassuring, the more weight it carries in the consensus; the more weight it carries, the less divergent signals are heard; the less they are heard, the more the eventual readjustment amplifies. This mechanism is empirically documented across multiple cycles, and it is precisely what the Eco3min grid seeks to identify in advance.
The tool does not seek to identify an intrinsically misleading indicator — no variable is misleading in absolute terms. It analyzes the reading being made of an indicator, in a given context, at a given moment, relative to other available signals. The grid structures this analysis around three named patterns, each defensible independently of the others.
2. Three patterns of misleading indicators
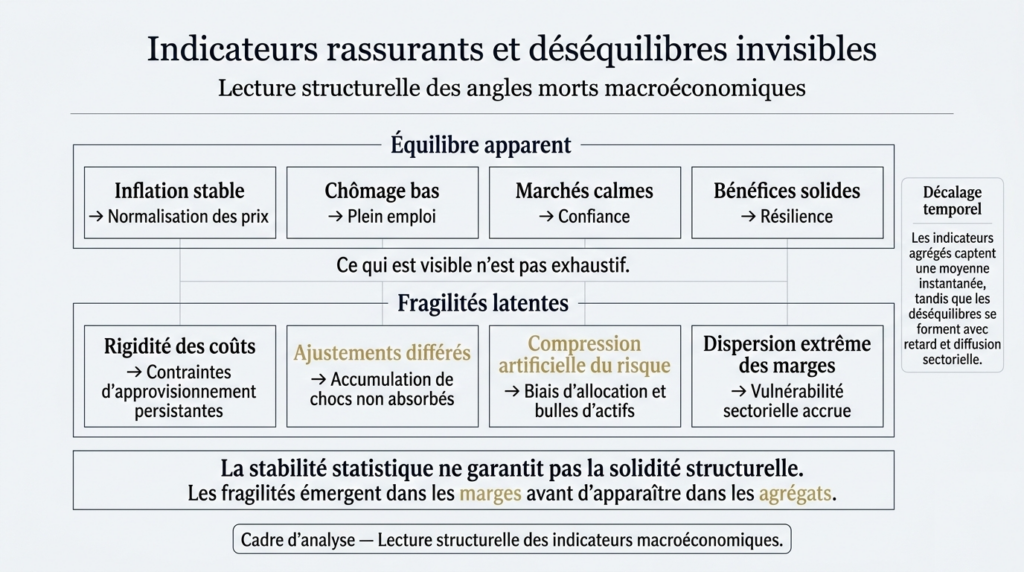
The three patterns are neither hierarchized nor exclusive. The same indicator may exhibit a single pattern, or all three simultaneously — US unemployment in late cycle 2007 combined all three. The grid requires testing each pattern distinctly, because the underlying mechanisms and control variables differ.
- Latency — the indicator is lagging by construction. Leading indicators have already shifted, but it has not yet reacted.
- Hidden Concentration — the indicator is an aggregate masking degraded intra-segment dispersion.
- Consensus Crystallization — collective convergence of attention on the indicator creates an amplified misreading risk.
3. Pattern 1 — Latency
An indicator exhibits the Latency pattern when its structurally lagging nature keeps it at reassuring levels while corresponding leading indicators have already shifted. The phenomenon does not stem from measurement error but from a construction characteristic: certain variables react only with delay to underlying economic conditions.
Mechanism. The distinction between leading, coincident, and lagging indicators is constitutive of macro analysis. A lagging indicator takes several months to register a regime change, because economic actors themselves take time to adjust decisions. A firm does not lay off staff in the first quarter of falling orders; it first freezes hiring, then cuts hours, only later — after several quarters — engages restructuring. The unemployment rate inherits this inertia.
Variables typically concerned: unemployment rate (FRED UNRATE), core inflation (CPILFESL), corporate default rates (Moody’s, S&P), corporate failures (Banque de France for France), industrial production (INDPRO) to a lesser extent.
Control variables: equivalent leading indicators — manufacturing and services PMI (NAPM, ISM), building permits (PERMIT), initial jobless claims (ICSA), 2s10s yield curve (T10Y2Y), financial conditions (NFCI, ANFCI), SLOOS bank surveys.
Analytical reading. The presence of a Latency pattern is tested across four points:
- Is the indicator known to be lagging in empirical literature? (If yes, its stability says nothing about the current phase.)
- Have the corresponding leading indicators already shifted? (If yes, latency becomes likely.)
- How many months or quarters have elapsed since the leading indicators turned? (Latency window for unemployment is typically 3 to 12 months.)
- Does a recent historical precedent show the same configuration preceding a reversal? (Typical cases: UNRATE before 2001 and 2008.)
The critical reading states: “this indicator says nothing about the current phase because it only reacts with delay.” The conclusion is not that a reversal is imminent — it is that an apparently reassuring signal does not carry the robustness information attributed to it.
4. Pattern 2 — Hidden Concentration
An indicator exhibits the Hidden Concentration pattern when its aggregate value masks degraded intra-segment dispersion. The aggregate averages, and the average can be stable while the underlying distribution polarizes: part of the system deteriorates significantly, the rest statistically compensates.
Mechanism. Macroeconomic imbalances almost always crystallize in localized pockets before contaminating the whole. A real estate crisis begins in a geographic segment or a credit-quality segment; a banking crisis begins on a few institutions with specific balance-sheet profiles; a corporate crisis begins in an exposed sector before reaching neighbors. As long as contagion has not occurred, national aggregate indicators underestimate the depth of localized deterioration.
Variables typically concerned: aggregate credit spreads (BAMLH0A0HYM2) that may mask sectoral polarization; aggregate financial conditions (NFCI) that may mask borrower-size polarization; national real estate indices (Case-Shiller national) that may mask geographic polarization; aggregate S&P 500 earnings that may mask concentration on a few mega-caps.
Control variables: sectoral decompositions (HY spreads by sector: energy, retail, healthcare), geographic (Case-Shiller 20 cities vs national), by firm size (small business credit conditions vs large corp), by quality segment (IG vs HY, AAA vs BBB), empirical distributions (P10, P50, P90) rather than averages.
Analytical reading. The presence of a Hidden Concentration pattern is tested across four points:
- Is the examined indicator an aggregate that weights potentially very different situations?
- Is a decomposition by sector, geography, size, or quality available?
- Does the decomposition reveal dispersion above recent historical norms?
- Does the deteriorated portion represent potential systemic risk (concentration on financial institutions, on a critical transmission channel, on a sovereign exposure)?
Hidden Concentration connects directly to Axis 4 (underlying fragilities) of the macroeconomic cycle diagnostic tool, which mobilizes the same granularity logic.
5. Pattern 3 — Consensus Crystallization
An indicator exhibits the Consensus Crystallization pattern when its centrality in macroeconomic commentary transforms it into a focal point of collective attention. Past a crystallization threshold, market participants no longer read the economy through the indicator — they read the indicator through their expectations of how other participants will react to it.
Mechanism. This pattern stems from the reflexive dynamics of markets and macro commentary. Once an indicator establishes itself as the reference variable for a cycle (“the unemployment rate before recession”, “core inflation”, “2s10s curve”), it concentrates analyses, positions, and hedges. This concentration creates three risks: under-weighting divergent signals, amplifying the impact of unexpected readings on the indicator, and over-reading oscillations that would have been treated as noise in the absence of crystallization.
Variables typically concerned: any indicator that has become “the barometer” of a cycle. Recent cases: US non-farm payrolls as the barometer of Fed policy 2022-2024; European CPI as ECB barometer 2022-2024; 2s10s curve as recession barometer across hiking cycles; Chinese quarterly GDP as a global growth barometer.
Control variables: Google Trends search volume on the indicator’s name; mentions in FOMC minutes or ECB press conferences; conditional position volume on the release (event options). These control variables remain imperfect — Consensus Crystallization is more delicate to measure than Latency or Hidden Concentration.
Analytical reading. The presence of a Crystallization pattern is tested across three points:
- Has the indicator become central in macro discourse to the point where a release moves markets several sigmas more than other releases?
- Are other available signals on the same question treated on par, or marginalized in favor of the focal indicator?
- Does recent history show that the indicator has been subject to over-fine reading (oscillations interpreted as signals when they were noise)?
Consensus Crystallization does not invalidate the indicator — it invalidates the excessive weight common reading grants it. This reading sits within the broader framework analyzed in our market anticipation cycles sub-pillar.
6. Three historical cases with figures
Three historical cases illustrate the three patterns without constituting a predictive template applicable to the present situation.
US unemployment 2006-2007 — dominant Latency pattern. The unemployment rate reached 4.4% in March 2007 (FRED UNRATE), its lowest since May 2001. Common reading at the time: “full employment, robust economy.” Reading through the grid: corresponding leading indicators had already shifted — HY spreads rising since mid-2006, first subprime alerts late 2006, New Century bankruptcy in April 2007, ISM manufacturing below 50 from January 2007. The recession started in December 2007 (NBER dating), 9 months after the unemployment low. The Latency pattern was the critical reading available in real time.
US NFCI 2022 — dominant Hidden Concentration pattern. The Chicago Fed aggregate financial conditions index (NFCI) remained in accommodative or neutral territory for a large part of 2022, despite the Fed hiking cycle started in March. Common reading: “financial conditions still easy.” Reading through the grid: decomposition by segment revealed marked polarization — investment grade still strained but operational, high yield gradually widening (from 320 bp in January to more than 580 bp in July on BAMLH0A0HYM2), small business credit conditions deteriorating rapidly per NFIB surveys. Localized deterioration culminated on regional banks in March 2023 (SVB, Signature, First Republic), exposures that did not appear in the aggregate NFCI.
VIX 2007 — Consensus Crystallization + Latency. VIX averaged 12.8 in 2006 and stayed below 15 for most of H1 2007. Common reading: “calm markets, normalized risk premia.” Reading through the grid: consensus crystallization on VIX as a risk barometer (the term “Great Moderation” had precisely crystallized the idea that macro and financial volatility was structurally low), combined with a Latency mechanism — VIX is a short-term coincident indicator, it cannot signal a reversal before it begins. The combination of patterns generated a particularly persistent misleading signal. This configuration crosses with the yield curve inversion history documented in yield curve inversion since 1976.
These three examples illustrate that the grid does not produce a binary signal (misleading / not misleading) but a structured critical reading. In each case, the dominant pattern was identifiable in real time from publicly available elements, by cross-referencing the focal indicator with its control variables.
7. Six-step application method
Grid application follows six structured steps. The aim is not to produce a score but to discipline analysis so that it short-circuits none of the three patterns.
- Identify the focal indicator. Which indicator deemed reassuring is the reading being tested?
- Test the Latency pattern. Is the indicator lagging? Have corresponding leading indicators shifted? How many months have elapsed?
- Test the Hidden Concentration pattern. Is the indicator an aggregate? Does available decomposition reveal intra-segment dispersion? Is the deteriorated portion systemic?
- Test the Consensus Crystallization pattern. Does the indicator concentrate disproportionate attention? Are divergent signals marginalized?
- Conclude on the dominant pattern. No pattern: the indicator is probably correctly read. A single pattern: critical reading is targeted. Multiple patterns: common reading likely warrants significant amendment.
- Document the critical reading without concluding on a trajectory. The grid identifies a misreading risk, not an imminent reversal. The analytical conclusion is: “this indicator does not say what is being made of it” — not “a reversal will happen in N months.”
8. Common application mistakes
Five recurring pitfalls weigh on grid application.
- Concluding that an indicator is intrinsically misleading. No variable is misleading in absolute terms. The grid analyzes the reading made of it, in a given context, relative to available control variables.
- Turning the critical reading into a forecast. Identifying a Latency pattern says nothing about the timing of a reversal. The lag between unemployment low and recession start is variable (3 to 14 months across documented cycles).
- Applying the grid systematically to all indicators. The grid has critical value on reassuring indicators that command consensus. Applying it to an already-stressed indicator (widening HY spread, PMI below 50) is empty — there is nothing to deconstruct.
- Ignoring the possibility that common reading is correct. The grid is a test, not a presupposition. A reassuring indicator may be correctly reassuring. The conclusion “no pattern confirmed” is a legitimate conclusion.
- Mapping a historical case onto the current phase. 2007 onto 2024, 2000 onto 2022, are tempting but often misleading analogies. Historical cases illustrate patterns; they do not validate forecasts by analogy.
Concluding that a stable indicator is necessarily a sign of robust economy, by relying on its historical trajectory alone without cross-referencing with its leading indicators, its intra-segment decomposition, and the position it occupies in the current consensus.
9. Scope and limits
This grid presents several inherent limits worth making explicit:
- It is analytically asymmetric. The grid works on apparently reassuring signals. It has no equivalent for apparently alarming signals, which call for distinct analysis (false positives of leading indicators, over-reaction to extreme signals).
- It provides no operational signal. Identifying a pattern is not an allocation recommendation, a timing signal, or a ranking of investment opportunities.
- It assumes prior empirical work. Testing Latency requires knowing the corresponding leading indicators; testing Hidden Concentration requires accessing intra-segment decompositions; testing Crystallization requires a historical reading of macro commentary. The grid structures reasoning; it does not dispense with factual documentation.
- It remains vulnerable to a reverse bias. Systematic application can lead to seeing patterns everywhere, becoming contrarian by construction. The Eco3min usage rule — one tool per publication, and only when a reassuring indicator commands consensus — is precisely the protection against this bias.
A reassuring indicator is not a true indicator; a stable indicator is not an informative indicator. The three-pattern grid separates statistical observation from the reading being made of it.
- Three named patterns characterize misleading indicators: Latency (lagging indicator that has not yet shifted), Hidden Concentration (aggregate masking intra-segment dispersion), Consensus Crystallization (attention convergence amplifying collective error).
- The three patterns can coexist on the same indicator. US unemployment 2007 combined Latency and Crystallization; VIX 2007 combined Crystallization and Latency; NFCI 2022 primarily exhibited Hidden Concentration.
- The grid analyzes the reading, not the indicator. No variable is intrinsically misleading — interpretation may be in a given context.
- The tool produces no timing signal or forecast. Its conclusion is “this indicator does not say what is being made of it,” not “a reversal will happen in N months.”
10. Further reading
- Macroeconomic analysis tools hub — return to the three-tools overview.
- Interest rate cycle dynamics — Tool 1 mobilizes the transmission dimension, where Latency is particularly present.
- Macroeconomic cycle diagnostic framework — Axis 4 (underlying fragilities) of Tool 2 mobilizes the same granularity logic as Hidden Concentration.
- Yield curve inversion history since 1976 — empirical base on an indicator frequently subject to the three patterns.
- High yield spreads as a leading indicator — empirical study mobilized for Hidden Concentration.
- Market anticipation cycles — conceptual framework on lags between markets and economic indicators.
- Macro-financial indicators & data hub — FRED, ECB, and BIS series mobilized by the tool.
Last updated — 12 July 2026
Disclaimer – Financial Information: The analyses, commentary, and content published on eco3min.fr are provided for informational and educational purposes only. They do not constitute investment advice or a solicitation to buy or sell financial instruments. Past performance is not indicative of future results. All investment decisions involve risk and are the sole responsibility of the reader.