Market Microstructure and Price Formation Mechanics
Markets do not function as perfect auctions. Behind the apparent fluidity of quotes lies an internal mechanism — order books, market makers, algorithms, zero-day options — that determines the quality of price formation. In periods of stress, this mechanism seizes up within minutes. Prices detach from any fundamental value — not because perceptions of that value have changed, but because the market’s plumbing has stopped functioning.
On August 5, 2024, the Nikkei 225 fell 12.4% in a single session — its worst day since the 1987 crash (TSE). The next day, it rebounded 10.2%. Within 48 hours, no economic fundamental had changed — no recession announced, no bankruptcy, no geopolitical shock. What changed: the massive unwinding of yen/dollar carry trade positions (~¥20 trillion in speculative positions, BoJ/JPMorgan estimates) triggered margin calls → forced selling → market-maker withdrawal → liquidity evaporation → flash crash. The same mechanism — at different scales — has repeated during every episode of market dysfunction over the past 15 years.
Market microstructure is not a technical topic reserved for traders. It is the mechanism that determines whether your order executes at the quoted price — or 5–10% lower because the order book emptied within seconds. Understanding this machinery means understanding why markets can behave irrationally for minutes or hours — and why such episodes are not anomalies but structural features of modern market architecture.
The order book: the reality behind the quoted price
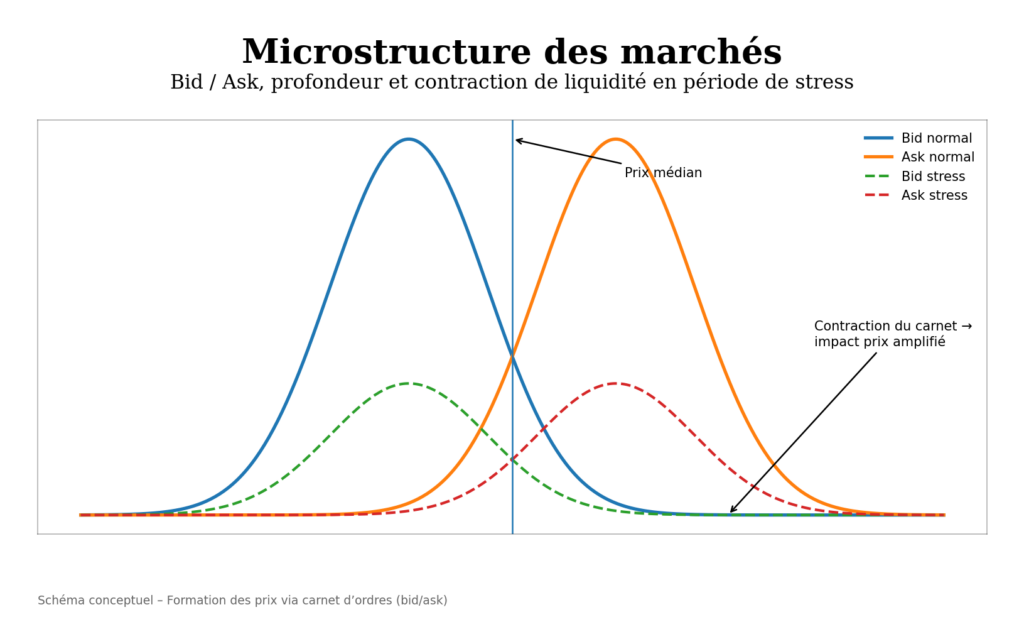
The “price” of a stock is only a snapshot — the last price at which a transaction occurred. What truly determines the ability to buy or sell is order book depth: the distribution of buy orders (bids) and sell orders (asks) at each price level. The difference between the best bid and best ask is the spread — the immediate transaction cost.
Order book depth in E-mini S&P 500 futures — the most liquid contract in the world (CME, ~2 million contracts/day) — was divided by four between 2019 and 2023: from roughly $60 million of visible depth to about $15 million (JPMorgan Market Intelligence). This means a $15 million order — a fraction of a second for a mid-sized algorithm — can move the price of the most liquid contract in the world. In small caps (Russell 2000), depth is 10–50× smaller: an order of a few hundred thousand dollars can trigger multi-percent moves.
This structural deterioration in depth is not cyclical — it results from a regime shift. The zero-rate environment (2009–2021) encouraged market makers to hold large inventories (near-zero carry cost). The high-rate environment (2022+) increases inventory carry costs → market makers reduce exposure → depth declines → markets become structurally more fragile. This is a direct transmission channel from monetary regime shifts to microstructure — analyzed in the Liquidity and Financial Conditions sub-pillar.
Market makers: the lubricant that disappears when most needed
Market makers — Citadel Securities, Virtu Financial, Jane Street, Susquehanna — continuously quote bid and ask prices, capturing the bid-ask spread in return. Citadel Securities alone executes about 25% of all U.S. equity trades (SEC filing, 2023). Their model assumes a stable environment with gradual fluctuations — profits come from thousands of small, low-risk trades, not directional bets.
In extreme volatility, the model breaks down. The risk of holding depreciating inventory before resale outweighs liquidity-provision profits. Market makers withdraw — widening spreads (from $0.01 to $0.05–0.10 in large caps, $0.05 to $0.50+ in small caps), reducing displayed size, or ceasing to quote. Liquidity evaporates precisely when most needed.
On October 15, 2014 (“Treasury flash rally”), the 10-year Treasury yield — the deepest market globally ($840B daily volume, SIFMA) — swung 37 bps intraday (NY Fed). A move that normally takes weeks was compressed into 12 minutes. Cause: simultaneous withdrawal of primary dealers and HFT algorithms. On March 24, 2020, bid-ask spreads on off-the-run Treasuries reached levels unseen since 2008 (NY Fed Liberty Street Economics) — in U.S. sovereign bonds, supposedly the most liquid asset class on earth.
High-frequency trading: 60–70% of volume, a fraction of real liquidity
High-frequency algorithmic trading (HFT) represents 60–70% of daily volume in U.S. equity markets (SEC, 2023) and 40–50% in Europe (ESMA). Major players — Citadel Securities, Virtu Financial, Jump Trading, Tower Research, Two Sigma — invest hundreds of millions in infrastructure (exchange co-location, microwave/fiber links) to gain microsecond advantages.
Under normal conditions, HFT improves apparent liquidity: S&P 500 bid-ask spreads fell from ~6 cents in 2000 to fleeting — algorithms are programmed to detect anomalies and withdraw instantly. Collective liquidity can vanish in milliseconds.
The May 6, 2010 flash crash exposed this fragility: the Dow Jones fell 998 points (~9%) in 5 minutes, then recovered in 20 minutes (SEC/CFTC joint report). Accenture briefly traded at $0.01 (NYSE). Cause: a 75,000-contract E-mini sell algorithm ($4.1B) executed in 20 minutes without price limits (Waddell & Reed, identified by CFTC) → absorption capacity overwhelmed → HFT withdrawal → stop cascades → liquidity vacuum. On August 24, 2015 (yuan devaluation), more than 1,000 U.S. securities were halted in one morning (NYSE) — circuit breakers amplified confusion. The AI, liquidity, and rapid shocks analysis explores structural implications of algorithm dependence.
0DTE options: 40% of S&P options volume — a major distortion source
0DTE options (zero days to expiration) — contracts expiring the same day — now represent more than 40% of total S&P 500 options volume (CBOE, 2024), versus less than 5% in 2019. Daily notional volume exceeds $1 trillion on some days (Goldman Sachs). This is the most significant microstructure shift since HFT’s rise.
The distortion mechanism operates through dealer hedging. When investors buy 0DTE calls, dealers hedge risk by buying the underlying asset (delta hedging). When investors buy puts, dealers sell the underlying. These hedging flows are automatic and massive — and direction depends on net market positioning.
Negative gamma (dealers net short options): dealers must sell into declines and buy into rallies → amplified moves → higher volatility. Positive gamma (dealers net long options): dealers buy into declines and sell into rallies → dampened moves → volatility compression. The gamma regime determines whether microstructure amplifies or dampens shocks — and shifts daily with options positioning. The 0DTE options market impact analysis deconstructs this mechanism.
Practical implication: a growing share of intraday moves reflects mechanical options hedging flows, not fundamental perception changes. Distinguishing signal (fundamentals) from noise (hedging flows) is impossible without understanding options positioning structure.
Indices as microstructure barometers
Certain equity indices function as leading indicators of microstructure conditions and risk regimes.
The Russell 2000 (U.S. small caps, ~2,000 stocks, median cap ~$1B) is the most sensitive liquidity barometer. These less-covered (3–5 analysts vs 20+ for S&P 500, FactSet) and less-liquid stocks react more violently to regime shifts. The Russell 2000 / S&P 500 ratio hit a 20-year low in 2024 (Russell Investments) — signaling liquidity drying up in thinner segments while the Magnificent 7 captured most flows.
The Nasdaq 100 (100 largest non-financials, ~60% tech concentration) acts as a risk appetite and rate-sensitivity thermometer. Its implicit duration (long-dated growth cash flows) makes it highly sensitive to discount-rate changes — Nasdaq fell 33% in 2022 vs -19% for the S&P 500 (S&P Global), directly linked to rates rising from 0 to 5%. The Russell 1000 reveals the true distribution of capitalization risk — complementing real-time flow rotation analysis.
Fragmentation: one stock, dozens of venues
Apple shares trade simultaneously on NYSE, Nasdaq, BATS, IEX, EDGX, and more than 10 dark pools (SEC NMS data) — roughly 16 lit venues and 40+ dark pools/ATS in the U.S. (FINRA). In Europe, MiFID II created similar fragmentation: Euronext, CBOE Europe, Turquoise, Aquis, plus systematic internalizers. Fragmentation reduced apparent costs (tighter spreads via venue competition) but complicated price formation.
Dark pools — ~15–18% of U.S. equity volume (FINRA, 2024) — let institutions execute large orders without visible price impact. But they fragment the global order book view: no participant sees total supply and demand in real time. During stress, venue desynchronization creates temporary pricing anomalies exploited by algorithms — but potentially trapping investors using market orders (no price limits).
What microstructure implies for investors
Microstructure is not academic — it has direct execution and performance consequences. Limit vs market orders: a market order during thin liquidity (pre-open, post-close, flash crash) can execute 2–5% worse than the last quoted price. A limit order protects against this risk — at the cost of non-execution if the market moves away. Execution timing: the first and last 30 minutes of trading concentrate 35–40% of daily volume (NYSE) and most volatility — implicit execution costs are 2–3× higher in these windows. Flash crashes ≠ fundamentals: a sharp unexplained drop followed by rapid rebound reflects microstructure malfunction, not perception shifts. Panic selling crystallizes losses that would have reversed within minutes — for those with sufficient liquidity and discipline, such episodes are opportunities, not alarms.
Awareness that 40% of intraday moves are now influenced by 0DTE options hedging (CBOE) and that 60–70% of volume is algorithmic (SEC) helps contextualize price action. Not all price signals are equal: some reflect fundamental perception shifts (earnings releases, policy decisions, geopolitical shocks) — others are mechanical noise from internal market plumbing. Distinguishing the two is a core analytical skill — developed in the Hidden Tensions and Stress Indicators sub-pillar.
The 0DTE options analysis deconstructs intraday distortion mechanisms. The Russell 2000 as a cycle signal clarifies liquidity conditions in thinner segments. The Nasdaq 100 as a risk barometer links rate sensitivity and risk appetite. The AI and rapid shocks analysis explores structural implications of market algorithmization.
← Back to pillar page Financial Markets