Monetary Transmission to Corporate Earnings: Time Lags, Margins, and Rate-Cycle Effects
A central bank decision takes between twelve and twenty-four months to fully appear in corporate income statements. This lag — documented by the San Francisco Fed (Friedman, 1961; Havranek & Rusnak, 2013) yet rarely integrated into standard sector analysis — is one of the primary sources of market misinterpretation. The transmission chain linking a policy rate hike to operating margin contraction passes through several successive stages: cost of credit, financing conditions, pressure on expenses, volume adjustments, and earnings expectation revisions. Each link introduces its own time delay, which explains why quarterly results can remain solid long after tightening begins — and deteriorate well after easing starts. This sub-pillar traces the mechanism end-to-end, connecting monetary dynamics analyzed in Monetary Policy & Rates to companies’ operational realities.
Corporate results do not reflect current monetary conditions, but those of twelve to twenty-four months ago. This latency makes linear interpretations — “rates are rising, therefore companies are suffering” — systematically out of sync with reality.
Monetary policy does not act instantly. Its effects propagate through a chain of channels — market rates, bank credit, financial conditions, aggregate demand — whose lags vary across sectors and cycles. Understanding these delays is a prerequisite for any coherent reading of monetary impact on companies.
→ Monetary policy transmission lags: why effects take time to materialize
Two tightening cycles, two transmissions: 2004–2008 and 2022–2025
A comparative study of the last two major U.S. tightening cycles allows the transmission mechanism — and its delays — to be empirically documented.
2004–2008: slow transmission and final collapse
The Fed raised rates from 1% to 5.25% between June 2004 and June 2006 — 17 consecutive hikes in 24 months (Federal Reserve). During the first two years of tightening, S&P 500 earnings continued to rise: aggregate EPS increased by 14% in 2005 and 18% in 2006 (S&P Global). Operating margins peaked at 9.3% in 2006 (Census Bureau, QFR). Market consensus concluded that the economy could absorb tightening without damage.
Deterioration materialized with an 18–24 month lag. Interest expenses of U.S. non-financial corporations rose by 35% between 2005 and 2007 (Federal Reserve, Flow of Funds). Corporate default rates, which had bottomed at 0.8% in early 2007 (Moody’s), surged to 13.4% by late 2009. S&P 500 EPS collapsed by 92% between the 2007 peak and the 2009 trough. The sequence illustrates the classic pattern: strong results masking fragility buildup, followed by abrupt collapse once lags unwind.
2022–2025: the fastest tightening, the most monitored transmission
The 2022–2023 cycle was unprecedented in speed: 525 basis points in 16 months, versus 425 points in 24 months previously (Federal Reserve). Yet corporate earnings proved more resilient than models expected. S&P 500 EPS declined only 2% in 2023 before rebounding 11% in 2024 (FactSet). Net margins remained above 12% in 2024 (FactSet) — higher than the pre-Covid average of 10.5%.
Several factors explain this apparent resilience. The average maturity of S&P 500 corporate debt was significantly extended during the zero-rate era — from 7.2 years in 2019 to 8.4 years by end-2021 (Bloomberg) — pushing back the refinancing wall. Large U.S. corporations held roughly $2.1 trillion in cash by end-2021 (Federal Reserve, Flow of Funds), providing a temporary cushion. Elevated inflation supported nominal revenues: aggregate S&P 500 sales rose 12% in 2022 despite tightening (FactSet), as pricing offset cost increases.
But early transmission signs appeared with historically consistent lags. Net interest expenses of U.S. non-financial corporations rose 29% between 2022 and 2024 (BEA, NIPA). The refinancing wall — debt reaching maturity — totals roughly $1.9 trillion for U.S. companies between 2025 and 2027 (Moody’s), forcing progressive repricing. High-yield default rates, which had bottomed at 1.0% in early 2022 (Moody’s), rose to 3.9% by Q3 2024 — still moderate but trending upward, signaling gradual tightening transmission to fragile balance sheets.
Cost of capital: the primary transmission channel to companies
Cost of capital is the most direct link between monetary policy and operating accounts. When a central bank raises policy rates, short-term borrowing costs adjust within weeks. But a firm’s weighted average cost of capital (WACC) only recalibrates gradually, in line with refinancing and new issuance.
The magnitude of repricing is measurable. Average yields on new U.S. investment-grade bond issuance rose from 2.3% in 2021 to 5.6% in 2023 (SIFMA) — a 330-basis-point increase in two years. High-yield issuance costs jumped from 4.5% to 8.7% over the same period. This gap only gradually appears in accounts as maturities roll: a company issuing 7-year debt in 2021 will only reprice in 2028 — mechanically explaining apparent earnings resilience.
This lag does not imply monetary policy lacks immediate effects: some channels — market rates, credit spreads, liquid asset valuations — react within weeks, as shown in the rapid effects of monetary policy. But transmission to operating accounts takes longer routes. Firms with long maturities and abundant cash — U.S. Big Tech (Apple, Microsoft, Alphabet, Amazon, Meta) held over $500 billion in cash equivalents at end-2023 (SEC filings) — can delay tightening impact for several quarters. Highly leveraged structures with floating-rate debt — Russell 2000 small caps, with ~40% floating debt (Goldman Sachs) — face almost immediate impact. This heterogeneity explains growing intra-sector dispersion late in tightening phases, a mechanism analyzed on the pillar page Companies & Sectors.
The frequently observed paradox — strong earnings despite advanced tightening — stems precisely from this lag between policy decision and income statement impact. The S&P 500 interest coverage ratio (EBIT/interest expense) fell from 8.2x in 2021 to 6.1x in 2024 (FactSet) — significant deterioration masked by profit levels. This monetary policy lag relative to the real cycle fuels overly optimistic readings when earnings hold up and overly pessimistic ones when they weaken — often well after the policy inflection point.
Persistent inflation and margin compression: the data
Monetary tightening aims to reduce inflation, but that reduction itself involves long lags. During the intermediate phase — already high rates, inflation not yet contained — firms face a double squeeze: rising financing costs while operating costs remain elevated due to inflation inertia. This configuration is the most destructive for margins.
Data from the 2022–2024 cycle document this mechanism precisely. U.S. unit labor costs rose 5.2% in 2022 and 3.8% in 2023 (BLS, Productivity and Costs) while Fed Funds were already at 4.50–5.50%. The Employment Cost Index — the Fed’s preferred wage pressure gauge — remained above 4% for six consecutive quarters (BLS). Energy, after the 2022 shock (European TTF gas at €340/MWh in Aug 2022 vs €20 decade average, ICE), remained a cost burden for European industry long after spot normalization.
Firms with sufficient pricing power weathered the phase by passing through costs. Procter & Gamble raised prices by 10% on average in 2023 while maintaining volumes (earnings call Q4 2023). LVMH, Hermès and European luxury groups posted organic growth above 15% in 2023 thanks to near-zero price elasticity. Conversely, firms lacking pricing power — food retail (Walmart, Carrefour), low-cost airlines, light industry — saw margins compress by 100–300 basis points between 2021 and 2024 (FactSet, Bloomberg).
Analysis shows that inflation resists monetary tightening longer than standard models suggest. U.S. core PCE remained above 2.8% by end-2024 (BEA), 18 months after peak rates — consistent with the upper bound of historical estimates. For companies, this persistence means margin normalization occurs later and more abruptly than consensus earnings typically price in.
Interpreting temporary margin resilience as proof that tightening has “no effect” on companies. S&P 500 net margins were still at 12% at end-2024 — but interest coverage had fallen from 8.2x to 6.1x, interest expenses had surged 29%, and $1.9 trillion in corporate debt matures by 2027. Transmission lags mask gradual deterioration that only becomes visible in accounts with significant delay.
Inflation-growth-rates desynchronization: a trap for sector analysis
One of the most counterintuitive mechanisms is that inflation, growth, and interest rates do not turn simultaneously. Inflation can persist while growth slows. Rates can remain high while economic conditions deteriorate. This gap between inflation, growth, and rates creates configurations where signals contradict each other — making single-indicator sector analysis particularly hazardous.
The 2022–2025 cycle provides a striking example. In Q4 2022, U.S. CPI was still 6.5% (BLS), GDP growth remained positive (+2.9% annualized, BEA), and Fed Funds reached 4.50%. For firms, this produced a temporal scissors effect: revenues held up (supported by price inflation) while cost of capital rose quietly. Sell-side consensus expected S&P 500 EPS to grow 5% in 2023 — it ultimately fell 2% (FactSet).
Sector dispersion reveals heterogeneous transmission. Energy — benefiting from high prices — posted earnings up 156% in 2022 before falling 33% in 2023 (FactSet). Technology, despite low credit sensitivity, saw valuation multiples compress 28% (forward P/E 27x to 19x) in 2022 before rebounding. Real estate and utilities — structurally bond-proxy sectors — were hit first and hardest. Regional banks fell 30% between March and May 2023 (KBW Regional Banking Index), culminating in SVB’s failure — illustrating the late crystallization of duration risk accumulated during the zero-rate era.
This mechanism explains why earnings revisions cluster in narrow time windows during regime shifts rather than adjusting gradually as linear cycle readings would suggest.
Reading quarterly earnings through the monetary lens
Quarterly earnings releases are typically interpreted as real-time snapshots of corporate health. In reality, each quarter reflects decisions and conditions from months earlier. Strong earnings published during advanced tightening say less about current strength than about favorable conditions twelve to eighteen months prior.
The Q3 2022 earnings season illustrates this trap. Despite 300 basis points of delivered hikes, 72% of S&P 500 companies beat EPS estimates — a near-normal positive surprise rate (FactSet, Earnings Insight). Markets read this as resilience. Yet forward indicators in earnings calls told another story: mentions of “cost pressure,” “margin compression,” and “demand softening” rose 40% year-over-year (Bloomberg, NLP Earnings Call Analysis). 2023 guidance was heavily revised downward — a signal consensus took two additional quarters to fully price in.
The analytical challenge is distinguishing inertia from inflection in each release. Leading indicators — revised guidance, order book trends, financing condition commentary, free cash flow dynamics — provide more reliable signals than EPS alone. S&P 500 free cash flow declined 15% between 2022 and 2023 (FactSet), signaling underlying deterioration well before EPS adjusted — a pattern that consistently preceded downward revisions in prior cycles.
The ability to decode quarterly results beyond consensus becomes decisive during monetary transitions, precisely because reported figures and underlying dynamics diverge most.
Cycle asymmetry: easing does not repair everything
Monetary transmission is not symmetrical. Tightening causes structural damage — bankruptcies, restructurings, loss of productive capacity — that later easing does not mechanically reverse. U.S. corporate bankruptcies reached 642 in 2023 (S&P Global Market Intelligence), the highest level since 2010. In Europe, business failures exceeded pre-Covid levels in most euro-area countries by 2023 (Eurostat). These exits are irreversible — permanently reshaping sector competitive structures.
Rate cycle history shows recoveries disproportionately benefit the strongest survivors. After the 2004–2006 tightening and 2008–2009 recession, the top five firms in each S&P 500 sector captured a rising share of sector profits — a concentration trend amplified each cycle (McKinsey Global Institute, 2018). The current cycle appears similar: the Magnificent 7 accounted for more than 75% of S&P 500 earnings growth in 2024 (FactSet), illustrating recovery concentration among firms with strong balance sheets, abundant cash, and structural pricing power.
This asymmetry explains why the post-tightening recovery does not benefit all players evenly. This cycle-driven selection mechanism is one channel through which monetary policy accelerates long-term sector concentration — a dynamic rarely incorporated into standard valuation models but central to the structural analysis developed on Companies & Sectors.
Monetary policy does more than modulate short-term financial conditions. Over a full cycle, it acts as a selection mechanism that redistributes market share, eliminates fragile structures, and strengthens the most resilient players. Each tightening cycle leaves a more concentrated sector landscape than before — a trend amplified when abundant credit in the next phase finances survivor acquisitions.
Reading grid: positioning a company within the transmission cycle
Four questions help position a company’s exposure to the current monetary cycle:
What is the average maturity of its debt? Longer maturity delays tightening impact. Average S&P 500 debt maturity was 8.4 years at end-2021 (Bloomberg), providing a multi-year cushion. Russell 2000 firms show significantly shorter average maturity — around 4.5 years — and much higher floating-rate exposure (~40%), making transmission nearly immediate (Goldman Sachs, 2023).
What is its pricing power? The ability to pass higher costs to end customers determines margin resilience in inflationary environments. Firms with strong brands, dominant market positions, or subscription models (SaaS, luxury, healthcare, software) maintained or expanded margins in 2022–2024. Price-takers facing cost competition absorbed full compression.
At what stage of the cycle are current earnings? Strong results during advanced tightening may reflect favorable inertia rather than structural strength. Interest expense/EBITDA and free cash flow trends are more leading indicators than EPS for detecting inflection.
How sensitive is it to aggregate demand? Firms dependent on discretionary consumption or residential investment feel slowdown earlier. U.S. housing starts fell 22% between 2022 and 2023 (Census Bureau), transmitting tightening to construction, materials, furnishings, and mortgage credit well before service consumption softened.
These questions do not produce a predictive score, but an exposure map to the cycle that clarifies interpretation of reported earnings and guidance credibility. The inherent difficulty is that measuring the real impact of monetary policy on a specific firm requires going beyond aggregate indicators to examine the concrete channels through which tightening actually propagates.
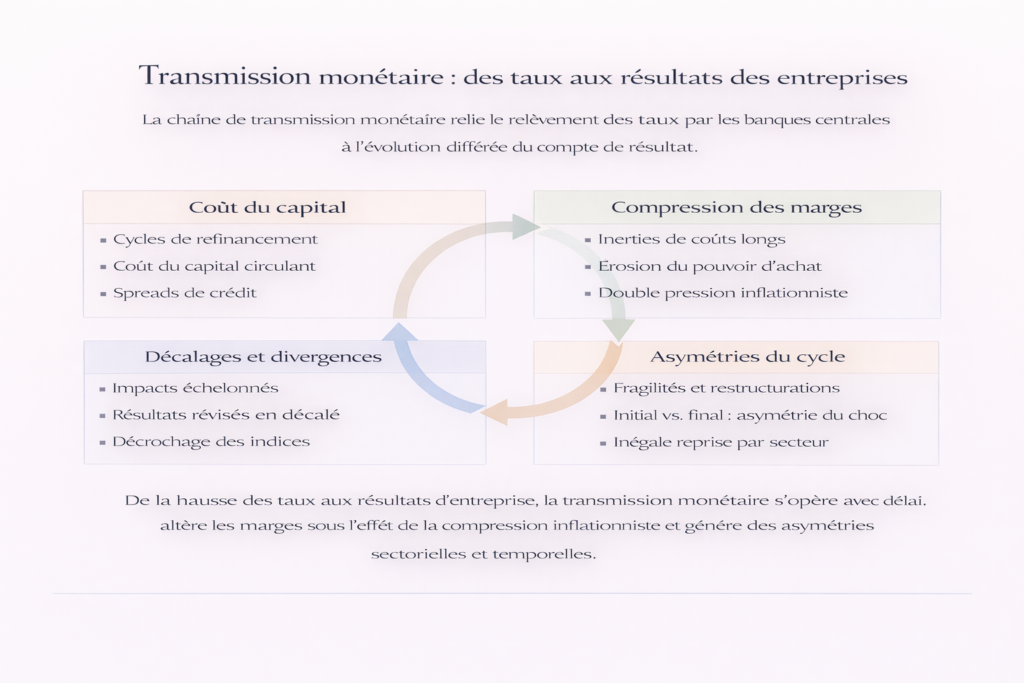
The monetary transmission chain is the structural link between central bank decisions and corporate income statements. Empirical data from the 2004–2008 and 2022–2025 cycles confirm a recurring pattern: 12 to 24 months of apparent resilience, then crystallization of tensions as refinancing walls, margin compression, and demand slowdown converge. Ignoring these lags and asymmetries leads to systematic errors — overestimating resilience during tightening phases and underestimating recovery during easing phases. The relevant diagnosis is not “Are earnings strong?” but “Which monetary conditions do these earnings reflect, and which ones will transmit to the coming quarters?”
The content of this sub-pillar does not constitute personalized investment advice under any circumstances. It describes transmission mechanisms between monetary policy and corporate results without prescribing conduct or suggesting sector positioning. Any financial decision remains an individual responsibility, ideally supported by a qualified professional.
← Back to pillar page Companies & Sectors