Real Estate Cycles: Credit, Interest Rates and Property Market Dynamics
Credit cycles, rate regimes and price dynamics: the structural mechanisms that govern real estate beyond short-term trends.
— Real estate does not follow rates. It amplifies the credit cycle that results from them.
Real estate is not a stable asset — it is a slow asset. Its volatility appears low because transactions are infrequent, price adjustments stretch over months, and illiquidity masks the reality of corrections. But slowness is not stability. When the credit cycle turns, real estate amplifies the shock with a violence that financial markets — more liquid and faster to adjust — do not experience. Global residential real estate represents roughly $260 trillion (Savills, 2024) — more than three times global stock market capitalization — and the majority of that stock is financed with credit. This combination — gigantic mass, generalized leverage, structural illiquidity — makes real estate the main amplifier of macroeconomic cycles.
To understand the key financial mechanisms behind property investment, from credit dynamics to long-term value drivers, see our investing for beginners hub.
Every major financial crisis of the last fifty years had a real estate component: Japan 1990 (real estate prices divided by 3 between 1991 and 2009, Japan Real Estate Institute), Spain and Ireland 2008-2012 (prices -35% and -54% respectively, Eurostat), US subprimes 2007-2009 (prices -33% peak-to-trough, Case-Shiller), global commercial real estate 2022-2024 (Green Street CPPI -22%, Green Street Advisors). Real estate is neither a “safe haven” nor a “conservative investment” — it is a cyclical, leveraged and illiquid asset, whose behaviour is governed by the cost of capital, credit access conditions and the prevailing macro regime. The question that structures this pillar is not “should one invest in real estate?” — it is: in which regime of real rates, credit and liquidity does the real estate market operate, and what vulnerabilities are specific to that regime?
This pillar is the real estate reading of the analytical framework developed in the Monetary Policy & Rates pillar (transmission of rates to credit), Macroeconomics & Geopolitics (cycles and regimes), Financial Markets (correlation and liquidity dynamics) and Investment Strategies (wealth allocation and risk management). The approach is non-prescriptive: no buy/sell or location recommendations. The objective is to formalize the mechanisms that determine when real estate consolidates wealth, when it weakens it, and why confusing the two is the most costly patrimonial mistake. The sub-pillars — Rates & Purchasing Power, Credit Cycle, Rental Yield, Real Estate & Inflation — each develop these dimensions.
Credit: the pivot of the real estate cycle
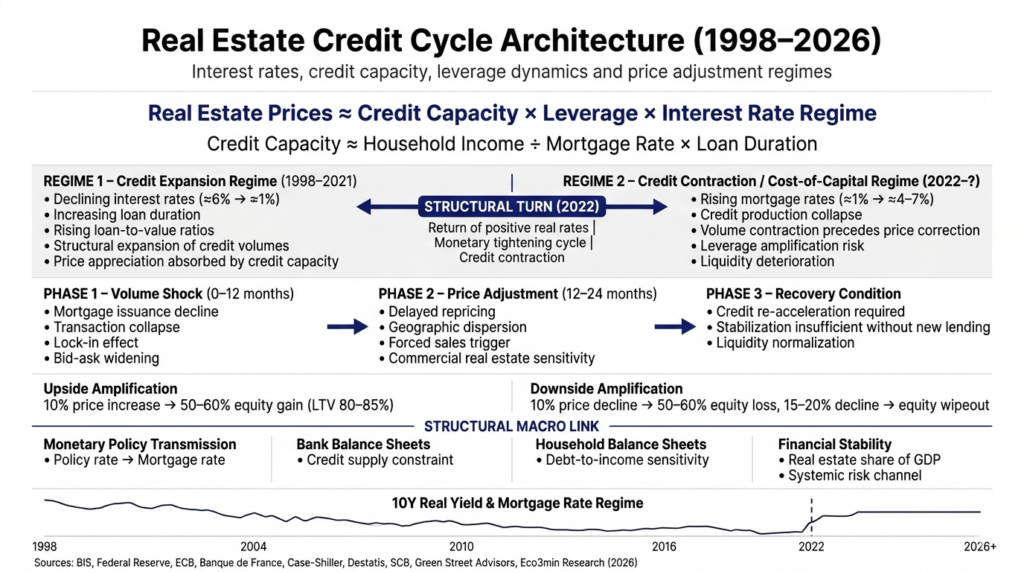
Residential real estate is the most leveraged asset in the economy. In France, the average loan-to-value (LTV) ratio for mortgages is 80-85% (Banque de France). In the United States, the average LTV of conforming loans is 80% (Federal Housing Finance Agency). In practice, a buyer with a 15–20% down payment controls an asset whose value is 5 to 6 times their deposit — a 5–6x leverage unmatched by any other retail asset class. This leverage produces a symmetric mechanical effect: a 10% rise in the property’s value enriches the buyer by 50–60% of their invested capital. But a 10% decline destroys 50–60% of equity. And a 15–20% decline — historically common — wipes out the entire down payment.
Credit is not an accessory to real estate — it is real estate. Without credit, the vast majority of residential transactions would not exist. Property prices do not reflect the “intrinsic value” of an asset — they reflect the maximum borrowing capacity of buyers at a given rate. When rates fall, borrowing capacity mechanically increases — and prices rise to absorb that additional capacity. When rates rise, borrowing capacity contracts — volumes collapse first, prices follow with delay. This sequence — volumes then prices — is the signature of the real estate credit cycle, developed in the Credit Cycle sub-pillar, and more broadly explained in why real estate prices rise and fall.
Total outstanding residential mortgage credit in France is about €1.3 trillion (Banque de France, 2024) — roughly 48% of GDP. In the United States, outstanding residential mortgage debt reaches $13.2 trillion (Federal Reserve, 2024) — about 47% of GDP. In the UK, roughly 55% of GDP (Bank of England). The Bank for International Settlements (BIS) has extensively documented how this stock of mortgage credit constitutes the principal transmission channel between monetary policy, the banking system and the real economy — and why residential credit cycles are structurally longer, more powerful and more destructive than classic financial cycles (BIS, Annual Report 2014; Drehmann, Borio, Tsatsaronis, 2012).
Interest rates and purchasing power: the relentless arithmetic
The decisive factor for real estate is not the price per square meter — it is the total cost of credit. The arithmetic is relentless and yet systematically underestimated. For a €250,000 loan over 25 years, moving from 1.0% (average France 2021, Observatoire Crédit Logement/CSA) to 4.0% (end-2023 France average) increases the monthly payment from €942 to €1,319 — +40%. At constant income and a constant debt-to-income threshold (35%, HCSF standard in France), the borrowing capacity of a household earning €4,000/month falls from €330,000 (1% rate) to €236,000 (4% rate) — a loss of 28% purchasing power. This mechanism is purely arithmetic — it needs neither a recession nor a banking crisis nor a confidence shock to operate.
The monetary tightening of 2022–2023 demonstrated this in real time. The ECB raised key rates from 0% to 4.50% in 14 months (ECB). French mortgage rates rose from ~1.0% to above 4.0% (Observatoire Crédit Logement/CSA). Mortgage production collapsed by 50% between the 2022 peak and the 2023 trough (Banque de France). Transaction volumes on existing homes fell by more than 20% (Notaires de France). Prices corrected by 5–10% on average nationally, with larger declines in some areas (-15% in Paris for high-end properties, Notaires de France). In Germany, the correction was more severe: residential prices fell 10–14% between mid-2022 and end-2023 (Destatis). In Sweden, the correction reached -15% (SCB). The Rates & Purchasing Power sub-pillar develops this arithmetic and its implications by market in depth.
Reasoning in price per square meter rather than in total cost of credit. A property at €300,000 with a 1% rate results in €283,000 of interest over 25 years — a total cost of €283,000. The same property at 4% results in €146,000 of interest — but the monthly payment is 40% higher, excluding part of the pool of buyers. Price per square meter is only an indirect reflection of borrowing capacity — it is the cost of credit that determines the real price.
1998-2021: the regime that shaped real estate habits
French residential real estate experienced a 23-year bull run — the longest in its history. Prices rose by a factor of 2.5 on average nationally between 1998 and 2022 (Notaires de France/INSEE). In Paris, prices rose from roughly €3,000/m² in 2000 to over €10,000/m² in 2020 (Notaires de France). This cycle produced a set of widely internalized beliefs: “real estate always appreciates in the long run”, “property is a safe haven”, “buying is always better than renting”.
These convictions are not natural laws — they are the properties of a specific regime. The 1998–2021 cycle was driven by three converging forces. The long-term decline in interest rates — French mortgage rates fell from about 6% in 1998 to 1.0% in 2021 (Observatoire Crédit Logement/CSA) — mechanically multiplied households’ borrowing capacity, enabling higher prices at constant monthly payments. Longer loan terms — from 15 to 25 years on average (Banque de France) — further increased capacity. Looser lending standards — higher LTVs, more permissive debt-to-income ratios — broadened the pool of eligible buyers.
The US cycle followed a comparable path: the Case-Shiller National Home Price Index doubled between 1997 and 2006, corrected by 33% between 2006 and 2012 (subprimes), then rose 70% between 2012 and 2022 (S&P/Case-Shiller). The UK, German, Spanish and Australian cycles each have their chronology — but the engine is identical everywhere: falling rates increased borrowing capacity, which was entirely absorbed by higher prices. When the engine reverses — when rates rise — the process reverses as well.
2022: the turnaround of the credit cycle
The monetary tightening of 2022–2023 inverted the engine of the cycle. The sequence is identical in every economy — only the amplitude varies according to the structure of the national mortgage market (fixed vs variable rates, loan durations, prudential regulation).
Phase 1: collapse in volumes (6–12 months). Transaction volumes collapse first — this is the most reliable leading signal of a real estate reversal. In France, mortgage production fell by 50% (Banque de France). Existing-home transactions dropped from 1.2 million in 2021 to under 850,000 in 2023 (Notaires de France). In the US, existing home sales fell to 4.0 million annualized at end-2023 — the lowest since 2010 (NAR). The mechanism is the lock-in effect: owners who borrowed at 1–2% refuse to sell and repurchase at 4–7%, which contracts supply while reducing the pool of solvent demand.
Phase 2: price adjustment (12–24 months). Prices adjust with a lag — market illiquidity means sellers keep prices until forced to transact. In France, the correction averaged 5–10%, with significant geographic disparities (Notaires de France). In Germany, the correction reached 10–14% (Destatis). In Sweden, -15% (SCB). Commercial real estate experienced a harsher correction: the Green Street CPPI (US) fell 22% (Green Street Advisors), with office property particularly hit by the combination of remote work and higher capitalization rates. In China, the real estate downturn since 2021 is a larger structural crisis — new home sales fell 50% between 2021 and 2023 (NBS), and major developers (Evergrande, Country Garden) defaulted.
Phase 3: the question of recovery. The signal of a recovery is not price stabilization — it is the restart of credit volumes. As long as mortgage production does not pick up, prices cannot structurally rise — at best they can stabilise in an illiquid market. The Credit Cycle sub-pillar develops this sequence and the signals to watch at each phase.
Real estate and inflation: protection under strict conditions
Real estate is commonly presented as a hedge against inflation — the “ultimate safe haven.” This assertion is empirically conditional — it only holds in a specific regime, and reverses in another.
When real estate protects against inflation: in a regime of negative real rates — when inflation exceeds interest rates. Fixed-rate debt is then repaid in depreciated currency — inflation erodes the real value of debt. Rents, which are often indexed (IRL in France, CPI elsewhere), rise with inflation. The real value of debt falls while nominal rental income rises — the ideal scenario for an indebted owner. This was the prevailing regime in France between 2020 and 2023 (inflation 5–6%, mortgage rates still around 1–2% for existing borrowers).
When real estate amplifies the inflation shock: in a regime of positive real rates and monetary tightening — when central banks raise rates to fight inflation. Rising rates compress borrowing capacity (arithmetic documented above), cause volumes to fall, then prices to follow. Inflation raises construction and renovation costs (materials, energy). Operating costs increase (energy, condominium charges). Market liquidity dries up. The 2022–2023 episode demonstrated this unambiguously: despite inflation at its highest in 40 years, property prices corrected — because monetary tightening outweighed the “safe-haven” effect. The full analysis is developed in the Real Estate & Inflation sub-pillar.
Rental yield: the gap between headline and reality
Gross rental yield — annual rent divided by purchase price — is the most cited and most misleading figure in property investment. It systematically hides frictions that determine what actually remains in the investor’s pocket: taxes (income tax on rental income, social contributions, property tax), unrecoverable charges (condominium fees, major works, insurance), vacancy (1–3 months per year on average across the cycle), management fees (6–10% of rents if outsourced), cost of credit and borrower insurance.
The gap between advertised gross yield and net real yield commonly reaches 40–50%. A 5% gross yield in a mid-sized town (annual rent €10,000 on a €200,000 property) typically falls to 2.5–3% net after charges and taxes — and potentially under 2% net-net after the cost of credit. In a regime of positive real rates (T-bills 5.25%, TIPS 2.40%, Federal Reserve), a net rental yield of 2–3% does not compensate for real estate’s specific risks — illiquidity, concentration in a single asset, tenant risk, dependence on credit. The detailed calculation and market comparisons are developed in the Rental Yield sub-pillar.
The local dimension: demographics, territory and disparities
Real estate is the only major asset whose value is fundamentally local. An Apple share has the same price in Paris and Tokyo. A square meter in Paris and a square meter in Béziers only share the unit of measure — price dynamics, liquidity, demand and outlook are radically different.
Demography is the long-term structural determinant. Metropolitan areas with positive net migration (Paris inner-city, Lyon, Bordeaux, Nantes in France; Austin, Nashville, Tampa in the US) benefit from structural demand that cushions corrections. Areas with negative net migration and accelerated ageing — declining industrial towns, deep rural areas — are exposed to a structural price decline that the credit cycle only accelerates. In France, the price gap between the 1st decile (declining towns) and the 10th decile (attractive metropolises) widened from 1:5 in 1998 to 1:8 in 2024 (Notaires de France/INSEE). National averages mask diametrically opposed realities. Any real estate analysis that does not start with local geography is incomplete.
Real estate in wealth allocation: the trap of over-concentration
The median household wealth in France is composed of 60–65% real estate (INSEE). For owner-occupiers, this share often exceeds 80%. In practice, the typical French homeowner holds a portfolio concentrated in a single asset (their home), in a single location, financed at 5–6x leverage, in an illiquid asset class whose sale takes 3–6 months, with transaction costs of 7–8% (transfer duties, agency fees, notary). This is the exact opposite of the diversification principles documented in the Foundations of Allocation sub-pillar — and yet this structure is socially encouraged and fiscally incentivised.
In the current regime of positive real rates, patrimonial trade-offs warrant re-evaluation. A household that has paid off its mortgage and holds a property with a net rental yield of 2–3% ties up capital in an illiquid asset yielding less than risk-free instruments (Livret A 3%, SCPI 4–5%, investment-grade bonds 4–5%). This is not a blanket argument to sell — non-financial dimensions (usage, rootedness, psychological security) legitimately matter. But it is an argument not to confuse real estate ownership with rational wealth management. Cross-asset analysis is developed in the Investment Strategies pillar.
Real estate is not a stable asset — it is a slow asset. Its volatility appears muted because illiquidity masks adjustments, but the widespread leverage of credit (LTV 80–85%, outstanding ~50% of GDP) makes it the principal amplifier of macro cycles. Every major financial crisis of the last fifty years had a real estate component — Japan 1990, subprimes 2008, China 2021, commercial real estate 2022. The 1998–2021 bull cycle was driven by three converging forces — long-term rate decline, longer loan terms, looser lending standards — all of which were reversed by the 2022–2023 tightening. Real estate does not follow rates — it amplifies the credit cycle that follows. When mortgage production collapses (France -50%, Banque de France), volumes fall first, prices follow with delay, and recovery can only come from the restart of credit — not from price stabilisation in an illiquid market. Macro analysis places real estate in its real regime of dependence on financial conditions — and helps distinguish phases where it consolidates wealth from those where it weakens it.