Why Home Prices Rise and Fall: The Credit Mechanism No One Explains
Residential property prices are not set first by supply and demand, but by the marginal buyer's borrowing capacity. Reading that mechanism — rates, loan terms, lending standards — is reading the housing market before prices move.

It is neither land scarcity nor population growth that primarily determines housing prices, but households’ borrowing capacity — a variable directly driven by interest rates, loan duration and bank lending standards.
TL;DR
A physically identical property can be worth €200,000 or €350,000 depending on the interest-rate regime, because borrowing capacity (set by rates, loan term and lending standards) drives the market price.
- Holding the monthly payment at €1,400, borrowing capacity drops from roughly €373,000 at a 1% rate to €246,000 at 5%, a loss of €127,000, or one third of the amount.
- Widening high-yield credit spreads have anticipated every significant U.S. housing correction since the late 1990s, because the bond market prices tightening credit before housing does.
- Real estate is the most leveraged household asset: a 10% price fall on a property financed at 90% pushes the borrower into negative equity, the chain that turned the 2007 U.S. housing correction into the 2008 global crisis.
A physically identical property can be worth €200,000 or €350,000 depending on the prevailing interest-rate regime. That measurable, mechanical reality is the starting point of any serious analysis of the housing market.
An apartment has not changed, yet its price has risen 70% in ten years. The usual explanations — too much demand, urban appeal, insufficient construction — contain a grain of truth, but they miss the dominant mechanism. What changed over that period was not the quality of the property nor demand intensity in volume terms: it was the amount of money buyers could borrow to acquire it.
The price of a residential property is, in the overwhelming majority of transactions, set by the borrowing capacity of the marginal buyer — the one who sets the market price. That capacity rests on three variables: the loan interest rate, the loan term and the household’s income. Of the three, the rate moves the fastest and the most. Reading the link between interest rates and housing purchasing power is reading why property prices rise and fall.
The calculation everyone overlooks: borrowing capacity and interest rates
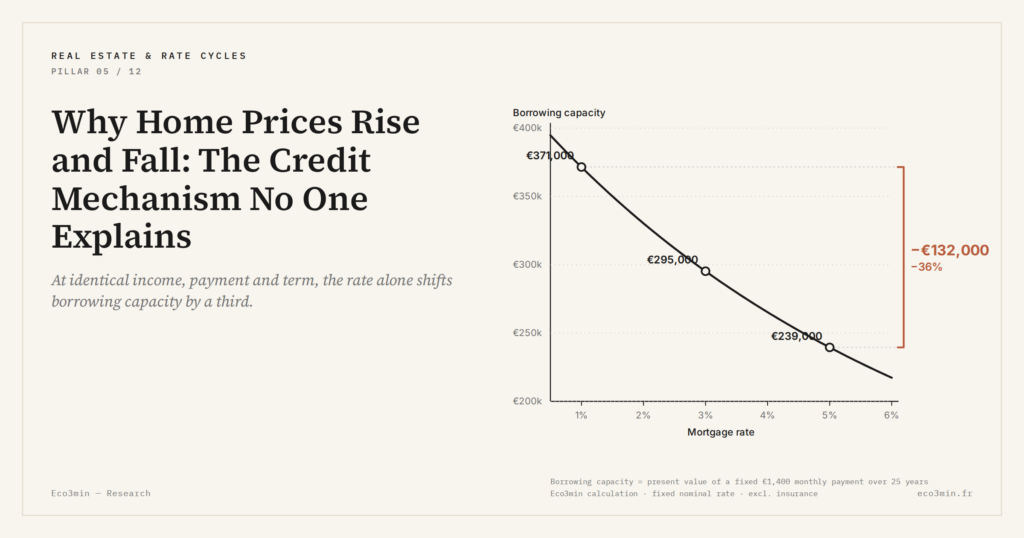
Take a household with net income of €4,000 per month and a debt-service ceiling of 35% — the cap enforced by the French macroprudential authority — meaning a maximum monthly payment of €1,400. The question: how much can this household borrow?
At a 1% rate over 25 years, borrowing capacity stands at roughly €373,000. At 3%, it falls to €296,000. At 5%, it drops to €246,000 — a loss of €127,000 in borrowing capacity, one third of the initial amount, for the same income, the same monthly payment and the same financial effort. This purely mechanical differential explains almost every major housing-price trend of the past twenty years. On the same theme: the arithmetic of mortgage affordability under higher rates.
The calculation is elementary, and perhaps that is why it gets so little airtime. When rates fall, borrowing capacity rises — and buyers can bid more for the same property. Facing buyers with more borrowed capital, the seller adjusts the price upward. The property’s intrinsic value has not moved; what changed is the volume of credit injected into the market. Our study on REIT refinancing risk extends this reading to securitized real estate. On the same question: how your credit score affects borrowing costs.
This logic explains why housing prices doubled in many European metropolitan areas between 2000 and 2022, a period when fixed mortgage rates fell from 5% to below 1%. It also explains why prices turned in 2023–2024 when rates spiked. The market’s physical fundamentals — housing stock, demographics, urbanisation — did not change in eighteen months: credit conditions tightened.
The housing credit cycle: slow, powerful, repeatable
Rate moves do not occur in isolation. They sit inside a broader cycle — the housing credit cycle — that typically runs 7 to 15 years and follows identifiable phases.
In an expansion phase, rates fall, lending standards loosen (longer terms, lower down-payments, broader income criteria), credit volume rises and prices climb. The price increase fuels a wealth effect — owners feel richer — and a collateral effect: as property values rise, refinancing or borrowing again becomes easier. The two effects reinforce the upward dynamic until the turn.
The turn arrives when one of the drivers exhausts itself: the central bank raises rates, regulators tighten lending standards, or household solvency hits its limit. Credit as the dominant engine of housing prices slows. Prices stop rising, then fall — usually with a 6- to 12-month lag relative to the credit reversal itself.
A deeper analysis of the credit cycle as the true market cycle shows the sequence is not specific to any one country or era. It repeats with striking regularity across the United States, the United Kingdom, Spain, France and most economies where mortgage credit is central to housing finance.
Monetary policy as the indirect driver of prices
If the mortgage rate is the direct determinant of prices, it is itself determined by monetary policy. The ECB policy rate transmits to the interbank market, then to government bond yields, then to mortgage rates — with a lag of a few weeks to a few months.
The causal chain makes the central bank, without explicitly intending it, the principal architect of housing cycles. When it cuts rates to stimulate the economy, it mechanically fuels housing-price growth by inflating borrowing capacity. When it raises them to fight inflation, it triggers a cooling — often sharper than expected, because the housing market reacts with inertia.
The transmission of monetary policy to economic actors does not stop at households. Developers, who finance projects through debt, are directly exposed. When rates rise, the carrying cost of housing inventory climbs, project margins compress and starts slow — which paradoxically reduces future supply and keeps medium-term upward pressure on prices.
What historical data show about the rate-housing link
The long history of U.S. real interest rates offers the most extended perspective on the relationship between rates and housing prices. In the United States, each phase of persistently low real rates (the 2000s, the 2010s) corresponded to a marked rise in residential prices. Each phase of high real rates (the early 1980s, 2022–2024) corresponded to a slowdown or decline.
According to data from the credit spread as a leading indicator, stress in credit markets systematically precedes housing reversals. Widening high-yield credit spreads — a sign of tightening financing conditions — anticipated every significant U.S. housing correction since the late 1990s. The signal works because the bond market prices in the deterioration of credit conditions before the housing market does.
In France, the correlation between mortgage rates and housing prices is just as sharp. Banque de France data and Notaires-INSEE indices show that the rate-decline phase between 2012 and 2021 coincided with a price increase of more than 30% in major metropolitan areas. The abrupt rate rise of 2022–2023 produced a drop in transaction volumes exceeding 20% — followed, with a lag, by a price adjustment.
Primary residence and rental investment: two logics, one credit mechanism
The distinction between primary residence and property investment is central to any wealth analysis. Both, however, obey the same credit mechanism.
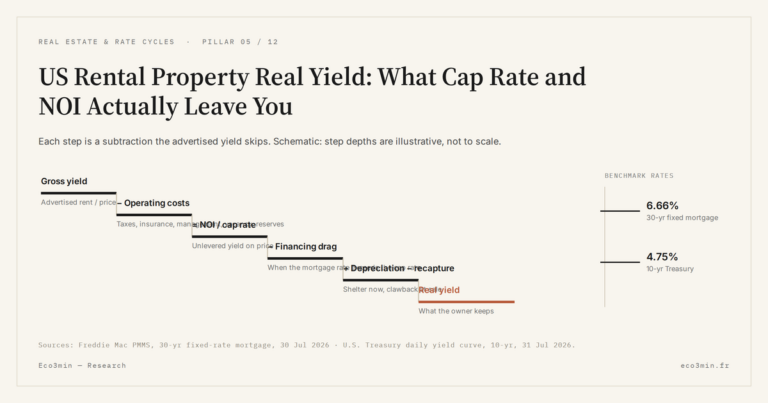
Buying a primary residence is a hybrid decision: it combines consumption (housing), a financial commitment (the loan) and a wealth exposure (the property’s value). A rental investment, by contrast, is a return calculation: rental yield must cover the cost of debt, expenses and taxes to generate a surplus.
In both cases, it is the interest rate that determines the profitability of the operation. A rental investment that “works” at a 1.5% mortgage rate can turn loss-making at 4% with no other parameter changing. Likewise, a primary-residence purchase that seemed affordable at 1% can move out of reach at 4% — not because the property changed in price, but because the financing cost reshaped the equation.
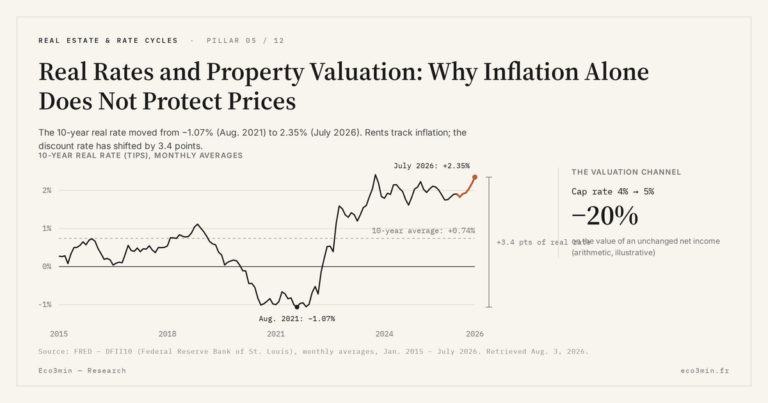
The question of property as inflation protection connects to the same analysis. A physical asset retains value in real terms, and real estate protects against inflation to that extent. But the protection is conditional on the real-rate regime: if the central bank raises rates above inflation to fight it, real rates rise, borrowing capacity falls, and housing prices can decline — even during inflationary periods.
Property leverage: an amplifier in both directions
Real estate is the most leveraged asset on household balance sheets. A 20% down payment implies 5x leverage: every 1% rise in the property’s price produces a 5% gain on invested equity. The mechanism is powerful on the way up — and symmetrically violent on the way down.
An breakdown of leverage risks in housing during monetary tightening shows that the most indebted households — often first-time buyers who purchased with minimal equity near the cycle peak — are the first exposed to a reversal. A 10% price decline on a property financed at 90% pushes the borrower into negative equity: they owe more to the bank than the asset is worth.
That leverage risk is also a macroeconomic risk. When a meaningful share of households end up in negative equity, they cut consumption (negative wealth effect), stop relocating (residential mobility freezes) and, in extreme cases, default on their loans (banking risk). It is precisely this mechanism that turned a U.S. housing correction in 2007 into a global financial crisis in 2008.
Where we are in the cycle: read credit, not prices
The most common error in housing analysis is to look at prices. Prices are a lagging indicator: they reflect past transactions, with a multi-month delay between the signing of a preliminary contract and the publication of the index.
The leading indicator of the housing market is credit: its volume, its rate, its lending standards, its average term. When mortgage credit volume falls — as it did in France in the second half of 2022 — prices follow, with a 6- to 12-month lag. When credit volume rebounds, prices stabilise and then rise again, on the same lag.
This credit-first reading is at the core of the analysis framework for property, cycles and interest rates. It connects to the broader logic of everyday financial trade-offs: an asset price is not an isolated fact, it is the outcome of an interaction between financing conditions, regulation and actor behaviour.
Housing is the only asset market where most buyers operate at 4x to 5x leverage on their equity contribution. That characteristic turns the housing market into a mechanical amplifier of rate cycles. When rates fall 2 points, prices do not rise 2%: they rise 15 to 25%, because borrowing capacity — not income — sets the price. Symmetrically, when rates rise 2 points, the price adjustment is materially larger than the rate move would suggest at first glance. A complementary angle: how the 30-year rate has turned at each cycle peak and trough.
For readers beginning to structure their understanding of investments, the anatomy of different investment vehicles places real estate in the broader context of wealth allocation — where credit is not merely a financing tool but a structural determinant of real returns.
Last updated — 20 September 2026
Disclaimer – Financial Information: The analyses, commentary, and content published on eco3min.fr are provided for informational and educational purposes only. They do not constitute investment advice or a solicitation to buy or sell financial instruments. Past performance is not indicative of future results. All investment decisions involve risk and are the sole responsibility of the reader.
Read next
Full pillar →US Rental Property Real Yield: What Cap Rate and NOI Actually Leave You
A rental listing leads with a yield. Divide the annual rent by the price and the number looks…
Cap Rate Spread: What Rental Yield Pays Over the 10-Year Treasury
A 5% cap rate sounds attractive. But 5% against what? A risk-free 10-year Treasury yields near 4.5% in…
Vacancy and Turnover: The Cost That Erodes a Landlord’s Real Return
A listing shows full rent, twelve months a year. The owner knows the gaps between tenants, the make-ready…