2s10s Yield Curve Inversion History (1976–2026)
The U.S. Treasury yield curve — specifically the spread between the 10-year and 2-year Treasury yields (the “2s10s”) — is one of the most closely watched recession indicators in macroeconomics. It reflects broader dynamics in monetary tightening, rate expectations, and credit transmission. For a comprehensive framework on rate regimes and monetary transmission, see our monetary policy and interest rate analysis framework. Every inversion of the 2s10s spread since 1976 has preceded a U.S. recession, with one notable exception: the 2022–2024 episode, the longest and second-deepest inversion on record, which has yet to be followed by a downturn. This page compiles every major 2s10s inversion documented in the Federal Reserve’s FRED T10Y2Y series, the observed lead times before each NBER-dated recession, and the key statistical takeaways for researchers, analysts, and investors.
Key Findings at a Glance
Period covered: June 1976 – February 2026 (FRED T10Y2Y series)
Major inversions: 7
Followed by recession (NBER): 6 out of 7 (the 7th, in 2022–2024, has not been followed by a recession as of this writing)
Mean lead time before recession: ~15 months (across 6 confirmed episodes)
Median lead time: ~14 months
Shortest lead time: ~6 months (2019–2020)
Longest lead time: ~24 months (2006–2008)
Deepest inversion: −240 bps (April 1980)
Longest inversion: 25 months (July 2022 – August 2024)
Potential false signals: 1 (2022–2024, under evaluation)
Research hub: Explore all Eco3min datasets, historical series, and macroeconomic research tools in one place: Eco3min Research & Data Hub .
Related dataset: Yield Curve Inversion History Dataset (2Y–10Y Spread)
Complete History of 2s10s Yield Curve Inversions (1976–2026)
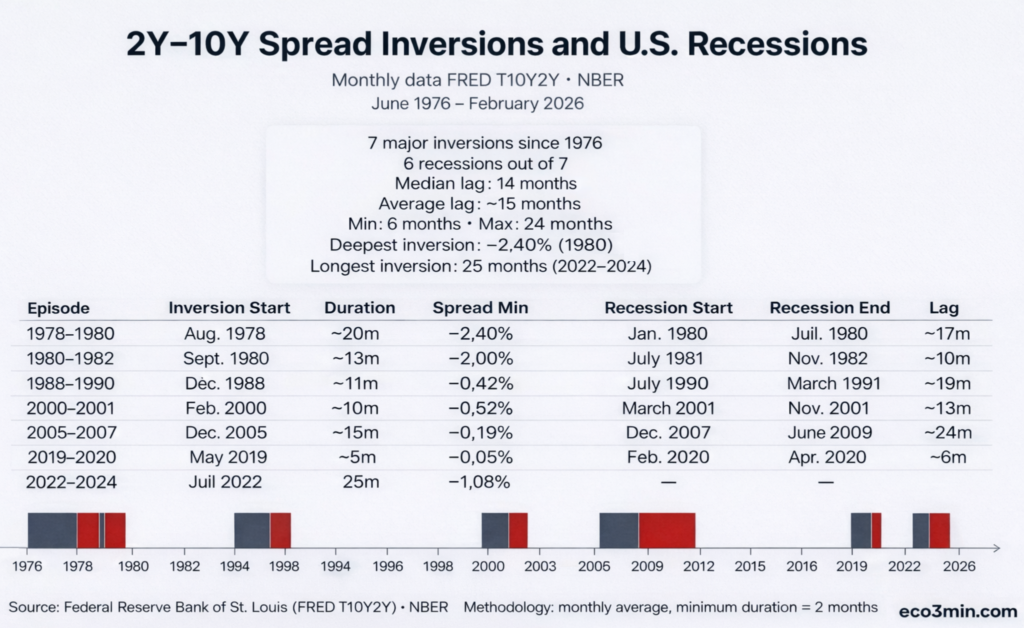
The table below lists every sustained inversion of the 10-Year minus 2-Year Treasury spread since the FRED T10Y2Y series began in June 1976. “Inversion start” refers to the first month in which the monthly average spread turned negative on a sustained basis (isolated intraday inversions are excluded). Recession dates follow the NBER Business Cycle Dating Committee.
| Episode | Inversion Start | Inversion End | Duration (months) | Trough Spread | Recession (NBER) | Lead Time ¹ |
|---|---|---|---|---|---|---|
| 1978–1980 | Aug 1978 | Apr 1980 | ~20 | −240 bps | Jan 1980 – Jul 1980 | ~17 months |
| 1980–1982 | Sep 1980 | Oct 1981 | ~13 | −200 bps | Jul 1981 – Nov 1982 | ~10 months |
| 1988–1990 | Dec 1988 | Oct 1989 | ~11 | −42 bps | Jul 1990 – Mar 1991 | ~19 months |
| 2000–2001 | Feb 2000 | Dec 2000 | ~10 | −52 bps | Mar 2001 – Nov 2001 | ~13 months |
| 2005–2007 | Dec 2005 | Mar 2007 | ~15 | −19 bps | Dec 2007 – Jun 2009 | ~24 months |
| 2019–2020 | May 2019 ² | Oct 2019 | ~5 | −5 bps | Feb 2020 – Apr 2020 | ~6 months ³ |
| 2022–2024 | Jul 2022 | Aug 2024 | ~25 | −108 bps | None to date | — |
¹ Lead time is calculated from the start of inversion to the start of the NBER-dated recession (business cycle peak).
² Based on monthly averages. Intraday inversions were observed as early as March 2019, but the first month with a negative average spread is May 2019, consistent with the New York Fed’s convention.
³ The 2020 recession was triggered by an exogenous shock (Covid-19 pandemic). The causal link to the preceding inversion remains debated in the academic literature.
Sources: Federal Reserve Bank of St. Louis (FRED series T10Y2Y), National Bureau of Economic Research (recession dates). Last updated: February 2026.
What the Data Show: Four Key Takeaways
1. The lag between inversion and recession is remarkably consistent
Across the six episodes that preceded a recession, the lead time between the onset of inversion and the NBER-dated business cycle peak ranges from 6 to 24 months, with a median of approximately 14 months. This consistency is striking given the diversity of macroeconomic backdrops — from the oil shocks of the 1970s to the dot-com bust, the subprime crisis, and the pandemic recession. It suggests that the inversion captures a structural mechanism — the compression of bank net interest margins and the resulting credit tightening — rather than a signal specific to any given cycle.
2. The un-inversion is often the more actionable signal
A counterintuitive but well-documented pattern: recessions tend to begin not during the inversion itself, but after the spread has returned to positive territory. This normalization — typically driven by a rapid decline in short-term rates as markets price in Fed easing — has preceded the onset of recession in the 1989, 2007, and 2019 episodes. The un-inversion can therefore be viewed as a more immediate leading indicator than the initial inversion. For researchers tracking recession risk in real time, the re-steepening of the curve deserves at least as much attention as the initial flattening.
3. Inversion depth does not predict recession severity
The deepest inversion on record (−240 bps in 1980) was followed by a relatively brief six-month recession. The shallowest confirmed inversion (−19 bps in 2006) preceded the worst financial crisis since the Great Depression. The 2022–2024 inversion — the second deepest at −108 bps — has not been followed by any recession at all. The magnitude of the negative spread is not a reliable predictor of the subsequent downturn’s depth or duration.
4. The 2022–2024 episode challenges the indicator’s infallibility
The July 2022 to August 2024 inversion lasted 25 months — the longest in the FRED T10Y2Y series — and reached a trough of −108 bps. Yet the U.S. economy posted real GDP growth of 2.9% in 2023 and above 3% on an annualized basis in Q2 and Q3 2024, according to the Bureau of Economic Analysis. Several structural factors may explain this anomaly: households and corporations had locked in low borrowing rates before the Fed’s tightening cycle, the post-Covid fiscal impulse remained unusually large, and AI-driven productivity gains may have extended the expansion. This episode supports the view that yield curve inversion is a necessary but not sufficient condition for recession — and that its predictive power may be diminishing as the structure of the economy evolves.
The Transmission Mechanism: Why Inversions Precede Recessions
The most widely accepted explanation for the inversion-recession link rests on the bank lending channel. Commercial banks borrow short (deposits, money markets) and lend long (mortgages, corporate credit). Their net interest margin — the spread between funding costs and lending yields — is their primary source of profit.
When the yield curve inverts, this margin compresses or turns negative. Banks respond by tightening credit standards and reducing loan supply — not as a strategic choice but as a profitability constraint. This credit contraction transmits gradually to the real economy: business investment slows, consumer credit tightens, and employment eventually deteriorates. The 12-to-18-month lag corresponds to the time required for this mechanism to propagate through bank balance sheets and spending chains.
The expectations hypothesis offers a complementary framework: inversion reflects bond market participants pricing in future rate cuts and economic slowdown. In this reading, the inversion does not cause the recession but rather announces it. Both channels likely operate simultaneously, with the banking channel providing the causal mechanism and the expectations channel providing the informational content.
The 3-Month/10-Year Spread: A Complementary Signal
The Federal Reserve Bank of New York uses the spread between the 10-year Treasury yield and the 3-month Treasury bill rate (FRED series T10Y3M) as the basis for its recession probability model. This measure behaves somewhat differently from the 2s10s.
The 3M–10Y spread responds more directly to Fed policy decisions, as the 3-month yield tracks the federal funds rate closely. It tends to invert later than the 2s10s but produces what some researchers consider a “cleaner” signal. During the 2022–2024 episode, the 3M–10Y spread remained inverted from October 2022 through December 2024 — roughly two months longer than the 2s10s — and reached a trough of −190 bps (March 2023), significantly deeper.
Research published by Fed economists Engstrom and Sharpe (2018, 2022) suggests that the “near-term forward spread” — which isolates monetary policy expectations over a six-quarter horizon — outperforms both traditional measures. Once this forward spread is included in forecasting models, the 2s10s becomes statistically redundant. However, the 2s10s remains the most widely cited measure in financial media and market commentary due to its simplicity and long track record.
Common Misinterpretations
Selling risk assets immediately upon inversion. The S&P 500 has historically continued to rally for months — sometimes years — after the onset of inversion. During the 2022–2024 episode, the index hit multiple all-time highs while the curve was deeply inverted. The inversion is a regime signal, not a market-timing tool.
Ignoring the un-inversion. As discussed above, the normalization of the curve is often a more immediate warning than the initial inversion. The return to positive territory indicates that short-term rates are falling — typically because the Fed is easing or the market expects it to — which often coincides with the early stages of economic deterioration.
Confusing correlation with causation. The inversion does not “cause” recessions. It reflects a constellation of conditions — restrictive monetary policy, growth slowdown expectations, compressed bank margins — that, taken together, tend to produce economic contractions. The 2022–2024 episode demonstrates that when key transmission channels are impaired (e.g., if credit does not contract sufficiently), the recession may not materialize.
Treating brief inversions as definitive signals. The New York Fed uses monthly averages, not daily data. An intraday or multi-day inversion does not constitute a signal under the academic models. Duration matters: the longer the inversion persists, the stronger its predictive value.
Pre-1976 Inversions
The FRED T10Y2Y series begins in June 1976. For earlier episodes (1950s–1970s), academic studies — notably by Campbell Harvey (1986) and Arturo Estrella and Frederic Mishkin (1996) — rely on reconstructed data or adjacent spreads (1Y–10Y, 3M–10Y). These studies document inversions preceding the recessions of 1957–1958, 1960–1961, 1969–1970, and 1973–1975, as well as a brief episode in 1966 that is generally regarded as the only false positive prior to the current episode.
For methodological rigor, the table above is limited to data directly verifiable on FRED. Pre-1976 episodes are documented in the academic references cited below.
Methodology and Sources
Spread used: 10-Year Treasury Constant Maturity Minus 2-Year Treasury Constant Maturity (FRED series T10Y2Y). Data available from June 1976.
Rate data source: Federal Reserve Bank of St. Louis (FRED), sourced from the U.S. Department of the Treasury.
Recession dates: National Bureau of Economic Research (NBER), Business Cycle Dating Committee. Dates correspond to business cycle peaks and troughs.
Inversion definition: The first month in which the monthly average T10Y2Y spread turns negative on a sustained basis (minimum two consecutive months). Isolated intraday inversions are excluded, consistent with the New York Fed’s convention.
Lead time calculation: Number of months between the onset of inversion (first month of sustained negative spread) and the start of recession (NBER business cycle peak).
Limitations: Data prior to June 1976 are not available in the FRED T10Y2Y series. Trough spreads reported in the table are approximations based on monthly averages and may differ slightly from intraday extremes.
Academic references:
- Harvey, C. (1986). Recovering Expectations of Consumption Growth from an Equilibrium Model of the Term Structure of Interest Rates. Doctoral dissertation, University of Chicago.
- Estrella, A. and Mishkin, F. (1996). “The Yield Curve as a Predictor of U.S. Recessions.” Federal Reserve Bank of New York, Current Issues in Economics and Finance, Vol. 2, No. 7.
- Engstrom, E. and Sharpe, S. (2018, 2022). “(Don’t Fear) The Yield Curve.” FEDS Notes, Board of Governors of the Federal Reserve System.
- Bauer, M. and Mertens, T. (2018). “Information in the Yield Curve about Future Recessions.” FRBSF Economic Letter, No. 2018-20.
Frequently Asked Questions
What is a yield curve inversion?
A yield curve inversion occurs when short-term government bond yields exceed long-term yields. In the case of the 2s10s spread, it means the 2-year U.S. Treasury yield is higher than the 10-year yield. This is considered abnormal because investors typically demand higher compensation for lending over longer periods to account for inflation risk and uncertainty. When the curve inverts, it signals that markets expect economic conditions to worsen, driving future interest rates lower.
Does the yield curve always predict a recession?
Over the period covered by FRED data (since 1976), six of the seven major 2s10s inversions have been followed by an NBER-dated recession. The 2022–2024 episode — the longest and second-deepest inversion in the series — is potentially the first false signal. Academic literature also identifies a 1966 episode (based on reconstructed data) that was not followed by a recession. The historical hit rate remains high but is not 100%.
How long after the inversion does the recession start?
Across the six confirmed episodes, the lead time ranges from 6 months (2019–2020) to 24 months (2005–2008), with a median of approximately 14 months. This variability makes the inversion unsuitable as a precise market-timing tool, but consistent enough to function as a leading indicator of macroeconomic regime change.
Why didn’t a recession follow the 2022 inversion?
Several hypotheses have been advanced: households and businesses had locked in low borrowing rates before the Fed’s tightening cycle, limiting the transmission of higher rates to the real economy; the post-Covid fiscal stimulus supported aggregate demand well beyond its initial impact; and AI-driven productivity gains may have extended the expansion. The U.S. economy appears less interest-rate-sensitive than in prior cycles, which has weakened the traditional bank lending channel through which inversions transmit to the real economy.
What is the un-inversion and why does it matter?
The un-inversion refers to the yield spread returning to positive territory after a period of inversion. Historically, recessions have tended to begin after the un-inversion — not during the inversion itself. The un-inversion typically reflects short-term rates falling faster than long-term rates, as the Fed begins easing or the market prices in rate cuts. Many analysts consider the un-inversion a more immediate recession warning than the initial inversion.
Is the 2s10s spread still a reliable recession predictor?
The 2022–2024 episode has prompted a reassessment. As Campbell Harvey — the economist who first documented the yield curve’s predictive power in his 1986 dissertation — has noted, the more widely known and anticipated an indicator becomes, the more likely market participants are to alter their behavior in ways that diminish its effectiveness. The 2s10s remains a valuable signal of macroeconomic stress, but it is increasingly viewed as one input among several rather than a standalone predictor. Fed researchers have suggested that the near-term forward spread may offer superior forecasting power.
Download the Complete Dataset
Source: eco3min.fr — FRED / NBER data. Free to use with attribution.
Conclusion
The 2s10s yield curve inversion remains one of the most robust leading indicators of U.S. recession risk. Over nearly five decades of data, six of seven major inversions have been followed by NBER-dated recessions, with a median lead time of approximately 14 months.
The 2022–2024 episode — the longest inversion in the history of the FRED series — serves as an important methodological caveat. No single indicator is infallible, and structural features of the economy (interest rate sensitivity, household and corporate balance sheets, fiscal policy stance) modulate the transmission of the signal. As Campbell Harvey has observed: the more an indicator is publicized and anticipated by markets, the more its effectiveness tends to erode over time.
The inversion should not be interpreted as a sell signal or a dated prediction. It indicates a macroeconomic environment in which recession risk is structurally elevated above baseline. The un-inversion — the return of the spread to positive territory — is often the more operationally relevant signal for real-time recession monitoring.
The data and analysis presented on this page are provided for informational and educational purposes only. They do not constitute investment advice or a recommendation to take any specific action.
Practical application: To assess how inflation affects long-term returns across different rate environments, see our real return calculator adjusted for inflation .
Related Eco3min analysis
External references
Disclaimer – Financial Information: The analyses, commentary, and content published on eco3min.fr are provided for informational and educational purposes only. They do not constitute investment advice or a solicitation to buy or sell financial instruments. Past performance is not indicative of future results. All investment decisions involve risk and are the sole responsibility of the reader.