Monetary Policy Transmission: Channels, Time Lags and Real-Economy Impact
Monetary policy does not strike the economy — it soaks through it. Transmission operates by accumulation across credit, balance sheets, expectations and the exchange rate, with peak impact 12–24 months after the policy inflection.

Monetary policy never acts immediately or uniformly. Central bank decisions first reshape financial variables — cost of credit, liquidity conditions, expectations — which only with delay and unevenly transmit to the real economy.
Monetary policy does not strike the economy — it soaks through it.
Monetary transmission is the process by which central bank decisions gradually diffuse into the real economy through financial conditions, credit, balance sheets and expectations.
TL;DR
Monetary policy diffuses through credit, balance sheets, expectations and the exchange rate with peak impact 12 to 24 months out, so the 2022-2023 tightening was still transmitting into 2025-2026.
- The shock was unusually fast: the ECB moved from 0% to 4% in fourteen months and the Fed from 0–0.25% to 5.25–5.50% between March 2022 and July 2023, the sharpest tightening since the early 1980s.
- Pass-through is uneven: an ECB working paper (Altavilla et al., 2022) finds it varies two- to threefold across the euro area, near complete in Spain and Portugal but roughly halfway in France and Germany, while variable-rate shares in new mortgage flows run from 15% (France) to 85% (Finland) (ECB, December 2025).
- Balance-sheet amplification scales with leverage: French non-financial corporate debt reached 160% of GDP in Q3 2025 (Banque de France), and new euro-area corporate credit flows fell about 15% between the 2022 peak and end-2025 (ECB, December 2025).
- Across the last six US tightening cycles, financial conditions (St. Louis Fed, NFCI) kept tightening 8 to 14 months after the final hike; the IMF (WEO, October 2025) places the macro peak of the 2022-2023 shock between H2 2025 and H1 2026.
This mechanism operates with a lag and unevenly across agents and national financial structures — which makes cyclical diagnosis far more complex than a straight reading of rate announcements suggests.
When a central bank raises its policy rate, the public debate often assumes a near-mechanical chain: borrowing becomes more expensive, demand slows, inflation falls. For a concrete view of how rate changes affect households and investor portfolios in practice, see the impact of interest rates on personal wealth. The sequence is technically correct — and profoundly misleading on timing. Between the policy decision and its tangible effect on employment, output or consumption lie transmission lags measured in quarters, not weeks. The paradox is structural: monetary policy is the most powerful macro tool available to advanced economies, yet its action is the slowest, the most indirect and the most unevenly distributed.
This delay is not a defect in the system — it is the system. Monetary policy does not directly steer activity: it shifts the conditions under which economic agents decide. Why the resulting delay is structural rather than accidental is examined in why monetary policy always seems to lag. Its action transits through credit, balance sheets, expectations and the exchange rate, each channel running at its own speed and intensity depending on the financial architecture of each economy. Confusing the announcement of a rate hike with its real-economy effect leads to two symmetric errors: declaring victory prematurely when inflation moderates, or calling failure when activity holds in the months following the tightening.
For a theoretical approach to monetary policy as a system of incentives and constraints, see our deep-dive: Monetary policy: incentive framework and structural limits. This article concentrates on the concrete mechanics of transmission — through which channels, at what speed, and with what amplitude monetary decisions ultimately reach the productive economy.
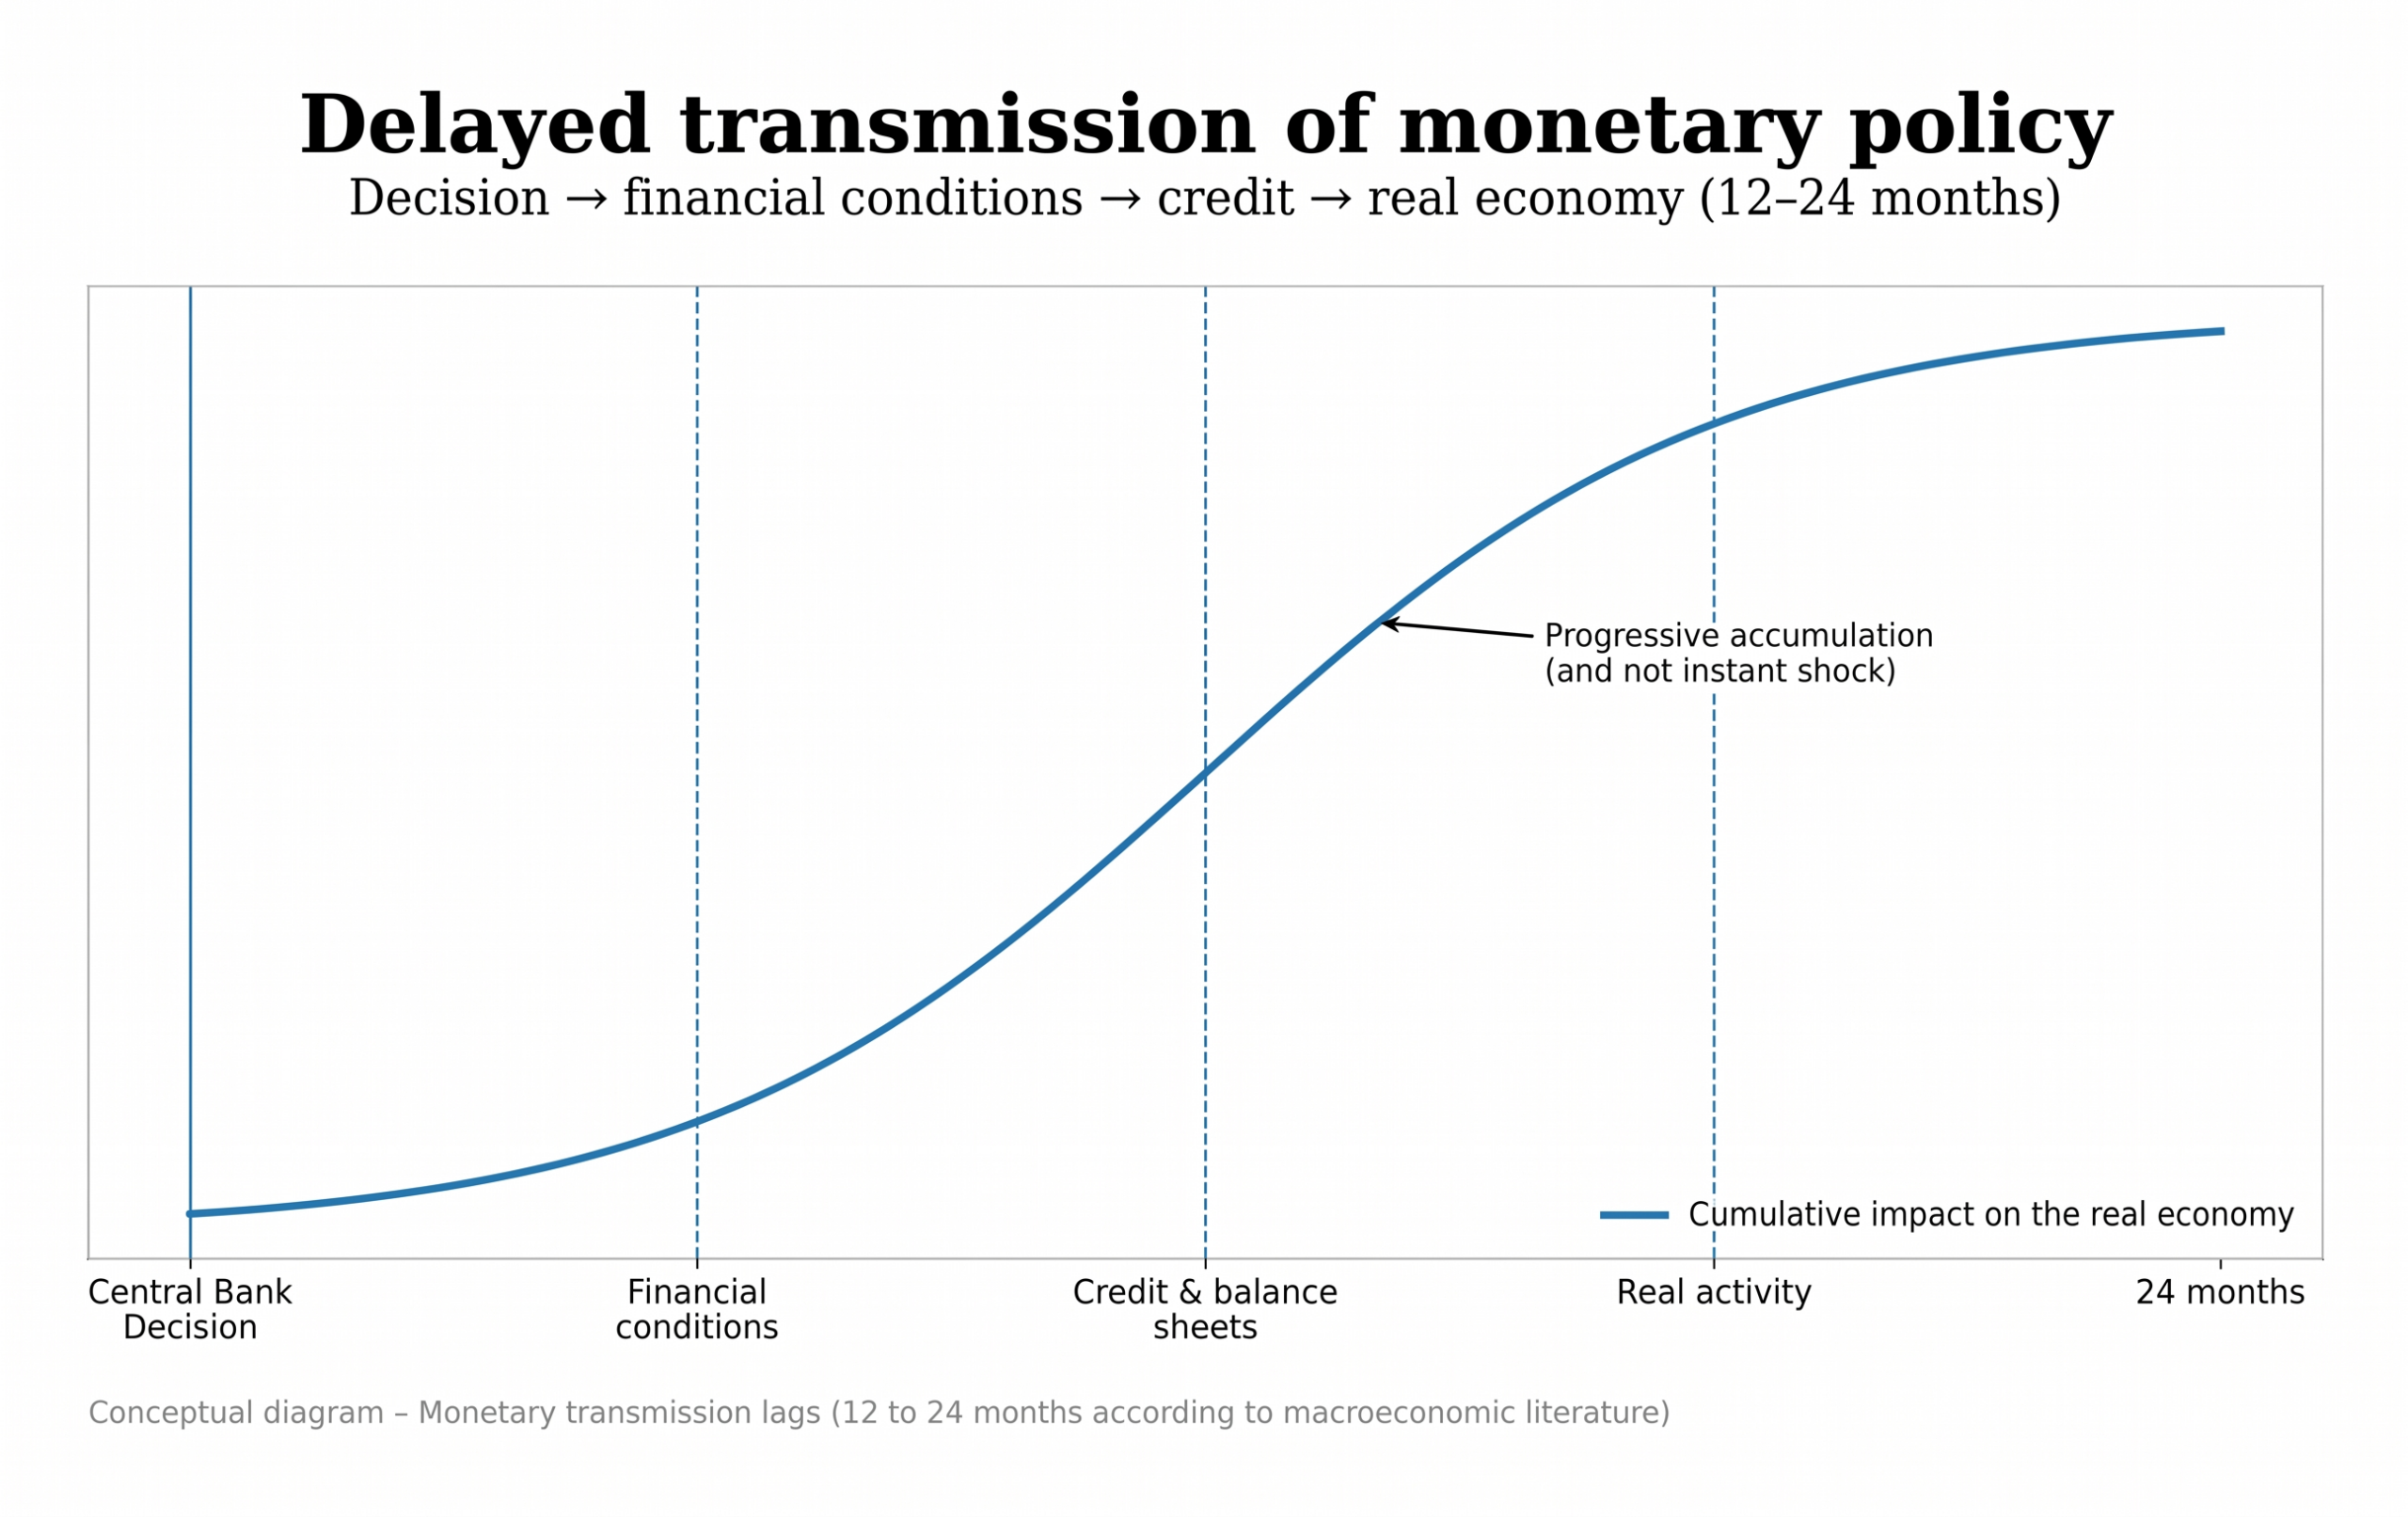
Monetary policy does not strike the economy — it soaks through it. Monetary transmission operates by accumulation across four principal channels (credit, balance sheets, expectations, exchange rate), with peak impact located 12 to 24 months after the policy-rate inflection. This timing implies that the 2022–2023 tightening had not yet fully transmitted to the real economy by 2025–2026 — contrary to some dominant readings. The accumulation mechanism is well documented in the literature (BIS, ECB, Fed); the precise calibration for the current cycle — marked by heterogeneous debt structures and unprecedented geographic fragmentation — remains debated.
The central mechanism: four channels, one accumulation process
Transmission to the real economy follows a causal chain in which each link operates with its own delay and intensity.
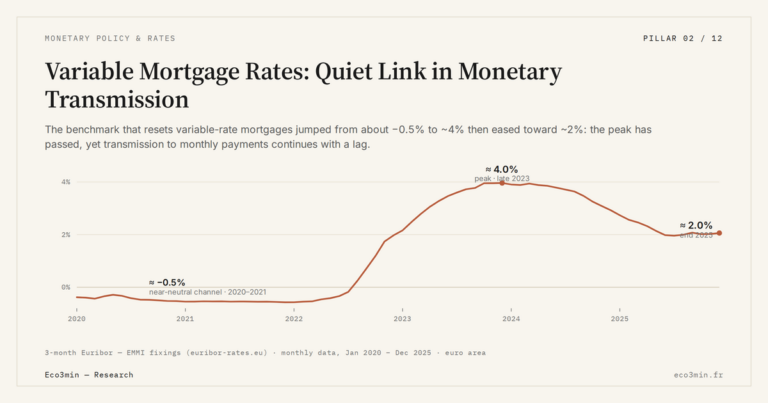
Trigger: the change in policy rates. The starting point is a central bank decision — hike, cut or hold — which alters the cost at which commercial banks refinance with the central bank. The institutional side of those decisions — who sets them, and under what pressure — is the subject of the analysis of central-bank independence, myth or reality. But that reference rate is not what firms or households actually pay: it is a signal that propagates through the financial system in successive steps. The 2022–2023 episode offers the cleanest recent illustration: the ECB moved its policy rate from 0% to 4% in fourteen months, while the Fed lifted its rates from 0–0.25% to 5.25–5.50% between March 2022 and July 2023 — the fastest tightening sequences since the early 1980s.
Primary channel: credit and financing conditions. The policy rate first reaches interbank rates, then corporate and household lending rates, with lags ranging from a few weeks (money markets) to several quarters (fixed-rate mortgages). The ECB Bank Lending Survey (Q4 2025) reports a persistent tightening of lending standards for both firms and households. That tightening of standards is the gatekeeper stage of transmission, as set out in the central role of credit access. New corporate credit flows in the euro area dropped by about 15% between their 2022 peak and end-2025 (ECB data, December 2025). The credit channel is the most direct and best-documented vector — a foundational Fed working paper (Bernanke & Gertler, 1995) formalized how credit conditions amplify monetary impulses well beyond their direct effect on rates.
Amplifier: the balance-sheet channel and leverage effects. Rate hikes do more than raise borrowing costs: they depress the market value of the financial and real assets carried on agents’ balance sheets. The historical record is pieced together in our framework on cross-asset correlation regimes. The depreciation shrinks collateral values, which caps borrowing capacity, which slows investment and consumption, which depresses asset values further — the feedback loop described by the BIS (Borio & Lowe, 2002) as the “financial accelerator”. The magnitude of this effect scales with initial leverage: the more leveraged the economy, the stronger the balance-sheet amplification. According to Banque de France data (Q3 2025), non-financial corporate debt in France reached 160% of GDP — among the highest levels in the euro area — which mechanically increases France’s sensitivity to the balance-sheet channel.
Macro consequence: slowdown by accumulation. The four channels combine into a slowdown that rarely shows as a one-off shock. It builds as cumulative pressure. Quarter after quarter, the stock of credit refinances at tighter terms, balance sheets erode marginally, corporate margins compress, investment projects are postponed. The economy does not flip — it erodes. This dynamic explains why cyclical indicators can remain positive for several quarters after a major tightening, before a tipping point is reached. The IMF (World Economic Outlook, October 2025) estimates that the peak impact of the 2022–2023 tightening on advanced-economy growth would materialize between H2 2025 and H1 2026 — roughly three years after the start of the tightening cycle. Eco3min traces this pattern further in why economic decisions produce lagged, counter-intuitive effects.
What the consensus underestimates: transmission is not finished
The dominant market reading, echoed by many leading indicators, holds that most effects of the 2022–2023 tightening have already been absorbed. The interpretation rests on real signals: stabilization of core inflation, labor market resilience across most advanced economies, and steady consumption indicators. The diagnosis is not without merit.
Its limitation lies in an implicit assumption of rapid and largely complete transmission. That assumption collides with a well-documented mechanism: in economies where a substantial share of debt is rate-resettable or maturing for refixing, transmission keeps moving even without new policy hikes. Decisions taken in 2022–2023 continue to push up financial burdens as loans roll over at current conditions. An ECB working paper (Altavilla, Burlon, Giannetti & Holton, 2022) shows that the pass-through speed from policy rates to effective lending rates varies by a factor of two to three across euro-area countries — meaning transmission is complete in some economies (Spain, Portugal) and only halfway through in others (France, Germany).
The consensus is therefore right to note short-term activity resilience, but that resilience is precisely consistent with an incomplete transmission process: the heaviest effects tend to appear in the second and third year after tightening, not in the first. Concluding that transmission is over because the economy has not visibly slowed conflates delay with absence of effect.
Assessing monetary policy effectiveness over a few months. Monetary transmission peaks 12 to 24 months out — sometimes longer in economies where debt is largely fixed-rate. A tightening that “shows no visible effect” after six months has not failed: it has not yet had time to act. Bank Lending Survey results and credit flow data are far more reliable early indicators than quarterly GDP for tracking transmission status.
| Reading “transmission complete” | Accumulation reading | |
|---|---|---|
| Implicit assumption | Rapid, homogeneous pass-through | Gradual, fragmented pass-through |
| Observed signal | Employment and consumption resilience | Progressive credit contraction and balance-sheet erosion |
| Analysis horizon | 6–12 months post-tightening | 12–36 months, with cumulative effects |
| Main risk | Underestimating residual inflation | Underestimating the forthcoming slowdown |
| Preferred indicators | GDP, employment, headline inflation | Credit flows, spreads, Bank Lending Survey, balance sheets |
Asymmetries, fragmentation and non-linearities: why transmission is never uniform
The schematic Trigger → Transmission → Amplifier → Consequence describes the general mechanics, but the reality of monetary transmission is crossed by complexities that reshape its effective trajectory.
Fixed-rate vs variable-rate asymmetry. Debt structure determines transmission speed far more than the policy rate level. In economies where mortgages are predominantly variable-rate (Spain, UK, several Nordic countries), tightening reaches household payments within months. In economies dominated by fixed-rate debt (France, US, Germany), transmission works through new credit flows and rollovers — a process spread over years. ECB data (Dec 2025) show the share of variable-rate mortgages in new flows ranging from 15% (France) to 85% (Finland) — a gap that renders any uniform impact reading for the euro area essentially meaningless. A detailed analysis of monetary transmission lags and delayed effects clarifies these structural differences. A companion piece: The Eco3min study of the lag between rate moves and company profits.
Geographic fragmentation of transmission. The euro area is the textbook case of fragmented transmission: a single monetary policy facing economies with sharply divergent financial structures, debt levels and housing markets. The spread in effective lending rates to firms ranged from 80 to 150 bps between core and periphery countries at end-2025 (ECB data) — a differential that mirrors variable transmission intensity within a single monetary union. This fragmentation interacts with the desynchronization of regional economic cycles, producing situations where the same policy is simultaneously too restrictive for some economies and too lenient for others.
Non-linearities and threshold effects. Monetary transmission is not proportional. Below a certain financial pressure level, households and firms absorb higher borrowing costs through margins or precautionary savings. Above a threshold — sensitive to initial leverage, loan maturity profiles and income levels — behavior flips non-linearly: firms cancel projects rather than scale them back; households postpone home purchases rather than search for cheaper alternatives. The ECB credit survey (Q4 2025) shows the share of firms postponing investment reaching levels comparable to end-2019 — a threshold historically preceding marked contractions in gross fixed capital formation. Monetary policy thus operates as cumulative pressure whose delayed effects crystallize abruptly when a financial tolerance threshold is crossed. See restrictive monetary policy: mechanisms and delayed effects.
The role of expectations as accelerator or brake. Monetary expectations cut both ways. If agents anticipate future easing, financial conditions loosen ahead of the actual cuts (long rates fall, spreads compress), which attenuates current transmission. Conversely, if “higher for longer” expectations take hold, the restrictive effect amplifies beyond what the policy rate alone implies. The role of monetary expectations in transmission explains why financial conditions can diverge significantly from the policy-rate signal — a phenomenon the current cycle illustrates vividly.
Measuring transmission: beyond the policy rate
The policy rate is the trigger, but a poor proxy for the tightening actually borne by the economy. Distinguishing nominal versus real rates already shifts the picture: a 4% policy rate with 5% inflation is accommodative in real terms, while the same nominal rate with 2% inflation is clearly restrictive. Even the real rate, however, captures only a fraction of reality.
The most informative indicators for tracking where transmission actually stands sit downstream of the policy rate: flows of new credit and volume of renegotiations (which measure how fast the debt stock re-prices at new conditions); the ratio of loan payments to household disposable income (which captures actual financial pressure); corporate funding spreads (which reflect credit risk pricing); early default indicators — payment delays, impaired loans — which signal when financial pressure starts converting into real losses. Even armed with these series, the exercise keeps its blind spots — why the impact of monetary policy is hard to measure details them.
The St. Louis Fed financial conditions series (National Financial Conditions Index) offers a long perspective: across the last six US tightening cycles, financial conditions continued tightening on average 8 to 14 months after the final rate hike — a lag confirming that the end of a hiking cycle is not the end of transmission, only the start of its most intense phase.
Implications for reading the current monetary cycle
If the cumulative transmission framework holds, it reshapes the reading of several ongoing dynamics.
For monetary policy interpretation. The 2022–2023 tightening, by its speed and amplitude, qualifies as a historic monetary shock whose transmission remains structurally incomplete. The decisions taken two to three years ago continue to diffuse through the economy as the stock of debt renews under new terms. The ECB, in its December 2025 bulletin, observed that a gap persists between policy rates and effective financing conditions — a signature of incomplete transmission. The real-rate framework confirms that the degree of effective restriction depends more on financing conditions than on the headline policy rate alone.
For credit and balance-sheet analysis. Progressive credit volume contraction, slowing residential investment and mounting pressure on household budgets read as early signals of an ongoing transmission. Housing offers the clearest illustration of this — see how monetary policy transmits to real estate. The balance-sheet channel in particular warrants close monitoring: declining real-estate asset values across several European economies compress collateral and restrict SME financing — a mechanism unfolding with a 12–18 month lag relative to property price declines. The monetary cycle interacts with the timing of the economic cycle, and the same policy produces radically different effects depending on the cycle phase in which it is applied.
For equities and valuation. Equity markets respond to shifts in financial conditions and rate expectations well before monetary transmission affects the real economy — a phasing that produces sometimes durable divergences between market valuation and macro trajectory. This mechanism, analyzed in our banks, central banks and equity markets framework, implies that markets can price easing while the restrictive effects of the prior tightening still diffuse through the real economy.
Invalidation condition. This cumulative transmission framework loses traction if a rapid, massive easing (200 bps or more within 12 months) interrupts transmission before its peak, or if large targeted fiscal support neutralizes financial pressure on the most exposed agents. What such easing has historically preceded is reviewed in accommodative monetary policy as the pre-crisis lever. A positive productivity shock (AI-driven acceleration) could similarly offset monetary pressure by supporting corporate margins and incomes. Conversely, an exogenous energy price shock or a sovereign-debt confidence crisis would amplify and accelerate transmission.
Three time horizons to track transmission
Short horizon (0–6 months): the 2022–2023 tightening keeps diffusing via credit rollovers and balance-sheet erosion. Priority indicators: new credit flows, the ECB Bank Lending Survey, and corporate payment delays. Euro-area PMIs (~48–49 at end-2025) and contracting corporate credit signal active transmission. Short-term risk is a non-linear tipping if financial pressure crosses thresholds in the most leveraged economies. Every channel, lag and blind spot mentioned on this page is unpacked separately below.
In this series
The transmission channels
Uneven transmission
These entries can be read in any order, depending on the channel of interest.
Cycle horizon (1–3 years): the macro peak of the tightening should materialize on this horizon according to IMF and BIS estimates. The central question is the speed at which central banks start easing and whether that easing suffices to break the cumulative dynamic. Transmission fragmentation within the euro area will create growing divergences between member economies. Its interplay with the structural cycle dynamics will determine whether the slowdown remains orderly or becomes more pronounced.
Structural horizon (5+ years): the current cycle tests central banks’ ability to engineer disinflation without doing lasting damage to productive capacity. If tightening induces prolonged underinvestment — readable in potential growth data — its effects will outlast the cyclical episode and reshape long-term trajectories. Monetary policy, designed as a cyclical tool, could therefore carry structural consequences — which raises the broader question of central banks’ limits. This logic feeds the wider reflection on monetary policy and its interaction with economic cycles.
Monetary transmission works by accumulation, not by shock. The 2022–2023 rate decisions keep diffusing into the real economy through credit, balance sheets and expectations, independently of any pause or reversal in policy rates. The absence of a sharp slowdown does not mean monetary policy is ineffective — it means its structurally slow and uneven transmission process has not yet reached peak impact. Evaluating policy over too short a horizon systematically underestimates its effects.
Robust: The accumulation transmission mechanism (credit → balance sheets → real activity) is documented across decades of academic and institutional literature (Bernanke & Gertler, 1995; Borio & Lowe, 2002; BIS annual reports). The 12–24 month transmission lag is a convergent estimate across ECB, Fed and IMF work. Transmission fragmentation within the euro area is directly observable in effective lending rate data.
Uncertain: The exact calibration of peak impact in the current cycle is debated — estimates range from 18 to 36 months depending on models and national debt structures. The net effect of easing expectations (which loosen conditions ahead of actual cuts) on transmission intensity is hard to quantify. The possibility of a non-linear shock (abrupt tipping after long resilience) is plausible but its timing remains unpredictable.
Regular monitoring through the weekly macro bulletin allows the framework to be confronted with the latest credit, balance-sheet and financial-condition data. Multiple trajectories remain possible, but reading monetary transmission through accumulation mechanisms — rather than as an immediate reaction to announcements — provides a more robust framework for absorbing cyclical surprises.
- Monetary policy does not strike the economy — it soaks through it. Transmission operates by accumulation across credit, balance sheets, expectations and exchange rate, with peak impact 12–24 months after the policy inflection.
- The 2022–2023 tightening has not yet produced its full effects: short-term resilience is compatible with an incomplete transmission process, not with its absence.
- Transmission fragmentation — between fixed and variable rates, and between core and peripheral countries — rules out a uniform impact reading for the euro area.
- Credit flows, balance-sheet metrics and financial-condition indicators are more informative than quarterly GDP for assessing the true state of monetary transmission.
- This framework is invalidated if rapid monetary easing or large fiscal support interrupts transmission before peak impact.
Last updated — 12 July 2026
Disclaimer – Financial Information: The analyses, commentary, and content published on eco3min.fr are provided for informational and educational purposes only. They do not constitute investment advice or a solicitation to buy or sell financial instruments. Past performance is not indicative of future results. All investment decisions involve risk and are the sole responsibility of the reader.
Read next
Full pillar →Real Rates: The True Cost of Capital Is Repricing
Why real rates are reasserting themselves as markets' anchor and how to recalibrate investment and financing decisions facing…
Real Interest Rates: The Quiet Signal Reshaping Markets
Real interest rates: why their persistence in positive territory in 2026 is reshaping the rules for bonds, equities,…
OAT-Bund Spread: A Quiet Gauge of French Sovereign Risk
OAT-Bund spread: how this yield gap has become a key signal on French sovereign risk, fiscal policy and…