Duration Risk Revealed: The 30-Year Treasury Zero-Coupon Price Declined 70% Between 2020 and 2023 — Exceeding Most Equity Bear Markets

A daily dataset tracking the US 30-Year Treasury yield since 1977 — with a synthetic zero-coupon price index that transforms an invisible bond bear market into a drawdown directly comparable to equity crashes.
The US 30-Year Treasury constant maturity rate (FRED series DGS30) is the longest-duration benchmark in the US sovereign yield curve. Over 12,277 daily observations from February 1977 to April 2026, the 30-year yield has ranged from a record low of 0.99% in March 2020 to a peak of 15.21% in October 1981. This page provides the complete daily dataset alongside a synthetic zero-coupon price sensitivity index — a derived variable that converts yield movements into a price series directly comparable to equity indices. The result makes visible what yield charts alone conceal: the scale of duration risk embedded in long-term government bonds.
Between March 2020 and October 2023, the 30-year Treasury zero-coupon price index declined 69.9% — a drawdown that exceeded the S&P 500’s losses during the dot-com crash (−49.1%), the 2008 financial crisis (−56.8%), and the 2022 correction (−25.4%). Even the iShares 20+ Year Treasury Bond ETF (TLT), which includes coupon payments, declined approximately 48% from its 2020 peak. This dataset measures maximum duration sensitivity — the price movement of a theoretical zero-coupon instrument. Actual bond portfolio losses were significantly smaller due to coupon payments, shorter average durations, and reinvestment effects (see Analytical Context and Limitations).
30Y Yield
ZC Price Index
ZC Drawdown
Mod. Duration
- The 30-year Treasury zero-coupon price index declined 69.9% between March 9, 2020 (yield: 0.99%) and October 19, 2023 (yield: 5.11%) — a peak-to-trough drawdown that exceeded the S&P 500’s losses during the 2008 financial crisis (−56.8%), according to FRED data (series DGS30, retrieved April 2026).
- Even including coupon payments, the iShares 20+ Year Treasury Bond ETF (TLT) declined approximately 48% from its 2020 all-time high, as reported by Bloomberg in September 2023 — still exceeding the dot-com equity crash.
- At current yield levels (4.88%), a 100-basis-point increase in the 30-year yield produces an approximate 25% decline in zero-coupon price — duration acts as embedded leverage in long-term bonds.
- The 30-year yield has spent 25.6% of its history in the “Extreme” regime (above 8%), entirely concentrated between 1977 and 1990. The series’ median yield since 1977 is 5.46%, placing the current reading near the 41st percentile.
- The severity of the 2020–2023 drawdown is inseparable from its starting point: the yield of 0.99% on March 9, 2020 was the lowest in the series’ 49-year history. The same convexity that amplified gains during the 38-year bond bull market (ZC price: +5,104% from 1981 to 2020) amplified losses when rates normalized.
- As of April 2026, the zero-coupon price index remains 67.8% below its March 2020 peak — the bond market has not recovered, and at current yields, full recovery would require the 30-year yield to return below 1%.
12,277 daily observations · Feb 1977 – Apr 2026 · CC BY 4.0 · Updated weekly ·
Methodology ·
Cite this dataset
Observations
Max Yield (Oct 1981)
Min Yield (Mar 2020)
Median Yield
Max ZC Drawdown (Post-2006)
Current Percentile
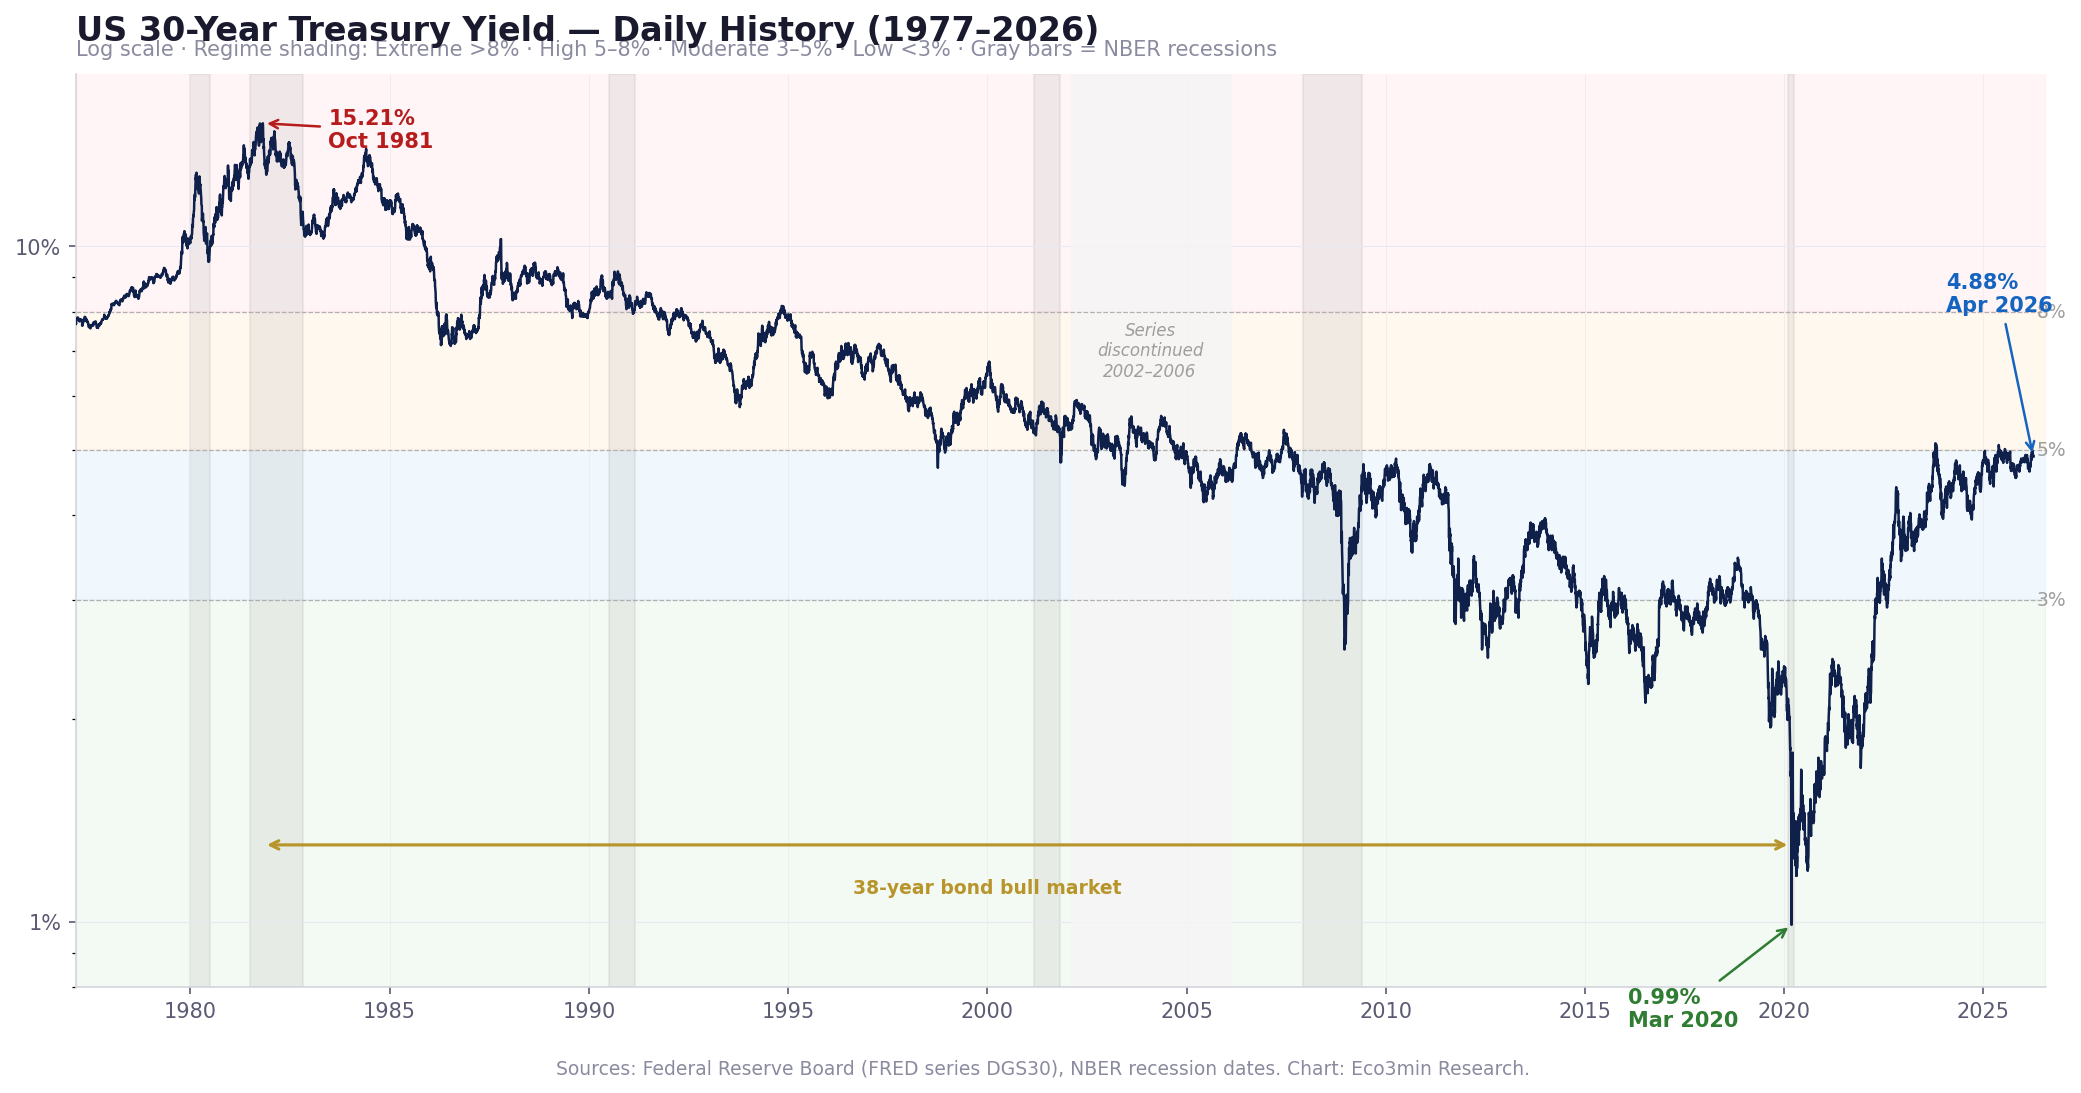
Chart: US 30-Year Treasury Yield — Daily History (1977–2026)
The Full Arc: From 7.70% to 15.21% to 0.99% and Back
30-Year Treasury Constant Maturity Rate with yield regime shading and NBER recession bars. Series discontinued Feb 2002 – Feb 2006 (gap shown).
The 30-year yield’s 49-year history is dominated by a single structural arc: the rise from 7.70% to 15.21% (1977–1981), followed by a 38-year secular decline to 0.99% (2020), and a sharp reversal to 5.11% by late 2023. The yield has spent only 13.8% of its history below 3% — a regime that existed almost entirely between 2019 and 2022.
Sources: Federal Reserve Board (FRED series DGS30), NBER recession dates. Chart: Eco3min Research.
How to Read This Chart
The chart plots the daily 30-Year Treasury Constant Maturity Rate as reported by the Federal Reserve Board (H.15 Statistical Release). Background shading indicates four yield regimes: Extreme (above 8%, red), High (5–8%, orange), Moderate (3–5%, light blue), and Low (below 3%, green). Gray vertical bars mark NBER-dated recessions. The gap between February 2002 and February 2006 reflects the Treasury Department’s decision to discontinue 30-year bond issuance — the series was reintroduced in February 2006.
The yield alone does not reveal the price impact of these movements. A move from 1% to 5% and a move from 5% to 9% are both 400 basis points — but the first produces a 69% price decline on a zero-coupon instrument, while the second produces a 46% decline. This asymmetry — the convexity of bond pricing — is why the drawdown comparison chart below tells a fundamentally different story than the yield chart. For how the 30-year yield interacts with shorter maturities, see our 10-Year Treasury dataset and the yield curve spread analysis.
The Hidden Bear Market: When “Safe” Assets Decline More Than Stocks
The dominant narrative holds that Treasury bonds are safe assets — the destination for capital fleeing equity volatility. For short-duration Treasuries, this characterization is accurate. But for the 30-year bond, it has always been misleading. Duration — the sensitivity of a bond’s price to interest rate changes — transforms long-term government debt into one of the most volatile instruments in fixed income.
The data tells a different story than the safety narrative suggests. Between March 9, 2020 and October 19, 2023, the zero-coupon price sensitivity index for the 30-year Treasury declined 69.9% — a drawdown that exceeded the S&P 500’s peak-to-trough loss during the 2008 financial crisis (56.8%, according to FRED data). This was not a fringe outcome on a leveraged product. It was the mechanical consequence of the 30-year yield rising 412 basis points, from 0.99% to 5.11%, over 43 months.
A legitimate analytical qualification is that the zero-coupon index represents maximum duration sensitivity — a theoretical construct that no investor actually holds. The iShares 20+ Year Treasury Bond ETF (TLT), which tracks a portfolio of coupon-bearing Treasuries with maturities above 20 years, declined approximately 48% from its 2020 all-time high to its October 2023 trough, as reported by Bloomberg. Even this more conservative measure exceeded the S&P 500’s dot-com drawdown (49.1%) and came within striking distance of the GFC (56.8%). The severity of the bond bear market is not an artifact of the zero-coupon construction — it is a feature of duration.
This analysis uses a synthetic zero-coupon index. The zero-coupon price sensitivity index (P = 100 / (1 + y)^30) represents the price of a single cash flow received in 30 years. It isolates maximum duration sensitivity. No actual bond portfolio experiences this level of price volatility because: (1) coupon payments reduce effective duration, (2) most bond portfolios hold a mix of maturities, and (3) reinvested coupons partially offset price declines.
What this dataset does not measure. The zero-coupon index measures mark-to-market price sensitivity — it does not account for total return (coupons reinvested), credit risk (Treasuries have none), or the contractual guarantee of par at maturity. Unlike equities, a 30-year zero-coupon purchased at any yield will return $100 at maturity. The “drawdown” measures interim price volatility, not permanent capital loss. An investor who held a 30-year zero-coupon from 2020 to maturity in 2050 will receive par regardless of interim price movements. Over the full 49-year sample, long-duration Treasuries have delivered positive total returns — the Bloomberg US Long Treasury Total Return Index has compounded at approximately 7% annualized since 1973.
Drawdown Comparison: Bonds vs. Equities Since 1977
The drawdown comparison transforms the abstract concept of “rising rates” into something immediately comprehensible: a price decline measured in the same units as equity losses. When framed this way, the 2020–2023 bond bear market is no longer a footnote about interest rates — it becomes one of the largest asset price declines in modern financial history.
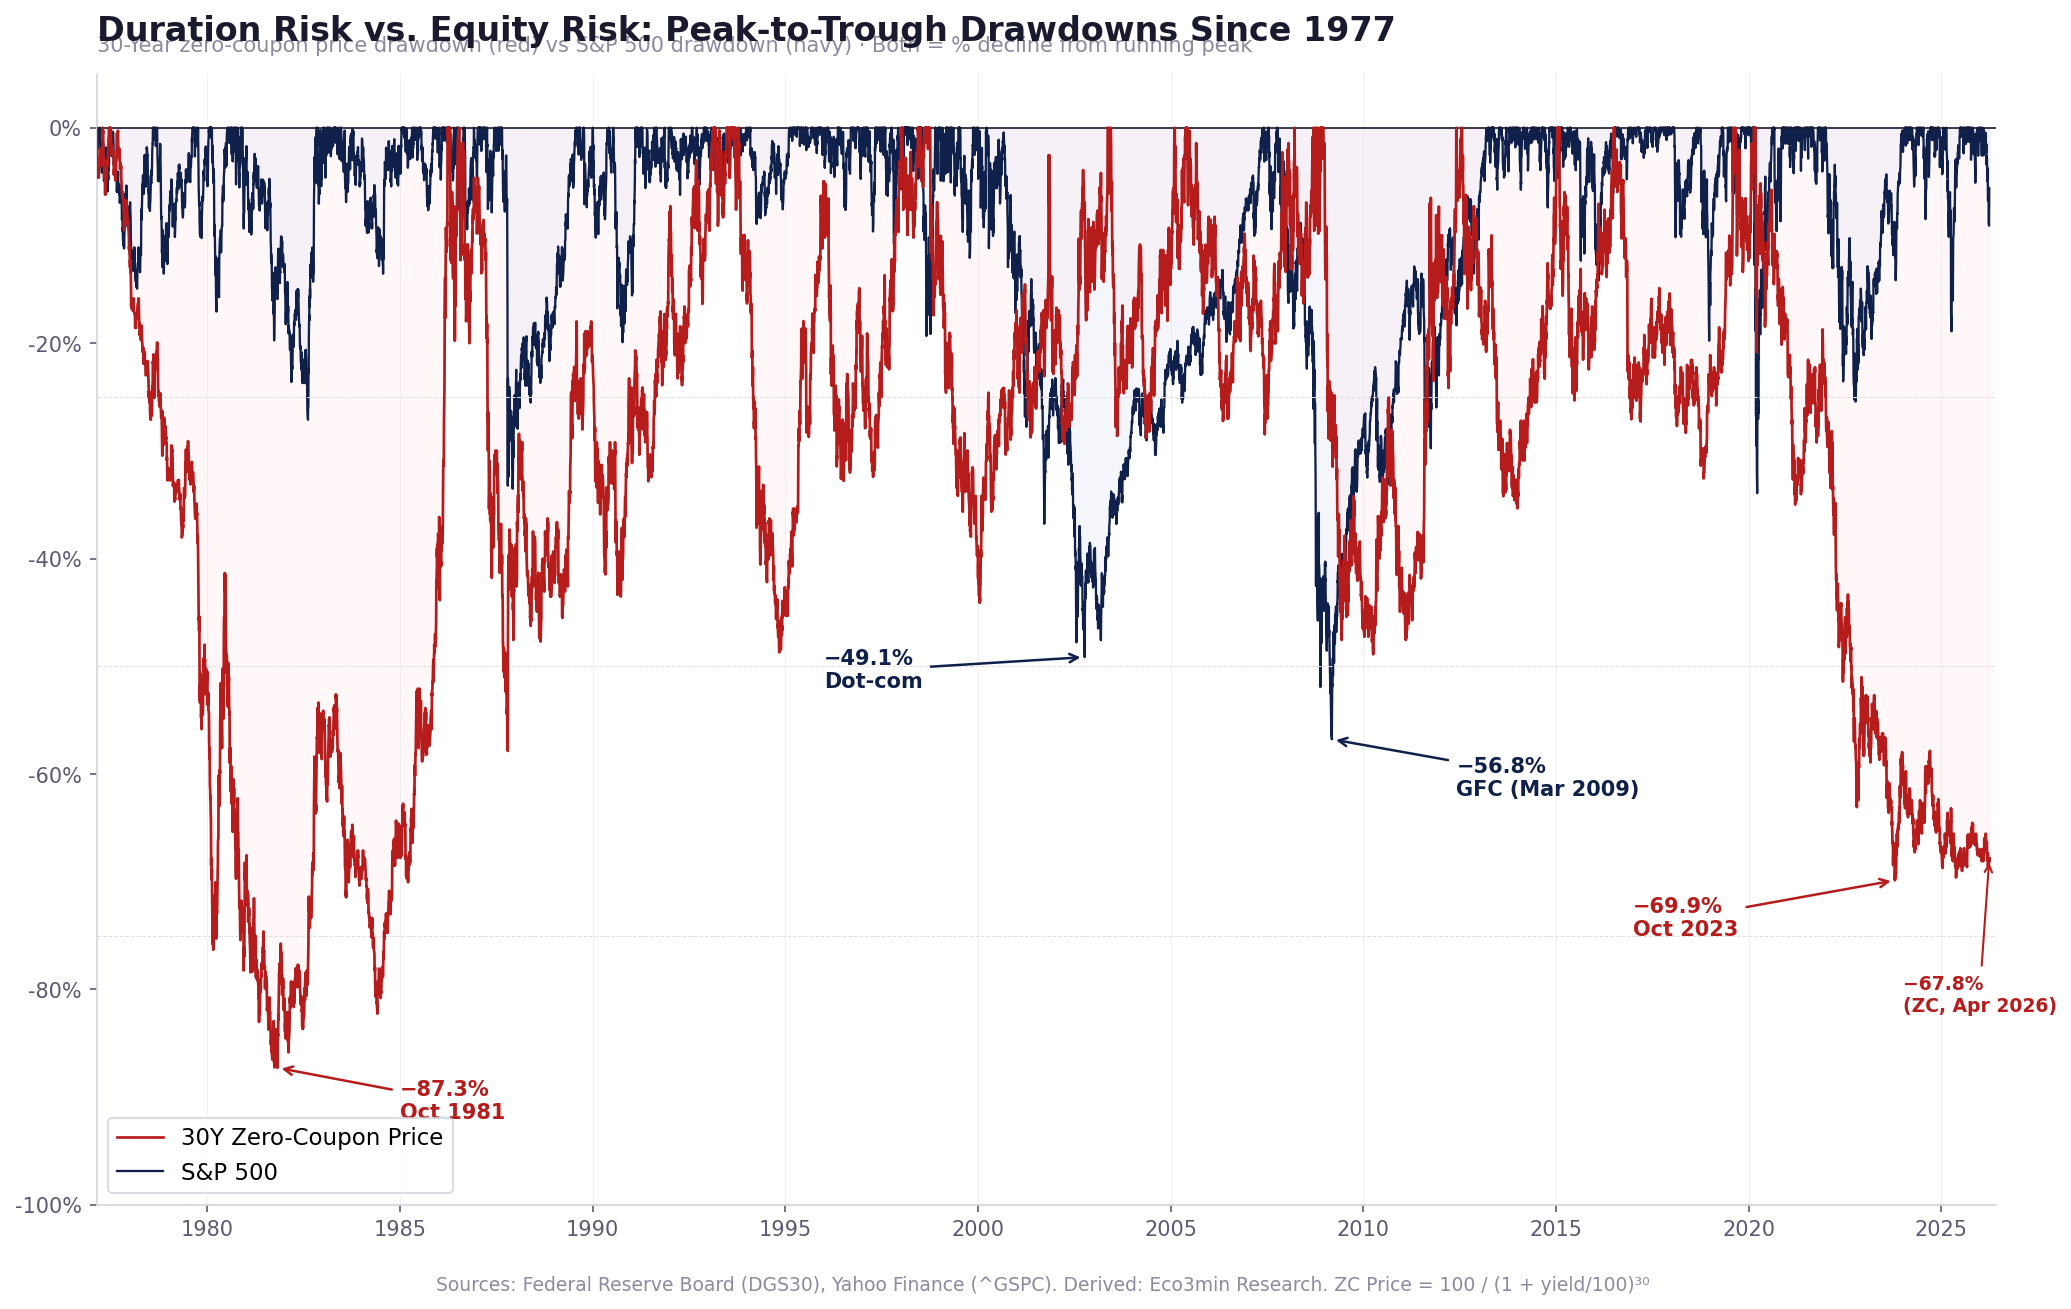
Duration Risk vs. Equity Risk: Peak-to-Trough Drawdowns Since 1977
30-Year zero-coupon price drawdown (red) overlaid with S&P 500 drawdown (navy). Both measured as percentage decline from running peak.

The 30-year zero-coupon price index has spent more time in deeper drawdown than the S&P 500 over the full 49-year sample. As of April 2026, the ZC index remains 67.8% below its March 2020 peak — while the S&P 500 has recovered to new highs. Duration risk is not a theoretical concern. It is the dominant risk in long-term government bonds.
Sources: Federal Reserve Board (DGS30), Yahoo Finance (^GSPC). Derived: Eco3min Research. ZC Price = 100 / (1 + yield/100)^30.
The Drawdown Scoreboard
| Episode | Asset | Drawdown | Duration | Recovered? |
|---|---|---|---|---|
| Volcker Shock (1977–1981) | 30Y ZC Price | −86.8% | 56 months | Yes (by ~2016) |
| Post-COVID Rate Normalization (2020–2023) | 30Y ZC Price | −69.9% | 43 months | No (−67.8% as of Apr 2026) |
| Post-COVID (2020–2023) | TLT (total return) | −48.4% | 48+ months | No |
| Global Financial Crisis (2007–2009) | S&P 500 | −56.8% | 17 months | Yes (by Mar 2013) |
| Dot-Com Crash (2000–2002) | S&P 500 | −49.1% | 31 months | Yes (by May 2007) |
| COVID Crash (Feb–Mar 2020) | S&P 500 | −33.9% | 1 month | Yes (by Aug 2020) |
| 2022 Correction | S&P 500 | −25.4% | 10 months | Yes (by Jan 2024) |
The comparison reveals a structural asymmetry: equity drawdowns are typically sharp and short (the GFC’s −56.8% lasted 17 months), while bond drawdowns are slow and persistent (the 2020–2023 ZC drawdown has not recovered after more than six years). The mechanism differs fundamentally: equities recover through earnings growth, while bonds recover only if yields decline back to prior lows — which requires a complete reversal of the monetary cycle. For how the Federal Reserve’s rate decisions interact with long-term yields, see our Federal Funds Rate analysis.
Duration Mechanics: Why 100 Basis Points Is Not Always 100 Basis Points
The 30-year zero-coupon bond has a modified duration of approximately 30/(1+y) years. At a yield of 1%, modified duration is 29.7 years — meaning a 1-percentage-point yield increase produces a roughly 29.7% price decline. At a yield of 8%, modified duration falls to 27.8 years — the same 1-point move produces a 27.8% decline. Duration is not constant; it varies with the level of yields.
But the more consequential asymmetry is between up-moves and down-moves. Due to convexity — the curvature of the price-yield relationship — a 100-basis-point decline in yield produces a larger price gain than a 100-basis-point increase produces in price loss. This is why the 38-year bond bull market generated such extraordinary returns: the mathematics of convexity rewarded declining rates disproportionately.
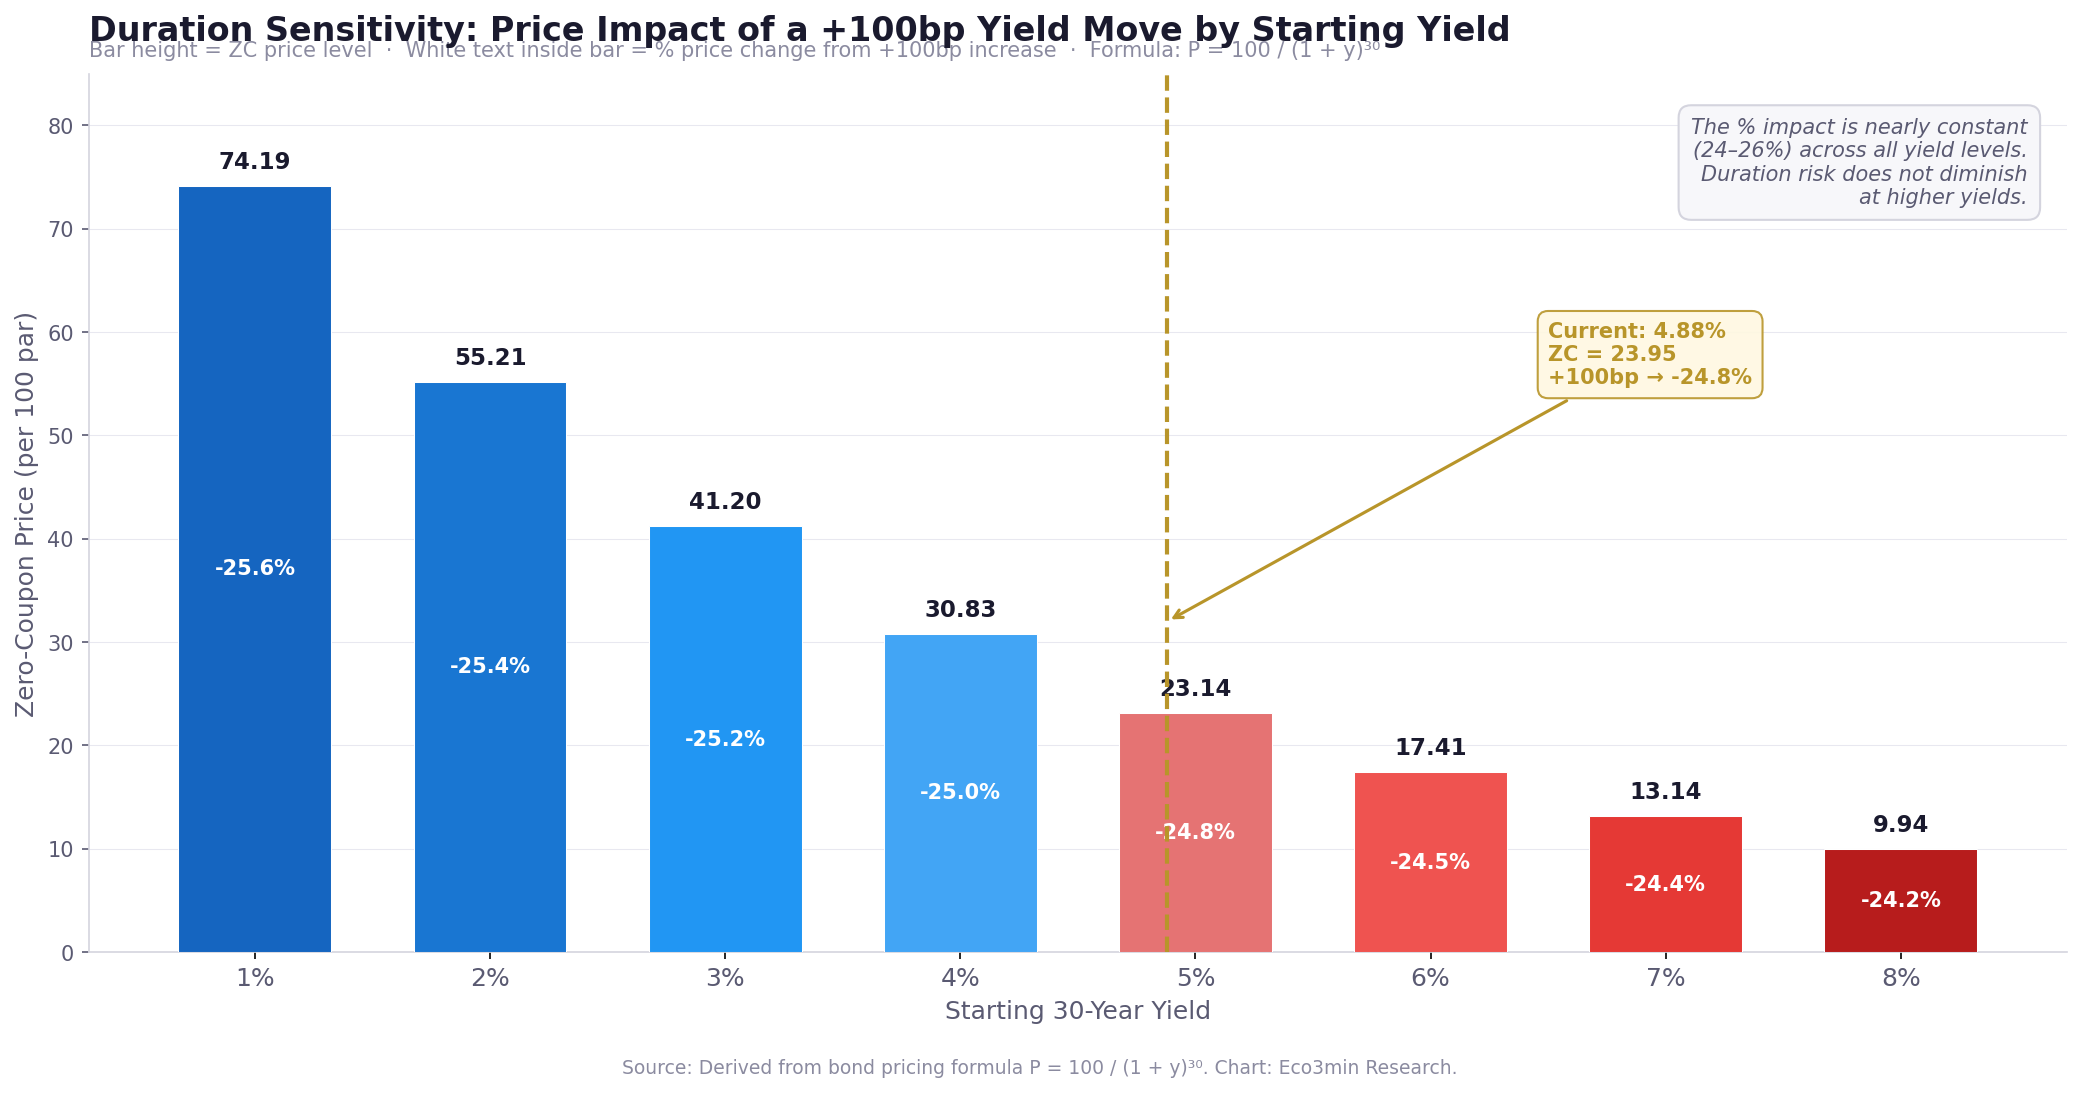
Duration Sensitivity: Price Impact of a +100bp Yield Move by Starting Yield
Zero-coupon price level and percentage change for a hypothetical 100-basis-point increase, at each starting yield.

A 100-basis-point yield increase produces an approximately 24–26% decline in 30-year zero-coupon price, regardless of the starting yield level. Duration risk is not a function of where yields are — it is a constant feature of the instrument’s 30-year maturity. The difference is that starting from 1%, there are many more basis points of potential upside in yield (and downside in price) than starting from 8%.
Source: Derived from bond pricing formula P = 100 / (1 + y)^30. Chart: Eco3min Research.
Duration Sensitivity Table
| Starting Yield | ZC Price | +100bp → New Price | Price Change | Modified Duration |
|---|---|---|---|---|
| 1% | 74.19 | 55.21 | −25.6% | 29.7 yrs |
| 2% | 55.21 | 41.20 | −25.4% | 29.4 yrs |
| 3% | 41.20 | 30.83 | −25.2% | 29.1 yrs |
| 4% | 30.83 | 23.14 | −25.0% | 28.8 yrs |
| 4.88% (current) | 23.95 | 17.98 | −24.8% | 28.6 yrs |
| 5% | 23.14 | 17.41 | −24.8% | 28.6 yrs |
| 6% | 17.41 | 13.14 | −24.5% | 28.3 yrs |
| 7% | 13.14 | 9.94 | −24.4% | 28.0 yrs |
| 8% | 9.94 | 7.54 | −24.2% | 27.8 yrs |
The table reveals a counterintuitive insight: the percentage price impact of a 100-basis-point move is nearly constant across yield levels (24–26%). But the dollar impact varies enormously. At 1%, a 100bp rise destroys $18.98 of value per $74.19 of price. At 8%, it destroys $2.40 per $9.94 of price. The risk is proportional — but the absolute exposure is dramatically higher at low yields, which is precisely when investors tend to feel safest. For how these rate movements affect housing costs, see our 30-Year Mortgage Rate dataset.
What Happened Next? Forward S&P 500 Returns by Yield Regime
If the 30-year yield functions as a barometer of long-term rate expectations, does its level predict subsequent equity returns? The forward return distribution by yield regime provides a partial answer — with important caveats about sample composition and overlapping windows.
| Yield Regime | n | Fwd 6m (Median) | Fwd 12m (Median) | 12m IQR (P25–P75) | % Positive 12m | 12m MDD (Median) |
|---|---|---|---|---|---|---|
| Low (<3%) | 1,691 | +7.1% | +14.1% | −0.3% to +20.2% | 74.3% | −10.2% |
| Moderate (3–5%) | 3,409 | +5.7% | +11.8% | +4.2% to +17.6% | 84.9% | −10.3% |
| High (5–8%) | 3,786 | +4.9% | +9.7% | −1.3% to +21.6% | 72.9% | −10.8% |
| Extreme (>8%) | 3,139 | +5.9% | +12.6% | +3.9% to +23.2% | 80.9% | −10.2% |
The “Moderate” yield regime (3–5%) delivered the highest percentage of positive 12-month outcomes (84.9%) with the tightest interquartile range (+4.2% to +17.6%). The “High” regime (5–8%) had the lowest probability of positive outcomes (72.9%) and the widest dispersion — consistent with higher rates reflecting greater macroeconomic uncertainty. The “Extreme” regime (>8%), concentrated in the early 1980s, delivered strong median returns (+12.6%) as the subsequent rate decline powered both bond and equity gains.
Overlapping daily windows inflate apparent sample sizes — the 3,409 observations in the Moderate regime represent correlated samples, not independent trials. Non-overlapping monthly windows would reduce sample sizes by approximately 95%. Regime transitions are defined by the first observation in each regime. Forward returns use the S&P 500 close on the observation date. For forward equity returns conditioned on other volatility measures, see our VIX Volatility Index analysis.
Past distributions are not predictive of future outcomes. Regime-conditional statistics describe historical patterns, not expected returns.
- ▸ 30Y yield at 4.88%: A sustained move above 5.11% (the October 2023 peak) would mark a new cycle high — last reached October 19, 2023. A break above 5.50% would push the ZC price below 19.3, deepening the drawdown to −74%.
- ▸ Yield regime boundary at 5.00%: The current reading sits just below the Moderate/High threshold. A cross above 5% would shift the regime classification to High (5–8%), which has historically been associated with wider equity return dispersion (IQR: −1.3% to +21.6%). See our yield curve spread page for context on curve dynamics.
- ▸ Recovery threshold at 0.99%: The ZC price index cannot return to its March 2020 peak unless the 30-year yield falls back below 1% — a level reached only once in 49 years. At current yields, the bond bear market is structurally unrecoverable absent an extreme monetary easing cycle.
- ▸ Next catalyst: FOMC decision (next scheduled meeting). Treasury refunding announcement (quarterly). Both events directly affect duration supply and demand dynamics at the long end.
Yield Regime Classification
The dataset classifies each daily observation into one of four yield regimes based on the DGS30 level. These thresholds are not arbitrary — they correspond to economically meaningful boundaries: the 3% threshold approximates the long-run inflation target plus a minimal real yield, while the 8% threshold marks the level above which debt service costs historically constrain fiscal policy.
1,691 observations (13.8% of sample). Concentrated 2019–2022. Maximum duration sensitivity — a 100bp move produces ~26% price change. Historically associated with flight-to-safety flows and accommodative monetary policy.
3,654 observations (29.8%). The current regime (4.88%). Historically associated with the tightest equity return dispersion and highest probability of positive 12-month outcomes (84.9%).
3,793 observations (30.9%). The most common regime over the full sample. Includes the 1990s expansion and early 2000s. Wide equity return dispersion (IQR: −1.3% to +21.6%).
3,139 observations (25.6%). Entirely concentrated 1977–1990 (Volcker era). At these yields, ZC prices range from 1.43 to 9.94 — the 30-year bond trades like a deep-discount instrument.
Duration Risk Calculator
Zero-Coupon Price Sensitivity Calculator
Adjust the 30-year yield to see the zero-coupon price, modified duration, and the price impact of a ±100bp move.
ZC Price
Mod. Duration (yrs)
If Yield −100bp
If Yield +100bp
Historical Turning Points
October 1981 — The Volcker Peak: 15.21%
On October 26, 1981, the 30-year Treasury yield reached 15.21% — the highest level in the series’ history. The zero-coupon price index stood at 1.43, having declined 86.8% from its February 1977 starting value of 10.80 (yield: 7.70%). The Federal Reserve, under Paul Volcker, had raised the Federal Funds rate above 19% to break the inflationary spiral that had pushed CPI above 14% year-over-year. The 30-year yield reflected not only current policy rates but also the market’s deep skepticism that inflation had been durably tamed — the term premium embedded an inflation risk premium that would take years to unwind. The S&P 500 stood at 118.16 on the same date. For context on how the Volcker tightening intersected with the short end of the curve, see our 3-Month Treasury Bill dataset.
October 1993 — The Pre-Massacre Low: 5.78%
By October 1993, the 30-year yield had declined to approximately 5.78%, driven by the post-Gulf War recovery and the Clinton-era fiscal consolidation. The zero-coupon price had risen to approximately 18.27 from its 1981 trough of 1.43 — a gain of over 1,100%. This was the calm before the 1994 bond massacre, when the Fed began an unexpected tightening cycle that sent the 30-year yield above 8% by November 1994 — producing a 38.7% decline in the zero-coupon price in approximately 12 months.
August 2020 — The Record Low: 1.19%
On August 4, 2020, the 30-year yield touched 1.19% — the lowest sustained level in the series’ history (the intraday low of 0.99% on March 9, 2020 occurred during the COVID panic and lasted only briefly). The zero-coupon price index reached 70.12 (1.19%) and had peaked at 74.41 on March 9 (0.99%). At these yields, modified duration exceeded 29.6 years — meaning a single percentage point of yield increase would erase nearly 30% of the bond’s value. The S&P 500 was recovering from its COVID low and stood at approximately 3,300. This was the apex of the 38-year bond bull market, and the starting point for the largest bond bear market since the Volcker era.
October 2023 — The Bear Market Trough: 5.11%
On October 19, 2023, the 30-year yield reached 5.11% — its highest level since 2007. The zero-coupon price index stood at 22.42, representing a 69.9% decline from the March 2020 peak of 74.41. The 412-basis-point yield increase over 43 months had produced a drawdown exceeding the S&P 500’s GFC loss (−56.8%). The S&P 500 itself stood at 4,278 on the same date — down approximately 12% from its January 2022 peak but far from a comparable drawdown. The bond market and equity market were, for the first time since the early 1980s, in simultaneous bear markets — a 60/40 portfolio’s worst nightmare. For how this rate shock affected credit markets, see our credit spreads analysis.
April 2026 — Current: 4.88%
As of April 2, 2026, the 30-year yield stands at 4.88%, placing it in the 41st percentile of all historical observations. The zero-coupon price index is 23.95 — still 67.8% below its March 2020 peak. Modified duration is 28.6 years, meaning a 100-basis-point move from current levels would produce an approximately 25% price change. The bond market remains in a structural bear market: recovery to the 2020 peak would require yields to return below 1%, which would necessitate an economic shock of extraordinary severity. For the broader macro picture, see our Nonfarm Payrolls analysis and CPI Inflation History.
Methodology
Core Formula
This formula computes the present value of $100 received in 30 years, discounted at the current 30-year Treasury yield. It represents the price sensitivity of a zero-coupon bond — the maximum-duration instrument for a given maturity. Modified duration equals 30 / (1 + y), where y is the decimal yield.
Regime Classification Algorithm
Thresholds are fixed and applied uniformly across the full sample. Sensitivity: shifting thresholds by ±50bp changes regime counts by 5–12% but does not alter the directional findings. The 3% threshold roughly corresponds to a 1% real yield plus 2% inflation target. The 8% threshold marks the level above which all observations fall within the 1977–1990 Volcker/post-Volcker period.
Data Gap: February 2002 – February 2006
The US Treasury discontinued 30-year bond issuance in October 2001. The DGS30 series was last reported on February 15, 2002 (yield: 5.41%) and resumed on February 9, 2006 (yield: 4.53%). This 4-year gap does not affect the 2020–2023 drawdown calculation. The running peak (zc_peak) is computed as a forward-looking cumulative maximum — the gap period is simply absent from the series, and no interpolation is applied.
Dataset Design
| Variable | Type | Unit | Source | Calculation |
|---|---|---|---|---|
| date | date | YYYY-MM-DD | FRED | Trading day |
| dgs30 | float | % | FRED DGS30 | Direct observation |
| zc_price | float | index | Derived | 100 / (1 + dgs30/100)^30 |
| modified_duration | float | years | Derived | 30 / (1 + dgs30/100) |
| zc_drawdown_pct | float | % | Derived | (zc_price − zc_peak) / zc_peak × 100 |
| yield_regime | string | category | Derived | Fixed thresholds: 3%, 5%, 8% |
| sp500 | float | index | Yahoo ^GSPC | Daily close |
| sp500_drawdown_pct | float | % | Derived | (sp500 − sp500_peak) / sp500_peak × 100 |
| sp500_fwd_12m_pct | float | % | Derived | Forward 12-month S&P 500 return |
| recession | bool | — | NBER | Recession indicator |
| yield_percentile | float | % | Derived | Rank within full sample |
Python Reproduction Code
# Reproduce the zero-coupon price index from FRED DGS30
import pandas as pd
import numpy as np

# Fetch DGS30 from FRED
url = "https://fred.stlouisfed.org/graph/fredgraph.csv?id=DGS30"
df = pd.read_csv(url)
df.columns = ['date', 'dgs30']
df['date'] = pd.to_datetime(df['date'])
df['dgs30'] = pd.to_numeric(df['dgs30'], errors='coerce')
df = df.dropna()

# Compute zero-coupon price sensitivity index
df['zc_price'] = 100 / (1 + df['dgs30'] / 100) ** 30

# Drawdown from running peak
df['zc_peak'] = df['zc_price'].cummax()
df['zc_drawdown_pct'] = (df['zc_price'] - df['zc_peak']) / df['zc_peak'] * 100

# Modified duration
df['modified_duration'] = 30 / (1 + df['dgs30'] / 100)

print(df.tail())
Download Dataset
License: CC BY 4.0 — free to use, share, and adapt with attribution to Eco3min Research.
Data Sources & Academic References
- Primary Federal Reserve Board — H.15 Statistical Release, Series DGS30 (30-Year Treasury Constant Maturity Rate, daily, Feb 1977 – present)
- Primary Yahoo Finance — ^GSPC (S&P 500 daily close, Jan 1977 – present)
- Primary National Bureau of Economic Research — NBER Recession Dates (US Business Cycle Expansions and Contractions)
- Reference Bloomberg — US Long Treasury Total Return Index (LUTLTRUU), US Treasury 20+ Year Index (LT11TRUU)
- Reference iShares — 20+ Year Treasury Bond ETF (TLT), historical NAV and drawdown data
- Research Ilmanen, A. (2011). Expected Returns: An Investor’s Guide to Harvesting Market Rewards. Wiley. Chapter on bond risk premia and duration.
- Research Campbell, J.Y. & Shiller, R.J. (1991). “Yield Spreads and Interest Rate Movements: A Bird’s Eye View.” Review of Economic Studies, 58(3), 495–514.
- Research Greenwood, R. & Vayanos, D. (2014). “Bond Supply and Excess Bond Returns.” Review of Financial Studies, 27(3), 663–713.
Methodological Limitations
- The zero-coupon price index is a theoretical construct — it measures maximum duration sensitivity, not the actual price of any traded instrument. Real bond portfolio losses are reduced by coupon payments, shorter average durations, and reinvestment effects.
- The DGS30 series has a 4-year gap (Feb 2002 – Feb 2006) when the Treasury suspended 30-year bond issuance. No interpolation is applied. The cumulative drawdown calculation resets its running peak after the gap.
- The drawdown comparison with equities does not account for total return. Long Treasury bonds pay coupons; equities pay dividends. Over the full sample, coupon income substantially reduces the effective drawdown for bond holders.
- Yield regime thresholds (3%, 5%, 8%) are arbitrary round numbers. Moving thresholds by ±50bp changes regime counts but does not alter directional findings.
- Forward S&P 500 returns are computed with overlapping daily windows, inflating apparent sample sizes. Non-overlapping monthly windows would reduce sample counts by ~95%.
- The comparison of bond and equity drawdowns does not account for recovery mechanisms. Equities can recover through earnings growth. Bond prices recover only if yields decline — which requires a reversal of the monetary cycle. These are structurally different risks.
Frequently Asked Questions
What is the current US 30-Year Treasury yield?
As of April 2, 2026, the 30-Year Treasury Constant Maturity Rate (FRED series DGS30) is 4.88%. This places the current yield at the 41st percentile of all observations since February 1977 — below the series median of 5.46%. The corresponding zero-coupon price index is 23.95, representing a 67.8% decline from the March 2020 peak of 74.41.
How much did long-term Treasury bonds lose between 2020 and 2023?
The magnitude depends on the instrument. A synthetic 30-year zero-coupon price index — which isolates maximum duration sensitivity — declined 69.9% from March 2020 (yield: 0.99%) to October 2023 (yield: 5.11%). The iShares 20+ Year Treasury Bond ETF (TLT), which includes coupon payments and holds a portfolio of bonds with varying maturities, declined approximately 48% from its 2020 all-time high. Both figures exceeded the S&P 500’s dot-com drawdown of 49.1%.
Why does this page use a zero-coupon index instead of actual bond prices?
The zero-coupon index isolates duration risk in its purest form. Coupon bonds have shorter effective durations because periodic payments reduce the average time-to-cashflow. By stripping out coupons, the index shows what a 412-basis-point yield increase does to the present value of a single cash flow received in 30 years. This is a sensitivity measure — the maximum possible price impact — not a representation of any actual portfolio’s loss. It makes duration risk visible and comparable to equity drawdowns, which is otherwise impossible with yield charts alone.
Is a 30-year Treasury bond riskier than stocks?
It depends on the definition of risk. In terms of peak-to-trough mark-to-market drawdown, the 30-year zero-coupon price index has exhibited larger declines than the S&P 500 during several periods — including 2020–2023 (−69.9% vs −25.4%). However, Treasury bonds carry zero credit risk and guarantee par at maturity. An investor who buys a 30-year zero-coupon and holds to maturity will receive $100 regardless of interim price movements. The risk is in the interim: if you need to sell before maturity, duration determines your price sensitivity. For a hold-to-maturity investor, the “drawdown” is economically irrelevant.
Why was the 30-year Treasury discontinued between 2002 and 2006?
The Treasury Department announced in October 2001 that it would suspend issuance of 30-year bonds, citing reduced borrowing needs due to budget surpluses in the late 1990s and early 2000s. The last 30-year auction before the suspension occurred in August 2001. The decision was reversed in February 2006 when the Treasury resumed 30-year issuance to take advantage of favorable long-term borrowing rates and growing demand from pension funds and insurers. The FRED series DGS30 reflects this gap — no interpolated values are provided.
Can the 30-year Treasury bond market recover to 2020 levels?
Recovery of the zero-coupon price index to its March 2020 peak of 74.41 would require the 30-year yield to fall back below 1% — a level reached only once in the series’ 49-year history, during a global pandemic-driven flight to safety. At the current yield of 4.88%, the zero-coupon price would need to increase by approximately 211% to reach 74.41. This would require an economic shock severe enough to push real yields deeply negative across the entire curve — a scenario that is mechanically possible but historically unprecedented outside of March 2020.
Related Research
Last updated — 14 April 2026