Asset Allocation Strategies: Building Resilient Portfolios Across Market Regimes
Asset allocation, risk management and cycle reading : the analytical frameworks to build portfolios resilient to macroeconomic regimes.
— A sound strategy does not try to predict the market. It structures the portfolio to survive what the market cannot foresee.
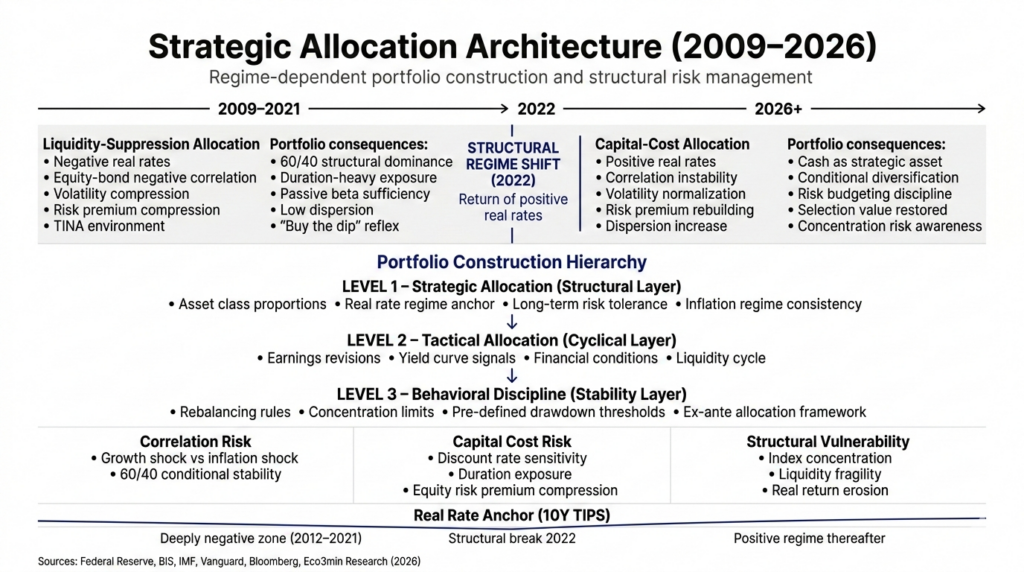
Asset allocation is not a yield optimization — it is a management of vulnerability to macroeconomic regimes. In a world of zero rates and abundant liquidity (2009–2021), allocation relied on a simple principle: passive diversification, maximal exposure to risky assets, volatility suppressed by central banks. The 60/40 portfolio delivered more than 10% annualized for a decade (Vanguard). Stock selection mattered little — the regime carried everything. That world no longer exists. In a world of positive real rates, structurally higher inflation, unstable correlations and geopolitical fragmentation, allocation becomes active management of vulnerabilities — to the interest rate regime, concentration, correlation, and physical constraints. The 60/40 portfolio suffered its worst year since the 1970s in 2022 (stocks -19%, bonds -31%, Vanguard). This is not an accident — it is a regime change.
To build a solid understanding of how to structure a portfolio across different market environments, see our investing for beginners hub.
The question that structures this pillar is not “what to buy?” — it is: in which regime of real rates, liquidity, correlation and volatility does the portfolio operate, what vulnerabilities are inherent to that regime, and how can the portfolio architecture be structured to absorb them?
This pillar is the operational extension of the analysis formalized in the pillars Monetary Policy & Rates, Financial Markets, Macroeconomics & Geopolitics, Equities & ETFs and Commodities. It does not duplicate their content — it draws implications for portfolio construction. The approach is deliberately non-prescriptive: no model allocation, no stock picks, no recommendations. The aim is to formalize the analytical frameworks that explain why certain portfolio architectures resist particular regimes and collapse under others. The sub-pillars — Foundations of allocation, Managing risk, Reading the cycle, Cognitive traps & biases — deploy this framework.
The macro regime determines strategy — not the reverse
Academic and empirical research is unambiguous: allocation explains more than 90% of long-term portfolio return variation (Brinson, Hood, Beebower, 1986; Ibbotson, Kaplan, 2000). Security selection and timing explain only the remainder. But this conclusion — universally cited, rarely understood — does not mean allocation is a static choice. It means that the portfolio architecture must be coherent with the prevailing macro regime — and that a regime shift requires reevaluating that architecture.
The fundamental error is calibrating a portfolio on the properties of the previous regime. The assumptions that worked during 2009–2021 — negative correlation between equities and bonds, low volatility, compressed risk premia, multiple expansion driven by negative real rates — are not natural laws. They are properties of a specific regime (zero rates, QE, sub-2% inflation). When the regime changes, the properties change — and portfolios calibrated to the old regime suffer the heaviest losses.
2009-2021: the regime that shaped current reflexes
The zero-rate and QE regime produced a set of market properties that most institutional and retail portfolios internalized as constants. Understanding these properties — and their contingency — is essential to understanding why the 2022 regime shift was so painful.
Negative equity/bond correlation: the foundation of 60/40
The 60/40 portfolio (60% equities, 40% bonds) delivered more than 10% annualized between 2009 and 2021 (Vanguard Balanced Index Fund). Its apparent resilience relied on one property: negative correlation between equities and bonds. When equities fell (growth shocks), bonds rose (flight to quality, rate cuts) — and vice versa. In 2008, the S&P 500 lost 37% while 20+ year Treasuries gained 33% (ICE BofA). In March 2020, Treasuries again cushioned the S&P’s -34% shock. This property made 60/40 the dominant institutional allocation framework (endowments, pension funds, insurance).
But negative correlation is not a natural law — it is a property of a low-inflation regime. When inflation is low and stable, dominant shocks are growth shocks (recessions), which push rates down and bonds up. The two asset classes offset each other. When inflation is high, dominant shocks are supply shocks — rates rise (to fight inflation) at the same time equities fall (multiple compression, slowdown). Both asset classes fall together. This is exactly what happened in 2022 — and likewise during the 1970s. Equity/bond correlation was positive for most of 1965–2000 (Bloomberg, AQR research).
Volatility suppression: the central bank put
The VIX stayed below 12 for 52% of trading days in 2017 — a record (CBOE). The 30-day realized volatility of the S&P 500 fell to 4.5% in November 2017 (Bloomberg). Central banks acted as the system’s implicit insurer: at every stress episode (2011, 2015, 2018, March 2020), the response was monetary easing that truncated the loss distribution. This “central bank put” produced three structural effects: generalized underestimation of risk (equity risk premium below 3%, Damodaran NYU), proliferation of volatility-selling strategies (short-VIX AUM > $3bn before Volmageddon Feb-2018, Bloomberg), and a deep behavioral bias — investors learned that declines are “buying opportunities” systematically validated by central bank intervention. “Buy the dip” worked 43 times consecutively between 2009 and 2021 (Goldman Sachs). It failed in 2022.
There Is No Alternative: TINA
With negative real rates (TIPS 10y at -1.19% in Aug-2021, Federal Reserve), bonds no longer remunerated capital in real terms. Money market funds yielded zero. Cash was a cost, not an asset. Capital was forced into risky assets (equities, real estate, private equity, credit, crypto) to obtain positive returns — the TINA regime. The “optimal” allocation was simple: overweight risky assets, underweight cash and bonds, accept historically low risk premia because there was literally no remunerative alternative.
2022: the year when all assumptions were invalidated simultaneously
2022 was not merely a bad market year — it was a simultaneous invalidation of the previous regime’s properties. Understanding what happened in 2022 is a prerequisite to any thinking about allocation in the new regime.
Correlation inverted. The S&P 500 fell 19% while 20+ year Treasuries lost 31% (ICE BofA) — the worst bond performance since the 1780s (Deutsche Bank). The 60/40 portfolio lost 16% — its worst year since the 1970s (Vanguard). The portfolio’s insurance failed at the exact moment it was needed.
Volatility returned. The VIX recorded six episodes above 30 between 2022 and 2024, versus two in 2013–2019 (CBOE). The VIX hit 65 in August 2024 during the unwind of the yen carry trade (CBOE). Average volatility moved from 14.2 (2013–2019) to roughly 20 (2022–2024), returning to its historical mean of 19.5 (CBOE). Volatility suppression was a product of the regime — not a permanent state.
Cash became an asset. US T-bills yield 5.25% (Federal Reserve). TIPS offer real yields of +2.40% (Federal Reserve, Oct-2023). Money funds gathered more than $1,000bn in 2023, pushing assets to a record $6,000bn (ICI). The TINA regime was replaced by TARA (There Are Reasonable Alternatives). Cash is no longer a cost — it is a strategically paid option.
Treating 2022 as a one-off shock after which the previous regime will resume. 2022 is not an accident in a normal world — it is the passage from one regime to another. The properties of 2009–2021 (negative correlation, low volatility, TINA, compressed premia) were consequences of a specific monetary configuration (zero rates, QE, sub-2% inflation). That configuration was removed. The properties that depended on it disappeared with it. A portfolio waiting for their return is calibrated to a regime that no longer exists.
The new regime: four properties for portfolio construction
The regime emerging since 2022 presents four structural properties for allocation — each both a risk to manage and a variable to integrate into portfolio architecture.
Property 1: positive real rates change the opportunity cost of capital
For the first time since 2007, capital has a risk-free real return. TIPS offer +2% to +2.40% (Federal Reserve). T-bills 5.25%. Direct consequence: any allocation to a risky asset must justify an expected return above this floor. The S&P 500 forward P/E at 21x yields roughly a 4.8% earnings yield — an equity risk premium of ~2.8% over real rates (Damodaran, NYU), versus a historical average of 4.5–5%. The market modestly compensates equity risk. Investment grade bonds offer 5–6% nominal (Bloomberg US Aggregate). Listed real estate faces cap rate pressure. Private equity faces higher debt costs and slower exits. The TARA regime changes the asset class hierarchy — and makes allocations that are alternatives to cash analytically more demanding. Implications for equity valuations are developed in the Equities & ETF pillar and the Valuations & Profits sub-pillar.
Property 2: unstable correlation makes diversification conditional
In a regime of structurally higher inflation (3–4% vs. 1–2% previously), equity/bond correlation is unstable — negative during growth shocks (recession), positive during supply shocks (inflation). The 60/40 portfolio can no longer be assumed “neutral” — it is an implicit bet on the dominant shock type. If the main risk is a growth shock, bonds protect. If the main risk is an inflation shock (commodities, fragmentation), bonds amplify losses. Portfolio construction in this regime requires distinguishing between these scenarios — and considering assets whose correlation with equities is structurally low in both cases: commodities, gold, TIPS, cash. Correlation analysis by regime is developed in the Financial Markets pillar.
Property 3: dispersion restores the value of selection
The 2009–2021 regime was a low-dispersion regime — when everything rises, selection adds little value. The current regime is high dispersion. The Magnificent 7 outperformed the S&P by more than 100 points in 2023 (Goldman Sachs). The Russell 2000 underperformed the S&P 500 by over 30 points cumulatively between 2021 and 2024 (FTSE Russell). High-yield defaults rose from 1.0% to 3.9% (Moody’s). Bankruptcies reached 642 in 2023 (S&P Global MI). When capital has a cost, discrimination becomes possible again — and selection regains value. Index concentration (top 10 > 35% of the S&P 500, S&P Global) creates both concentration risk and opportunity for approaches that deviate (equal-weight, value, international). Concentration analysis is developed in the Equities & ETF pillar.
Property 4: physical constraints add a dimension absent from the previous regime
Underinvestment in hydrocarbons, stress on critical metals and geopolitical fragmentation — documented in the Commodities pillar — are supply risks that portfolios built in 2009–2021 did not integrate. Historically, commodities have been the only asset class positively correlated with unexpected inflation (Gorton, Rouwenhorst, 2006; AQR). Gold rose from $1,060 in 2015 to over $2,400 in 2024 (LBMA), supported by record central bank purchases (1,037t in 2023, 1,045t in 2024, WGC). Portfolio construction in a regime of physical constraints requires treating commodities not as a tactical bet but as a structural hedge — against inflation, supply shocks and deterioration in terms of trade. Transmission of physical constraints is developed in the Energy & Physical Constraints sub-pillar.
Allocation: process before performance
The distinction between process and outcome is the most important — and most routinely violated — intellectual discipline in investing. An allocation can produce a good result for the wrong reasons (overweighting tech during a bull market is not skill — it is lucky alignment with the regime). An allocation can produce a poor short-term result for the right reasons (diversification costs performance when one factor dominates, as in 2023). This distinction is explored in our reference piece: why strategy must precede performance analysis.
Asset allocation determines the bulk of long-term performance (Brinson et al., 1986). In practice it breaks down into two hierarchically distinct decisions. The first — strategic allocation — sets structural proportions across asset classes (equities, bonds, commodities, real estate, cash) according to the dominant regime and investment horizon. It changes only when the regime changes. The second — tactical allocation — adjusts weights marginally based on cycle signals (earnings revisions, yield curve, financial conditions). By nature its amplitude is modest. The persistent temptation is to invert the hierarchy — to make tactical allocation (market timing) the core strategy at the expense of strategic allocation. Empirical data show that investors who try to time markets destroy on average 1.5% annualized relative to those who stay invested (Dalbar QAIB, 2024). The Foundations of allocation sub-pillar explores classic approaches — 60/40, All-Weather, Risk Parity, Barbell — and the conditions in which their assumptions hold or fail.
Risk: the variable that returns do not measure
Risk management is the true differentiator between a durable strategy and a sequence of opportunistic bets. Returns measure what happened. Risk measures what could happen — and the portfolio’s ability to survive it.
Risk is not just volatility. A portfolio 100% in Treasuries has low volatility — yet it lost 31% in 2022 (ICE BofA 20+ yrs). A portfolio 100% in money funds has zero volatility — yet it loses 100% of purchasing power in 35 years at 2% inflation (mathematical). The relevant risks are permanent capital loss (unrecovered drawdown) and loss of purchasing power (negative real return over the horizon). The VIX measures neither — it measures 30-day uncertainty, not structural risk.
The current regime concentrates risks that models calibrated to the prior decade do not capture. Concentration risk (Magnificent 7 > 30% of the S&P 500, S&P Global) means a shock to a handful of names affects the whole index. Unstable correlation risk (equities and bonds falling together) invalidates classic diversification models. Liquidity risk (E-mini S&P order-book depth -50% since 2019, JPMorgan) means liquidity is abundant in normal times and vanishes when most needed. The Managing risk sub-pillar expands on these dimensions and develops sizing and hedging strategies.
Reading the cycle: what leading indicators say about positioning
No strategy is universal — each macro regime favors distinct asset classes and factors. The goal is not to predict cycle inflection points precisely (no one does reliably), but to avoid blatant inconsistencies between portfolio positioning and the prevailing regime.
The most empirically reliable cycle signals are documented in Eco3min’s analytical pillars. The yield curve — the spread between long and short yields — has preceded every US recession since 1950 with a 12–24 month lead when it inverts (Federal Reserve New York). The earnings revisions ratio — when it falls below 0.50 — precedes S&P 500 underperformance with >70% probability at 6 months (Citi Research). Financial conditions (Goldman Sachs Financial Conditions Index) eased from Oct-2023 to end-2024, “undoing” part of the Fed’s tightening even as Fed Funds stayed at 4.50% — illustrating divergence between de jure monetary policy and de facto market conditions. Commodities — copper as an industrial cycle indicator, gold as a systemic risk indicator — deliver complementary signals to financial indicators. The Reading the cycle sub-pillar develops this signal framework and the sector rotation mechanics it implies.
Behavioral biases: the enemy within
The costliest investment mistakes rarely stem from lack of information — they stem from systematic cognitive biases precisely documented by behavioral finance. The average investor underperforms the market by 1.5% per year (Dalbar QAIB, 2024) — not for lack of skill, but for inability to maintain discipline under emotion.
Three biases are structurally value-destroying. Recency bias leads to extrapolating the recent regime — investors who calibrated portfolios to 2009–2021 (negative correlation, buy-the-dip, tech growth dominance) suffered heaviest losses in 2022 because they internalized a regime’s properties as constants. FOMO (fear of missing out) causes overweighting the strongest recent performers — in 2021, flows into tech/growth funds hit records (ICI) when valuations were most stretched. Loss aversion leads to selling at the worst moment — equity fund outflows peaked in Oct-2022 (ICI), exactly at the S&P low (3,577, 13 October 2022).
The answer is not emotion elimination — it is implementing ex-ante rules that override judgement in stress moments: automatic rebalancing, concentration limits, predefined exit criteria, scheduled strategic allocation reviews (not reactive trading). The Cognitive traps & biases sub-pillar decodes these mechanisms and offers discipline frameworks.
Asset allocation is not a yield optimization — it is a management of vulnerability to macroeconomic regimes. The 2009–2021 regime produced a set of properties — negative equity/bond correlation, suppressed volatility, TINA, compressed risk premia — that most portfolios internalized as constants. They were not. The regime emerging since 2022 is characterized by positive real rates that change the opportunity cost of capital, unstable correlation that makes diversification conditional, dispersion that restores the value of selection, and physical constraints that add a dimension absent from the previous regime. The relevant question is not “what to buy?” but “in which regime does the portfolio operate, what are the regime’s vulnerabilities, and how does the portfolio architecture absorb them?”. A solid strategy does not seek to beat the market — it structures the portfolio to survive what it cannot anticipate.