
Portfolio Risk Management: Survival First, Performance Second
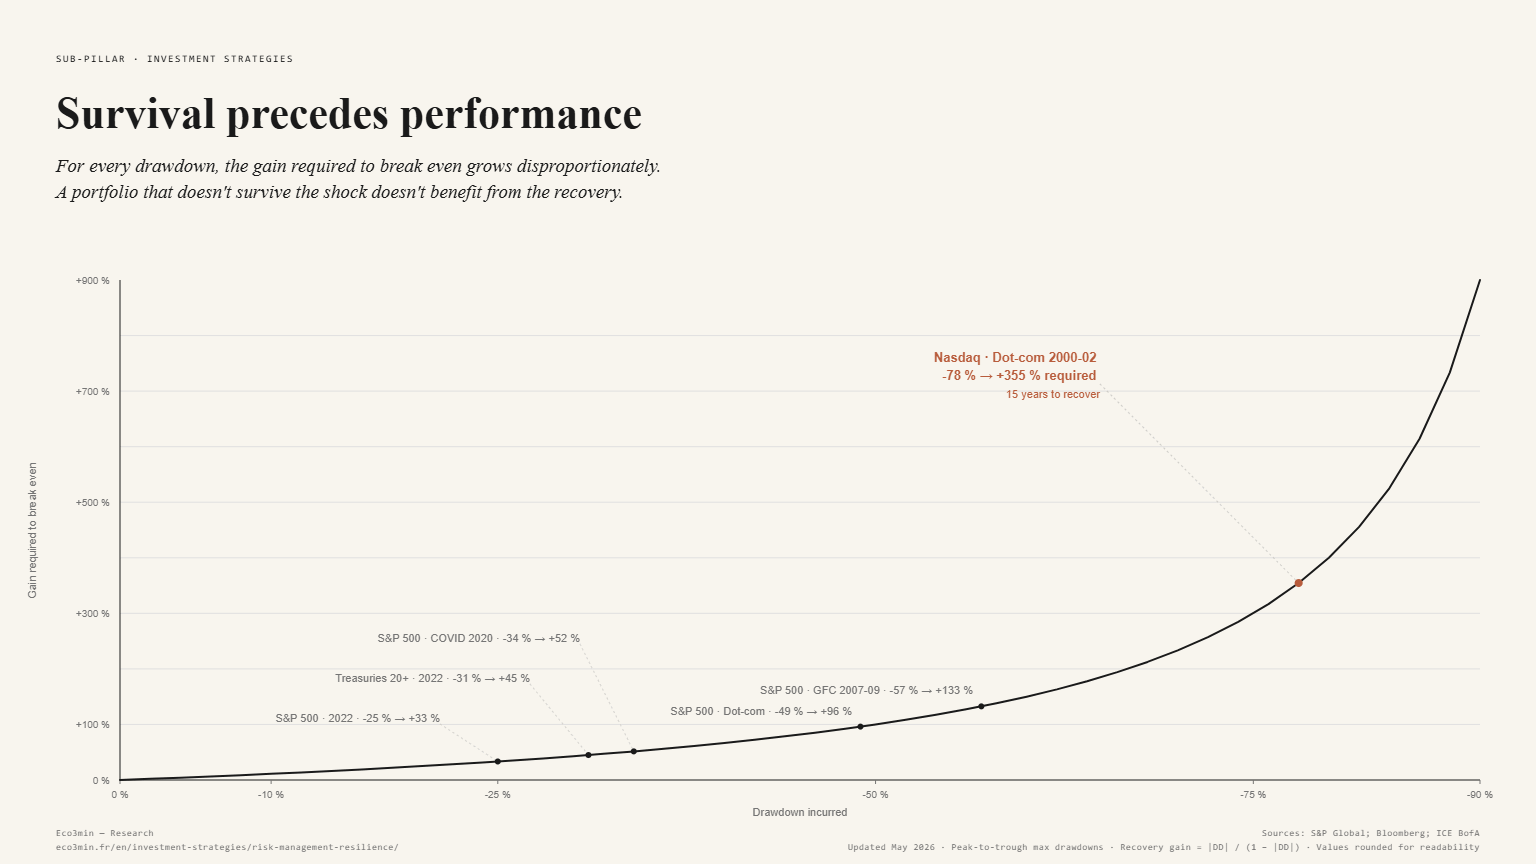
Survival precedes performance — the sequence of returns, not the average return, determines the real outcome. A portfolio that doesn’t survive the shock doesn’t benefit from the recovery.
This page extends the analysis of the pillar Investment Strategies. It formalizes Eco3min’s risk management framework: survival precedes performance. The sub-pillar Allocation Foundations covers the portfolio’s structural architecture; the sub-pillar Reading the cycle covers cyclical diagnostics. This one addresses what determines whether a portfolio survives shocks — or not.
Survival precedes performance. A portfolio that loses 50% must gain 100% to break even — that’s the arithmetic of losses, irreversible and unforgiving. A portfolio that loses 75% must gain 300%. 20+ year Treasuries lost 31% in 2022 (ICE BofA) — the worst bond performance since the 1780s (Deutsche Bank). Surviving such drawdowns without abandoning the allocation framework is the discipline question covered in our reference piece on investment discipline and long-term performance. The Nasdaq fell 78% between 2000 and 2002 and did not recover its peak until 2015 — fifteen years later (Bloomberg). The ARK Innovation ETF fell 75% between 2021 and 2022 (Bloomberg). Risk management is not a drag on performance — it is its condition of possibility. A portfolio that does not survive the shock does not benefit from the recovery. Average return is an abstraction — it is the sequence of returns that determines the real outcome.
This sub-pillar formalizes dimensions of risk that cannot be reduced to volatility: the distinction between fluctuation and permanent loss, conditional correlations that invalidate diversification in crises, leverage and liquidity risks that turn temporary drawdowns into permanent destruction, and position sizing as a survival discipline. The approach is non-prescriptive — it does not promise total protection (an illusion), but makes explicit the vulnerabilities standard models underestimate.
Volatility and risk: two concepts the industry confuses
Volatility measures the magnitude of price fluctuations — it does not measure risk. The VIX — the “fear index” — captures 30-day uncertainty on the S&P 500 (CBOE). A VIX at 12 in 2017 did not mean risk was low — it meant the market did not expect large moves over the next 30 days. The VIX jumped from 12 to 37 in two weeks during the February 2018 Volmageddon (CBOE), then from 14 to 82 in March 2020 (CBOE). As reported in the Cboe daily VIX history. Volatility can be low the day before a crash — it does not measure structural risk, only perceived short-term uncertainty.
The risk relevant to investors is permanent capital loss — losses you do not recover from, either because they force liquidation (margin calls, liquidity needs), destroy the psychological capacity to stay invested, or because the asset never returns to its prior level. A 100% 20+ year Treasury portfolio has historical volatility of 15% (Bloomberg) — “moderate” by industry standards — yet it lost 31% in 2022 (ICE BofA). A 100% money market portfolio has zero volatility — yet it loses 100% of purchasing power over 35 years at 2% inflation. Volatility captures neither risk.
The second systematically underestimated risk is purchasing power destruction — negative real returns over the investment horizon. Real yields on 10-year Treasuries were negative for most of 2011–2021 (TIPS yield, Federal Reserve), reaching −1.19% in August 2021. The “prudent” investor holding bonds preserved nominal capital while destroying real capital. The distinction is developed in our article on the risk–return tradeoff.
Dominant risk shifts with the regime
Risk is not a fixed concept — the dominant risk changes with the macroeconomic regime. A portfolio properly protected in one regime becomes vulnerable in another. Identifying the regime’s dominant risk is the first task of risk management — before any hedging or sizing decisions.
In a negative real rate regime (2009–2021)
The dominant risk was the risk of not being invested. Cash destroyed purchasing power (negative real return). Bonds yielded little. The opportunity cost of prudence was high — staying in cash or bonds while the S&P 500 delivered 16% annually between 2010 and 2021 (S&P Global) meant massive real loss. “Conservative” portfolios structurally underperformed. Temporary drawdown risk was systematically cushioned by central banks — every correction was followed by a V-shaped recovery (2011, 2015, 2018, March 2020). Optimal allocation was straightforward: maximum exposure to risky assets, underweight cash. The regime rewarded risk-taking and punished prudence.
In a positive real rate regime (2022– )
The dominant risk shifts toward permanent capital loss. Cash yielding 5.25% (T-bills, Federal Reserve) and TIPS at +2.40% (Federal Reserve) provide a positive real return floor with no risk. The opportunity cost of prudence is low — cash pays. By contrast, any allocation to risky assets must justify expected returns above this floor. The S&P 500 forward P/E at 21x implies an earnings yield of ~4.8%, an equity risk premium of only 2.8% (Damodaran, NYU) — versus a historical average of 4.5–5%. Markets are modestly compensating equity risk.
The regime now punishes complacency more than prudence. Central banks no longer act as systematic insurers — the Fed explicitly tolerated a 25% S&P 500 drawdown in 2022 without intervening. High-yield defaults rose from 1.0% to 3.9% (Moody’s). Bankruptcies reached 642 in 2023 (S&P Global MI). Capital once again has a cost — and strategies built on the assumption it was free are the most vulnerable. The rate regime shift and its implications are developed in the Monetary Policy and Rates pillar.
Conditional correlations: diversification questioned
Diversification assumes portfolio assets do not respond identically to shocks — combined, they produce lower risk than the sum of individual risks. This point is developed in commodities in drawdowns since 1970. This is the foundation of modern portfolio theory (Markowitz, 1952). Empirical observation reveals a structural asymmetry: asset correlations increase precisely when diversification is most needed — during crises.
In March 2020, during the 48 hours of peak panic (March 12–13), equities, bonds, gold, commodities, and credit all fell simultaneously (Bloomberg). Effective cross-asset correlation converged toward 1 — temporarily eliminating diversification benefits. The structural drivers behind such correlation regime shifts are detailed in the sub-pillar on asset class correlations and regime shifts. Only short Treasuries and cash held up. Mechanisms converge: forced liquidations (funds facing redemptions sell everything, not just losers), margin calls (immediate cash needs override allocation logic), liquidity contagion (markets linked via dealer balance sheets that shrink simultaneously).
The most structurally important case is conditional stock/bond correlation — dependent on the inflation regime, as documented in the sub-pillar Allocation Foundations. Low inflation → negative correlation (bonds hedge). High inflation → positive correlation (bonds amplify losses). The mechanics of these regime transitions are detailed in the complete guide to inflation. The 60/40 portfolio — and any strategy relying on bonds as insurance — is an implicit inflation regime bet. In 2022: positive correlation, S&P −19%, 20+ year Treasuries −31%. Insurance failed.
Do bonds protect the portfolio when equities crash?
Stock / bond correlation · by inflation regimeThe 60/40 is not a portfolio diversified in all conditions — it is an implicit bet on the inflation regime. The realised behaviour behind that bet is set out by regime in the matrix of how asset classes performed under each regime. An empirical observation, not a guarantee for the future.
Evaluating portfolio diversification using long-term average correlations. An average 0.3 correlation between equities and bonds may mask crisis episodes at 0.9 and calm periods at −0.2. The diversification that matters is conditional diversification — what holds in the current regime, not what appears in a 40-year backtest. The article on investment strategy limits analyzes conditions under which these breakdowns occur.
Tail risks: what standard models fail to see
Standard risk models — Value-at-Risk, mean-variance optimization — assume returns follow a Gaussian distribution where extreme events are exponentially unlikely. Market observation shows distribution tails are far fatter than expected — crashes of −20% or worse occur 10 to 100 times more frequently than predicted by normal distribution theory (Mandelbrot, 1963; Taleb, 2007).
The S&P 500 fell more than 30% in 2000–2002 (−49%), 2007–2009 (−57%), and March 2020 (−34%) (S&P Global). WTI briefly traded at −$37.63 in April 2020 (NYMEX) — an event Gaussian models treat as essentially impossible (>25 standard deviations). European TTF natural gas rose 17-fold in 2022 (ICE). The Swiss franc appreciated 30% within minutes in January 2015 when the SNB abandoned its floor (Bloomberg). The VIX hit 82 in March 2020 and 65 in August 2024 (CBOE).
Tail-risk hedging strategies — put buying, structural gold or commodity allocation, Barbell strategy (developed in the sub-pillar Allocation Foundations) — carry a structural cost in normal times (the “insurance premium”). That cost is the price of convexity — the portfolio’s ability to limit losses in shocks while preserving upside exposure. Gold rose from $1,060 in 2015 to above $2,400 in 2024 (LBMA), supported by record central bank purchases (1,037 tons in 2023, 1,045 tons in 2024, WGC) — showing structural hedges can also deliver positive returns when the regime favors them.
Leverage: the mechanism that turns temporary drawdowns into permanent losses
Leverage amplifies returns — both upside and downside. Beyond this symmetric arithmetic, leverage introduces three asymmetric risks that convert temporary drawdowns into permanent losses.
Forced liquidation
Margin calls force selling at the worst time — prices lowest, cash needs highest. In March 2020 they triggered massive forced selling (intraday swings of 8–10% on the S&P 500 across several consecutive sessions, Bloomberg). The mechanism self-reinforces: sales push prices down, triggering fresh calls — the “liquidity spiral” documented by Brunnermeier and Pedersen (2009).
Funding
Credit tightens precisely when refinancing needs peak — IG spreads widened from 90 to 200 bps within days in March 2020 (Bloomberg). Leverage costs rise as the portfolio loses value. In a positive real rate regime, the base cost (>5% in T-bills, Federal Reserve) is structurally higher than in 2009–2021 (near 0%).
Implicit leverage
Leverage that only surfaces in crises. Risk Parity runs 2–3x on the bond sleeve — destructive when bonds drop 31%. Short VIX: the XIV ETF lost 96% in a single session (2018 Volmageddon, Bloomberg). “Capital-guaranteed” funds often hide negative convexity. The full reading is available in what the guarantee misses in real terms.
Investing without strategy →Concentration risk: the current regime’s key vulnerability
Concentration risk is the defining vulnerability of the current regime — amplified by passive management and cap-weighted index structures.
The top 10 market caps represent more than 35% of the S&P 500 (S&P Global). The Magnificent 7 accounted for more than 60% of the S&P 500’s gains in 2023 (S&P Global). An investor holding an S&P 500 ETF effectively owns a portfolio where one-third depends on seven tech companies — that is not diversification, it is disguised concentration.Passive management reinforces the effect: inflows into cap-weighted ETFs mechanically buy more of already overweight stocks — creating a self-reinforcing loop. Apple’s market cap exceeds the GDP of most G20 countries. A valuation shock to tech — regulatory tightening, multiple compression, AI narrative reversal — would affect virtually all indexed portfolios, representing roughly 50% of US equity assets under management (ICI). Concentration risk is the concrete manifestation of the shift toward a high-dispersion regime documented in the Equities and ETFs pillar.
Position sizing: the invisible discipline
Position sizing is the most neglected and most decisive parameter of risk management. Being right on direction is irrelevant if the position is too large (unbearable loss if wrong) or too small (negligible portfolio impact). Empirical studies show sizing explains a significant share of performance differences among investors with identical market views (Thorp, 2006).
The core principle is simple: size each position so the maximum error does not threaten portfolio survival. If a position can lose 50% and represents 20% of the portfolio, the drawdown is 10% — manageable. If it represents 50%, the drawdown is 25% — potentially fatal (requires +33% to break even). Approaches vary: equal weighting (same weight per position), risk parity (same risk contribution), modular conviction (weight proportional to certainty). All share a common logic — integrate the possibility of error ex ante into sizing. In-depth analysis is developed in our study on position sizing.
Survival precedes performance — and the sequence of returns determines real outcomes, not the average return. The relevant risk is not daily volatility but permanent capital loss and purchasing power destruction. Dominant risk shifts with the regime: in negative real rates (2009–2021), the main risk was not being invested; in positive real rates (2022– ), the main risk is capital loss when cash yields 5% risk-free. Correlations are conditional — diversification that holds in normal times can collapse in crises, and stock/bond correlation depends on the inflation regime. Leverage turns temporary drawdowns into permanent losses via margin calls, liquidity spirals, and hidden leverage. Cap-weighted index concentration is the defining vulnerability of the current regime. Position sizing — calibrating each position so the maximum error does not threaten survival — is the invisible discipline separating portfolios that endure crises from those that do not. More on this: our comparison of historical crises.
Further reading
Risk–return tradeoff — Understanding the equation between expected return and loss exposure.
Position sizing — The discrete parameter of portfolio returns.
Limits of investment strategies — Correlation breakdowns and failure conditions.
Investing without strategy — Consequences of unidentified exposures.
← Back to Investment Strategies
Last updated — 26 August 2026
Disclaimer – Financial Information: The analyses, commentary, and content published on eco3min.fr are provided for informational and educational purposes only. They do not constitute investment advice or a solicitation to buy or sell financial instruments. Past performance is not indicative of future results. All investment decisions involve risk and are the sole responsibility of the reader.
Read next
Full pillar →Investment Discipline and Long-Term Portfolio Performance
Long-term portfolio performance is not driven by stock selection or market timing. It is driven by decision discipline…
Choosing investments in the light of the macro cycle
An investment's performance owes less to its own features than to its interaction with the prevailing macro regime:…
Reading the Economic Cycle: Aligning Portfolio Exposure with Market Regimes
Annual total returns of the S&P 500 and the ICE BofA US Treasury 20+ Year Index in 2008…