Inverted Yield Curve in 2026 : Why De-Inversion Is the Real Risk
The persistent inversion of the U.S. yield curve calls the consensus soft-landing scenario into question. A breakdown of the signals to watch and the allocation strategies to favor.
TL;DR: (1) Despite the start of the monetary easing cycle, the U.S. yield curve remains inverted as 2026 approaches. (2) Markets are heavily pricing in a “soft landing” and a gradual normalization. (3) Yet history shows that the de-inversion phase is precisely where the risks become concentrated. (4) Stress is gradually shifting from equities to credit and highly leveraged real estate. (5) There is still room to reposition portfolios, but that window is narrowing fast.
This analysis provides a rigorous macroeconomic framework for the inverted yield curve, placing it in a historical, monetary, and financial context.
The goal is to go beyond the reflexive “inversion = imminent recession” narrative and instead decode the transmission channels of risk toward credit markets, real estate, and private-sector balance sheets, without pretending to offer a short-term market-timing signal.
A phenomenon is currently flying under the radar: by late 2025, the U.S. yield curve still shows a partial inversion between the 2-year and 10-year maturities, even though the Federal Reserve has already begun cutting the Fed Funds rate since September. This disconnect between the bond market’s message and the dominant soft-landing narrative calls for a deeper analysis.
To avoid a reductive reading, it is important to recall what a yield curve actually synthesizes. It does not describe the economy’s instantaneous condition, but rather how the bond market ranks risk, time, and monetary-policy expectations across the cycle. This intertemporal dimension is exactly what makes its message so difficult to reconcile with dominant macro narratives.
This anomaly is largely explained by one variable the consensus still struggles to fully incorporate: the level of real policy rates. Once inflation declines faster than nominal rates are cut, monetary policy remains restrictive in real terms, putting persistent pressure on the short end of the curve and delaying any return to a “normal” configuration.
U.S. yield curve: the illusion of de-inversion
Historically, the riskiest phase is not the inversion itself, but the rapid de-inversion, when short-term rates fall faster than long-term rates.
⚠️ Critical zone: the spread returning toward zero after a prolonged inversion.
An inversion that keeps going against expectations
As of late November 2025, the yield spread between the 2-year and 10-year Treasury remains around -40 to -60 basis points, after having fallen below -100 basis points during the summer of 2023, according to Federal Reserve data.
The consensus under pressure: the weaknesses of the base case
A broad segment of the market is betting on an orderly exit from this inverted configuration: gradual monetary easing in 2026, a progressive return to a mildly positive slope, and growth that remains sluggish but still positive.
Our reading differs on one fundamental point: the main risk is not a sharp recession, but a disorderly de-inversion.
- The position within the macro cycle over a 6–24 month horizon
- The assessment of credit risk and highly leveraged assets
- The ranking of vulnerabilities across equities, bonds, and real estate
What it does not allow you to determine
- The exact timing of market peaks or troughs
- The precise date when a recession begins
- A short-term tactical allocation strategy
A review of past cycles shows that:
- in most cases, the recession begins after the curve starts to re-steepen (the return to a positive slope),
- this re-steepening can result either from a collapse in short-term rates (when the central bank cuts rates aggressively), from a surge in long-term rates (higher risk premium, distrust of sovereign debt), or from a combination of both.
In other words, the moment the curve returns to a “normal” configuration often coincides with the period when the macro environment becomes most dangerous for portfolios. If this dynamic is confirmed, equity markets may appear resilient on the surface just before credit spreads and certain fixed-income segments begin to tighten sharply.
From macro to micro: mapping the 2025–2026 risks
On the macroeconomic side, three forces are converging:
- Sluggish growth: real GDP hovers around 1–1.5% on average in developed economies in 2025, according to aggregated estimates from international institutions.
- Contained but resilient inflation: core inflation is running between 2% and 3% by late 2025, with the risk of rebounding above 3% if wage pressures or an energy shock materialize.
- Debt at critical levels: public debt exceeds 100% of GDP in several major economies, while pockets of corporate debt were built at zero rates between 2015 and 2021.
This macro shift is now visible in corporate earnings releases. Earnings surprises show a widening gap between companies able to absorb a higher cost of capital and those whose margins or leverage are deteriorating rapidly. These microeconomic signals are usually what precede the visible widening of credit spreads.
At the microeconomic level, the symptoms are already tangible:
- corporate refinancing deals carrying coupons 150 to 300 basis points above 2019 levels, based on market conditions observed in credit markets since 2024,
- listed real estate companies and commercial property players facing a doubling or even tripling of financing costs in some segments,
- LBO structures and private equity vehicles from the 2018–2021 vintages whose business plans, built on the assumption of permanently low rates, are now being invalidated.
The conclusion is clear: what matters in 2025–2026 is not so much the absolute level of policy rates (4% or 3.5%) as the speed at which public and private balance sheets adjust. A slow but relentless shift is already underway: each year, a growing share of debt is refinanced at the new rate regime, eroding margins and financial flexibility.
The real question investors are asking
The central issue is not so much the predictive power of the inverted curve as whether it still makes sense to take duration or credit risk at this stage of the cycle. Behind that technical question lies a legitimate concern: being caught off guard when the curve abruptly re-steepens, whether because of a loss of confidence in bond markets or a rate-cut cycle triggered by an unexpected recession.
Classic traps in interpreting the curve
- Using the curve as an equity timing tool: historically, the yield curve signals the macro position within the cycle, not the optimal entry point for equities. Concluding “inverted curve = sell stocks immediately” is a misunderstanding; equity markets can keep rising for several quarters.
- Ignoring other maturity segments: focusing exclusively on the 2–10 year spread while ignoring the 3-month–2-year segment is reductive. The spread between short-term rates and Fed Funds is a key indicator for anticipating the pace of monetary easing.
- Underestimating the term premium: believing that a normalization of the curve will automatically bring conditions back to the pre-2020 world is unrealistic, given that the structural term premium can reset durably higher under the weight of massive public debt.
This misreading is especially common in long-duration growth themes. When the curve is inverted and real rates remain elevated, assets whose valuation rests on very distant cash flows become mechanically more vulnerable. The analysis of AI thematic ETFs, their flows, and their valuations illustrates how this regime shift widens the gap between the technology narrative and actual value creation.
Macro risk materializes during de-inversion, when monetary easing transfers stress from equity markets to credit and highly leveraged balance sheets.
Three scenarios for 2026: probabilities and implications
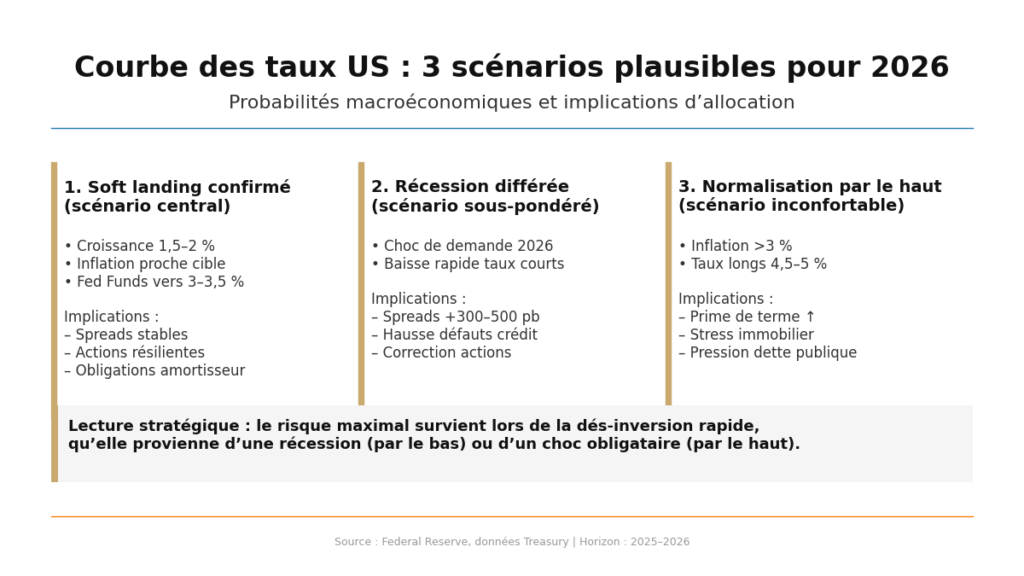
1. Soft landing confirmed (base case)
Working assumption: U.S. growth between 1.5% and 2% in 2026, inflation near the 2% target, Fed Funds reduced toward 3–3.5% by year-end. The curve re-steepens gradually through a moderate decline in short rates and a slight rise in long rates.
Expected implications:
- investment-grade credit spreads remain broadly stable,
- equity valuations remain justified, but upside is limited,
- long-dated sovereign bonds regain their role as volatility absorbers.
This scenario is not catastrophic, but it is already largely priced into many asset classes.
2. Delayed recession (scenario underpriced by the market)
Working assumption: a demand shock in 2026 (higher unemployment, weaker consumption), with growth falling back to zero or slightly negative territory in several economies. The Fed is forced to accelerate easing toward 2–2.5%.
Mechanism: the curve re-steepens from the short end (a collapse in short rates). Long bonds post strong performance, but:
- high-yield spreads widen by 300 to 500 basis points,
- default rates surge in high-leverage sectors (real estate, discretionary consumption, some unprofitable tech stocks),
- equity indices correct more sharply than the consensus expects.
This is not the base case today, but it deserves a meaningful probability because the market only partially prices it in.
3. Higher-rate normalization (the uncomfortable scenario)
Working assumption: a resurgence of inflation above 3%, persistent wage pressures, and rising fiscal strain. Long rates move back toward 4.5–5% while short rates decline only marginally.
In this configuration, the curve regains a positive slope, but:
- interest expenses on public debt explode,
- risk premiums rise across all long-duration assets,
- residential and commercial real estate markets face another wave of stress.
This is a diffuse but growing risk, closely watched by institutional investors most exposed to duration.
Important caveat: these three scenarios assume a broadly predictable central bank. A more restrictive monetary policy than expected, for example if core inflation were to rebound above 3.5%, could keep short rates high for longer, delay normalization of the curve, and invalidate an early repositioning toward long duration.
Operational recommendations for investors
1. An allocation structure to consider: for a diversified profile exposed to the dollar area, a 40/40/20 split can be a relevant starting point:
- approximately 40% in international equities (with a bias toward strong balance sheets and cash-flow-generating companies),
- approximately 40% in high-quality bonds (intermediate duration, avoiding extremes — very long or ultra-short),
- approximately 20% in flexibility pockets and cash (money market funds, T-bills, hedging strategies).
2. Treat duration as a tactical variable: favor a gradual increase in exposure to 7–10 year bonds rather than a sudden shift into 30-year maturities. Concretely, move 5 to 10% of the bond portfolio each quarter into longer maturities as long as the curve remains inverted.
3. Hedge credit risk, not just equity beta: for portfolios exposed to high yield or bank subordinated debt, consider partial hedges via credit derivatives or mechanically reduce exposure by 20 to 30% in the most cyclical segments.
Indicators to watch for timing calibration
Key metrics to monitor regularly:
- 2-year / 10-year spread: watch closely for a sustained move from the -50/-30 basis point zone toward 0 and then +50 basis points. A rapid re-steepening is often a more worrying warning signal than the inversion itself.
- 3-month rate – effective Fed Funds spread: if it turns clearly negative, the market is pricing rapid policy-rate cuts, usually in response to an economic shock.
- High-yield credit spreads: a sustained move above the ≈500 basis point threshold versus sovereigns signals that stress is spreading beyond the rates market alone.
- Corporate default rate on a 12-month rolling basis: a move above 5–6% in the riskiest segments would be consistent with a delayed-recession scenario.
Frequently asked questions about the inverted yield curve
- Does an inverted curve mean it is too late to position in long bonds?Not necessarily. Historically, a significant share of bond performance materializes precisely during the re-steepening phase, when central banks begin easing. The risk, however, lies in entering too heavily at the very long end while long rates may still experience volatility.
- Should investors get out of equities entirely when the curve is inverted?No, a full exit from equities is rarely optimal. The better approach is to favor companies with strong balance sheets, sectors less sensitive to the credit cycle, and to accept lower beta during the adjustment period.
- Does the yield curve still matter as an indicator after 2020?The structure of markets has changed, but the core message remains valid: a prolonged inversion reflects a mismatch between monetary conditions and the economy’s ability to absorb them. It is prudent to treat it as a warning signal, even if the exact timing remains uncertain.
- How should an SME interpret this signal?For a company, the main lesson is not to keep postponing refinancing. A persistent inverted curve means short rates remain elevated; if recession arrives, banks may tighten lending standards, making financing access less certain.
- Does inversion have a direct impact on residential real estate?Indirectly, yes: it reflects the high level of short- and medium-term mortgage rates relative to what the economy can absorb. If recession later materializes, transactions can stall, prices can adjust, and the most fragile borrowers can run into trouble.
Differentiated implications by profile
For investors, the current apparent equilibrium masks real fragilities. The inverted yield curve is a reminder that the growth/inflation combination remains unstable. Portfolios that are excessively concentrated (100% equities, all tech, or 100% cash) face asymmetric risk. Duration diversification and active credit-risk management become strategic imperatives.
For companies, the priority is to secure medium-term funding while markets remain open, even if that means accepting a higher cost. Waiting for a hypothetical return to 2019 rate conditions is probably an illusion; the challenge is to extend maturities before the next stress phase closes the window of opportunity.
For individuals, the key is not to passively absorb monetary policy through poorly calibrated debt: avoid overleveraging at variable rates, keep a precautionary cash reserve, and do not base a real-estate project on the assumption that rates will automatically fall within twelve months.
Several paths remain plausible: a prolonged soft landing, a delayed recession, or normalization through a higher-rate regime. The inverted yield curve does not provide an exact date, but it does signal that a silent reallocation is underway behind the scenes. This risk is less visible than others, which is precisely why it is so easy to ignore — and that is exactly why it should be taken seriously in the next few quarters’ investment and financing decisions.
3 formulas to remember
- “An inverted curve does not kill equity markets immediately, but it almost always ends up testing credit.”
- “The real danger is not inversion itself, but the way the curve re-steepens: from the top (bond-market stress) or from the bottom (recession).”
- “In 2025, the strategic question is no longer ‘where will rates be?’ but ‘which balance sheets will withstand a world of persistently higher rates?’”
Last updated — 2 April 2026
This article provides economic and financial analysis for informational purposes only. It does not constitute investment advice or a personalized recommendation. Any investment decision remains the sole responsibility of the reader.