Conditional Liquidity: How Automation Amplifies Market Fragility

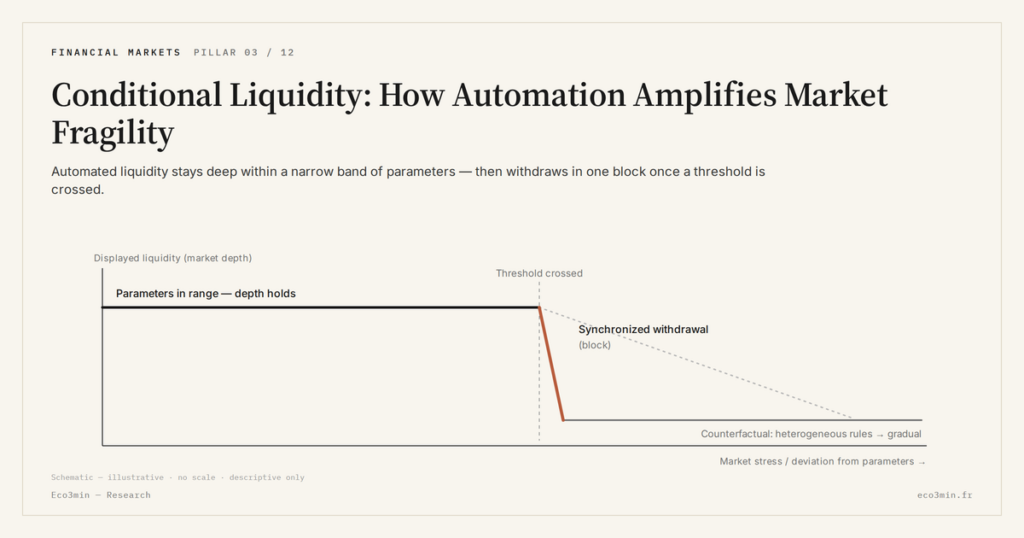
Automation makes liquidity more conditional and accelerates the propagation of financial shocks.
TL;DR
Automated systems reassess exposure instantly and withdraw liquidity in sync once technical thresholds break, turning moderate shocks into sudden gaps that calm-market depth conceals.
- Between 2023 and 2025, several intraday stress episodes showed spreads widening within seconds while daily volumes stayed elevated, so displayed depth diverged from actual shock-absorption capacity.
- During the 2022–2024 tightening cycle, higher capital costs and lower risk tolerance made spreads widen faster than in prior cycles, as exposure rules tightened simultaneously rather than for lack of participants.
- The gap between traded volumes and effective order-book depth during stress, plus the speed at which books rebuild afterward, are named as gauges of conditional liquidity.
Liquidity is often perceived as abundant as long as markets function normally. In an automated environment, it becomes more conditional and more sensitive to shocks. Withdrawals can synchronize rapidly, amplifying threshold effects. A naïve reading equates automation with permanent fluidity. Understanding this mechanism helps explain the speed of modern liquidity crises. More on this: Why Automation Makes Finance Harder to Supervise.
Liquidity exists… until the moment it disappears
Across many market segments, observable liquidity now relies on automated mechanisms for providing and withdrawing counterparty flows. As long as parameters remain within narrow ranges—contained volatility, deep order books, balanced flows—depth appears stable. This stability is conditional: it depends on execution rules that adjust simultaneously once thresholds are breached.
Between 2023 and 2025, several intraday stress episodes showed price spreads widening within seconds, even as daily volumes remained elevated. This disconnect suggests that displayed liquidity is not equivalent to shock absorption capacity. It exists only as long as algorithms assess risk as manageable.
The implicit consensus: automation improves market fluidity
Part of the consensus holds that automation enhances liquidity by reducing transaction costs and increasing the number of participants. The central scenario assumes that this density of orders absorbs shocks and limits disruptions.
The divergence lies in the dominant mechanism: synchronization. When similar strategies react to the same signals—instantaneous volatility, micro price changes, risk constraints—withdrawals occur simultaneously. Liquidity contracts precisely when it is most needed. The issue is not a lack of orders in normal conditions, but homogeneity of rules under stress.
This phenomenon is inseparable from the compression of reaction times, which transforms gradual adjustments into near-instant withdrawals once technical thresholds are crossed.
This point fits into the broader framework outlined in the analysis of financial transformation driven by AI and structural risk, where the interaction between speed, automation, and aggregated behavior creates endogenous fragilities.
Key mechanism: conditional liquidity provision
Unlike a human market maker, an automated system does not “stay” during periods of stress: it instantly reassesses its exposure. Liquidity provision is therefore conditioned on internal metrics—realized volatility, flow correlation, intraday drawdowns—that can shift abruptly.
During the 2022–2024 tightening cycle, higher capital costs and reduced risk tolerance amplified these mechanisms. Spreads widened faster than in previous cycles, not due to a lack of participants, but because exposure rules tightened simultaneously. Synchronized withdrawals turned moderate shocks into fragile liquidity episodes. It is that simultaneity, and not the speed itself, that defines the liquidity that high-frequency market making withdraws under stress.
Why this issue is becoming more relevant now
The current environment combines structurally higher rates, more intermittent volatility, and gradual regulatory normalization. This configuration increases the probability of technical thresholds being breached, making liquidity more intermittent. The gap between apparent and effective liquidity is becoming more visible.
What the reader is really trying to understand
The real question is not whether markets are liquid on average, but whether that liquidity holds when conditions deteriorate rapidly. Behind this lies a simple concern: the market’s actual ability to absorb imbalanced flows without discontinuity.
Counterarguments and tipping variables
Some argue that improved risk models and more frequent stress testing will stabilize liquidity provision. This scenario assumes that exposure rules will remain heterogeneous. A uniform regulatory tightening, an unexpected demand shock, or persistent volatility could instead reinforce synchronization and invalidate this view. Background: Why AI Displaces Biases Instead of Eliminating Them.
Indicators to monitor liquidity dynamics
A relevant indicator is the gap between traded volumes and effective order book depth during stress periods. Rising volumes alongside rapidly widening spreads signal conditional liquidity. The speed at which order books rebuild after a shock is also a key KPI to assess resilience.
Equating high liquidity in calm conditions with shock absorption capacity: the former can mask fragility driven by synchronized withdrawals.
This does not imply a permanent disappearance of liquidity, but rather a transformation in its nature. Placing these mechanisms within a broader framework of financial innovation helps explain why liquidity is becoming more intermittent. It is not the central scenario today, but the risk is less visible than others—and therefore easier to ignore.
Last updated — 23 July 2026
Disclaimer – Financial Information: The analyses, commentary, and content published on eco3min.fr are provided for informational and educational purposes only. They do not constitute investment advice or a solicitation to buy or sell financial instruments. Past performance is not indicative of future results. All investment decisions involve risk and are the sole responsibility of the reader.
Read next
Full pillar →Euro Below Parity in 2022: What Parity Means
In September 2022, the euro fell below parity with the dollar, to around 0.95, a low not seen…
Eurozone Fragmentation: Sovereign Spreads and the Euro
The euro is issued by a monetary union without a complete fiscal union: nineteen sovereign debts coexist under…
The Euro’s Energy Import Bill: the Gas Shock and the Currency
In 2022, the surge in gas prices turned the euro area's historic current-account surplus into a deficit and…