Market Rotation 2026: Capital Flows, Sector Shifts, and Hidden Signals

The apparent stability of markets is masking a deep reallocation of capital flows. Behind indices near their highs, sector leadership is shifting: consolidation among AI-driven mega caps, early cyclical recovery attempts, the strategic return of bonds, and persistent volatility in digital assets.
TL;DR
Equity indices have held near their highs since early December 2026, but on narrow breadth, as capital reallocates across styles, bonds and crypto beneath flat headline levels.
- Performance is concentrated in a limited number of large caps while many mid and small caps lag, raising the indices' downside sensitivity to a handful of names.
- Sovereign yields sit sustainably above 2010s levels, keeping flows into bond ETFs and investment-grade funds elevated, while Bitcoin and major altcoins swing +5% to +12% over short windows before profit-taking.
- Named lower-profile gauges include flows into non-tech sector ETFs (industrials, healthcare, infrastructure), demand for long-dated protection despite low short-term volatility, and BBB credit spreads as a leading stress signal.
Reading markets solely through index levels leads to underestimating the most actionable signals. Capital shifts across styles, asset classes, and risk profiles provide a richer understanding of the financial cycle. The specifics are documented in our deep dive into regime-driven correlation breakdowns. For both retail investors and asset allocators, the key challenge in 2026 is identifying these internal rotations to adjust exposure without relying on a single directional scenario.
Since early December 2026, financial markets have displayed surface-level stability. Major indices remain near their highs, yet internal dynamics diverge significantly. Some mega-cap technology stocks driven by the AI theme are entering a consolidation phase after several quarters of outperformance. Meanwhile, cyclical segments—industrials, energy, value stocks—are attempting to catch up as macroeconomic expectations stabilize. The mapping of the rate-hikes-yet-resilient-markets puzzle situates this within the wider regime. In fixed income, the return of yield is restoring sovereign bonds and credit as strategic allocation tools after years of constrained carry. Crypto-assets continue to alternate between sharp rallies and corrections, reflecting a positioning still largely speculative. Worth reading alongside: Our study on sector rotation and style regimes between value and growth.
The current environment therefore requires a deeper reading: beyond index levels, it is capital flows, allocation shifts, and performance dispersion that define the market regime. The figures are laid out in how sectors rotate across the cycle.
Key dynamics to monitor this week
- Indices remain resilient, but concentration is high: major equity indices (US and Europe) are near their highs, but a significant portion of performance is driven by a limited number of large-cap stocks. Many mid and small caps are lagging or correcting. A market that appears strong, but with uneven breadth.
- Bonds confirm their strategic return: with sovereign yields sustainably above 2010s levels, flows into bond ETFs and investment-grade funds remain elevated. Conservative investors can now target attractive nominal returns without heavy equity exposure.
- Crypto markets alternate between momentum and consolidation: Bitcoin and major altcoins show +5% to +12% moves over short periods, often followed by rapid profit-taking. The medium-term trend remains constructive, but sensitivity to regulation and global liquidity remains high.
- Implied volatility remains contained but fragile: equity and FX volatility indices remain low despite a complex macro and geopolitical backdrop. This compression may reflect confidence—or an underestimation of latent risk.
Deep reading: what markets are really signaling
The equity market shows resilience, but flows point to growing caution and increased selectivity.
This intensification of sector rotations cannot be understood through aggregate performance alone. It reflects a broader reallocation of capital, a re-ranking of risk, and the structural return of the cost of capital—key features of the current regime. This cross-asset perspective is developed in the pillar page financial markets.
1. Persistent concentration of performance
When a few large companies linked to AI, semiconductors, or digital services continue to dominate indices:
- Investors favor business models perceived as resilient and profitable.
- The majority of companies face more cautious expectations for margins and 2027 growth.
- Index dependence on a limited number of stocks increases downside sensitivity.
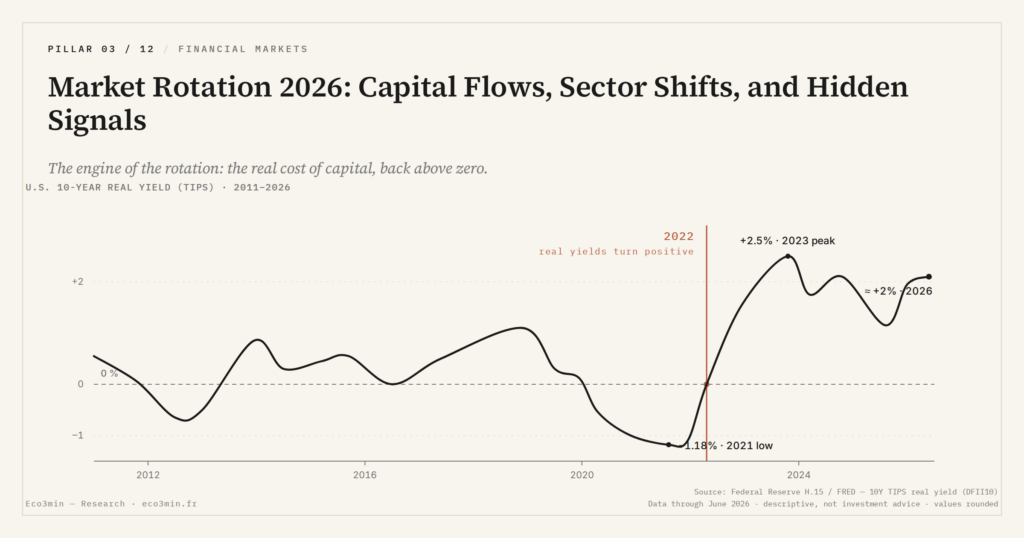
2. Bonds: the return of real yield
The bond market is re-establishing itself as a core allocation pillar:
- Real yields remain broadly positive, reshaping strategic allocation decisions.
- Long-term investors can once again generate meaningful returns without equity exposure.
- Signs of economic slowdown quickly trigger flows toward intermediate and long maturities.
3. Crypto: increasing integration into the macro cycle
Crypto-assets are increasingly behaving like liquidity-sensitive assets:
- Positive announcements are amplified by leverage and derivatives.
- Corrections are sharp but often followed by technical rebounds.
- Correlation with traditional risk assets rises during stress periods.
Concrete implications for investors, companies, and individuals
For retail investors
- Avoid excessive concentration in dominant themes. A structured allocation combines diversified equities, bonds, and cash.
- Consider investment-grade bond ETFs as a structured alternative to cash, within a risk-adjusted return framework.
- On crypto: size exposure appropriately for high volatility and favor gradual allocation over opportunistic entries at market peaks.
For listed companies
- Markets increasingly reward cash-flow generation and financial discipline over aggressive expansion plans.
- Margin visibility and capital allocation discipline are becoming key differentiators.
Under-the-radar indicators to monitor
- Flows into non-tech sector ETFs: industrials, healthcare, infrastructure—rotations often begin here.
- Demand for long-dated protection options despite low short-term volatility—signal of institutional hedging.
- BBB credit spreads: a leading indicator of financial stress in the intermediate risk segment.
Outlook: next 3 to 12 months
Base case: moderate global growth, gradually normalizing inflation, and cautious, data-dependent central banks.
- Equities may continue rising, but with more uneven and selective performance.
- Returns will depend more on risk management and diversification than broad multiple expansion.
- Bonds retain a dual role: income generation and potential price appreciation in a slowdown.
Alternative scenarios
- Inflation rebound: pressure on long-duration bonds, renewed interest in real assets.
- Stronger slowdown: bond rally, pressure on cyclical earnings, relative outperformance of defensive sectors.
Key indicators: yield curve dynamics, BBB credit spreads, volatility indices, and earnings revisions.
In summary: late-2026 financial markets are neither euphoric nor panicked. They operate in an unstable equilibrium between return and risk, within a regime where the cost of capital has regained central importance. The detail is worked through in the Eco3min framework on the dollar as a structural regime. Reading flows, analyzing dispersion, and integrating volatility as a structural feature remain essential for coherent portfolio management. Tomorrow’s winners may still change. A related answer: what frontier markets are and why they attract capital.
Last updated — 12 July 2026
Disclaimer – Financial Information: The analyses, commentary, and content published on eco3min.fr are provided for informational and educational purposes only. They do not constitute investment advice or a solicitation to buy or sell financial instruments. Past performance is not indicative of future results. All investment decisions involve risk and are the sole responsibility of the reader.
Read next
Full pillar →Reading Earnings Surprises: Cash Flow, Margins, Guidance
How to analyze an earnings surprise beyond the simple beat or miss: cash flow, margins, guidance, and weak…
Equal-Weight ETFs: The Quiet Signal Behind Rising Indices
Equal-weight ETFs reveal the true health of the equity market behind mega-cap-driven indices. Their gap with cap-weighted ETFs…
Smart Beta ETFs: The Hidden Risk Behind Factor Performance
Smart beta ETFs now hold ~15-20% of global equity ETF assets. Stacking factor exposures often rebuilds hidden concentration…