Market Regimes: Liquidity, Real Rates and Structural Financial Market Dynamics
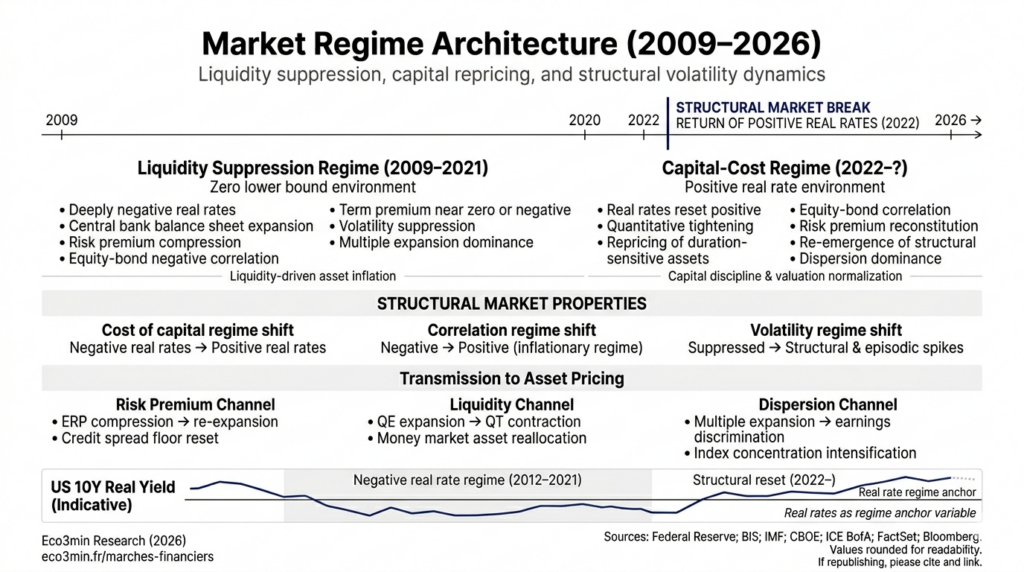
This infographic formalizes the shift from a regime of liquidity and negative real rates (2009–2021) to a regime with a positive cost of capital since 2022, and analyzes its effects on correlations, risk premia, dispersion and structural volatility.
Prices, expectations and capital flows: how macroeconomic and monetary regimes structure the dynamics of financial markets.
— Markets do not predict the future. They reflect the instantaneous balance between expectations, liquidity and structural constraints.
Financial markets are neither a casino nor an oracle. They are adaptive systems that continuously repricing at the intersection of three forces: investor expectations, the prevailing liquidity regime, and the structural constraints of the real economy. The question that structures this pillar is not “where are markets going?” — it is: which market regime are we in, what forces created it, and what are its properties?
To understand the core financial mechanisms behind market dynamics, from price formation to capital allocation, see our investing for beginners hub.
This question has become critical because the regime has changed. Between 2009 and 2021, financial markets operated in a historically unique environment: negative real rates, expanding central bank liquidity, volatility suppression and compressed risk premia. That regime produced an S&P 500 that rose sevenfold in twelve years, bonds that gained nearly uninterrupted value for decades, and a negative equity/bond correlation that underpinned the asset-management industry. Since 2022, each of those properties has reversed or weakened. Real rates have turned positive. Liquidity is contracting. Volatility is back. The equity/bond correlation flipped positive. The rules that governed markets for thirteen years no longer operate in their previous form.
This page is the central analytical framework from which all market dynamics on Eco3min are analyzed. It does not describe the mechanisms in detail — the sub-pillars do. It formalizes the reading grid that allows those mechanisms to be interpreted within their macroeconomic context. Expectations, correlations, flows, hidden stresses, microstructure, currencies and financial innovation are applications of this framework — not independent topics.
2009-2019: the liquidity regime — when central banks become the market
The market regime that emerged from the 2008 crisis was the direct product of the largest monetary intervention in history. The combined balance sheets of the four main central banks (Fed, ECB, BoJ, BoE) rose from $4 trillion at end-2007 to $16 trillion at end-2019 (BIS) — before the Covid shock. Policy rates remained near zero — even negative — throughout the decade. This monetary architecture produced a market regime with specific, measurable properties.
Risk premia suppression
The first structural effect was the systematic compression of risk premia to historically low levels. The equity risk premium on the S&P 500 — the expected excess return of equities over bonds — fell under 3% (Damodaran, NYU), versus a historical average of 4.5–5%. High-yield credit spreads touched 303 basis points in June 2021 (ICE BofA), among the lowest on record. The VIX closed below 12 for 52% of sessions in 2017 (CBOE), an all-time record. The Treasury term premium — compensation for holding duration — turned negative for the first time in history (Adrian, Crump & Moench, Fed NY).
This compression was not the reflection of a less risky world — it was a mechanical consequence of the zero-rate regime. When real rates are deeply negative, investors are forced to move up the risk spectrum to find positive yields — the “TINA” (There Is No Alternative). That forced flow compresses risk premia by simple supply-and-demand logic, independently of fundamentals.
Equity/bond decorrelation: the foundation of 60/40
The low-rate, low-inflation regime produced a negative correlation between equities and bonds — when stocks fell (recession fears), bonds rose (rate-cut expectations). This relationship, prevailing since the early 2000s, underpinned the 60/40 allocation and institutional management. In 2008, long-term Treasuries gained 33% (ICE BofA 20+) while the S&P 500 lost 37% — diversification worked. In March 2020 the same mechanism operated: Treasuries cushioned the S&P’s shock (-34%).
This property — negative equity/bond correlation — is not a natural law. It is produced by a specific environment: low inflation, credible and reactive central banks, and moderate real rates. Before the 2000s the correlation was mostly positive — in the 1970s and 1980s stocks and bonds fell together when inflation rose. Correlation regime depends on the macro regime — as 2022 demonstrated harshly.
Performance: exceptional but structurally fragile
This regime produced historically exceptional returns. The S&P 500 rose from 677 in March 2009 to 3,231 at end-2019 — a 15.3% annualized return (S&P Global), about 5 points above long-term historical average. A 60/40 portfolio delivered >10% annualized. The Bloomberg Global Aggregate Bond index posted positive returns ten years out of eleven between 2009 and 2019. The Nasdaq Composite quintupled. Real estate (Case-Shiller +60%, S&P Global), corporate credit and even alternatives benefited from the liquidity tide.
But that performance masked growing fragility. Returns came mainly from multiple expansion (S&P forward P/E from 10x in March 2009 to 19x at end-2019, FactSet) rather than earnings growth — a mechanical effect of lower discount rates. “Volatility-selling” strategies proliferated — short-VIX assets exceeded $3bn AUM by early 2018 (Bloomberg). The “Volmageddon” of February 2018 — the XIV ETN losing 96% in one session — was a warning: volatility suppression is not volatility elimination, and positions built on its permanence are structurally fragile.
2020-2021: the apex — maximal stimulus and decoupling
The pandemic response pushed the liquidity regime to its breaking point. In March 2020 the VIX hit 82.7 (CBOE) — above the October 2008 peak — and the S&P 500 lost 34% in 23 sessions, the fastest plunge on record. Intervention was unprecedented: $5 trillion of US fiscal stimulus (CBO), the Fed’s balance sheet roughly doubled (from $4.2t to $8.9t, Federal Reserve), and — a major innovation — Fed purchases of corporate bonds and high-yield ETFs, crossing lines not crossed even in 2008.
The result was an unparalleled market episode. The S&P 500 hit a new record in August 2020, just five months after the trough — the fastest recovery ever. S&P forward P/E hit 23x at end-2021 (FactSet), versus a historic average of 16x. The Goldman Sachs Non-Profitable Tech index rose 200% between March 2020 and February 2021 (Bloomberg). GameStop peaked at $483 (+18,700% from its low, NYSE). SPAC AUM exceeded $160bn in 2021 (SPAC Research). Bitcoin topped $69,000 in November 2021 (CoinGecko).
This apex was not “irrational” per se — it was the logical consequence of a regime in which real rates were -1.19% (TIPS 10y, Aug 2021, Federal Reserve), excess liquidity exceeded $4tn, and households received direct fiscal transfers. Normal market corrective mechanisms — opportunity cost of capital, discrimination between assets, loss discipline — were temporarily neutralized. The regime had reached maximal extension. It could only contract.
Interpreting 2009–2021 performance as validation of an investment model rather than as the product of a specific, non-replicable monetary regime. Asset gains reflected mainly discount-rate compression — a mechanical effect — not proportional improvement in growth fundamentals. Calibrating expectations on that period is extrapolating properties of a regime that no longer exists.
2022-?: the regime shift — when capital regains a price
The 2022–2023 monetary tightening did more than trigger a correction — it changed the market regime. The structural properties that governed market dynamics for thirteen years flipped in months, creating dislocations models calibrated to the prior period could not absorb.
Reversal of the previous regime’s properties
Property 1: real rates, from negative to positive. The US 10-year real rate (TIPS) moved from -1.19% in August 2021 to +2.40% in October 2023 (Federal Reserve) — a 360 bps swing, the largest in TIPS history. This swing mechanically compressed valuation multiples: the S&P forward P/E dropped from 23x to 15.5x between end-2021 and October 2022 (FactSet). The Goldman Sachs Non-Profitable Tech index lost 75% (Bloomberg). Bitcoin fell from $69,000 to $16,000 (-77%, CoinGecko). Long-duration assets — most sensitive to discount rates — experienced the largest losses.
Property 2: equity/bond correlation, from negative to positive. 2022 produced what many in asset management thought impossible: simultaneous falls in equities (-19% S&P 500) and bonds (-31% long Treasuries, ICE BofA). The 60/40 portfolio had its worst year since the 1970s. This correlation flip is not an accident — it is the product of an inflationary regime. When inflation is the dominant risk (not recession), tightening cuts both equities (via multiples) and bonds (via rising yields). The detailed analysis is in the Correlations sub-pillar.
Property 3: risk premia, from compressed to replenished. “TINA” gave way to “TARA” (There Are Reasonable Alternatives). With T-bills at 5.25% and real rates above 2%, investors for the first time since 2007 had remunerative alternatives to risky assets. US money funds gathered over $1tn in 2023 (ICI), reaching a record $6tn AUM. The Treasury term premium turned significantly positive again (Fed NY). HY spreads rose from 303 bps (June 2021) to 583 bps (July 2022, ICE BofA) before partially tightening — but the structural floor is now higher than in the prior regime.
Property 4: volatility, from suppressed to structural. Average VIX rose from 14.2 (2013–2019) to around 20 (2022–2024, CBOE), returning to its long-run mean ~19.5. More important than the mean is spike frequency: VIX exceeded 30 six times between 2022 and 2024, versus twice between 2013 and 2019. The August 2024 episode — VIX at 65, Nikkei -12% in one session during the yen carry unwind (CBOE, Bloomberg) — showed that the return of rate differentials and volatility creates more frequent, more violent stress episodes. Volatility is no longer suppressed — it is a structural regime property.
Dispersion: the marker of the new regime
The prior liquidity-dominated regime compressed performance dispersion — “a rising tide lifts all boats.” The new regime, driven by fundamentals and the cost of capital, increases dispersion. The Magnificent 7 (Apple, Microsoft, Alphabet, Amazon, Nvidia, Meta, Tesla) accounted for over 60% of the S&P 500’s gain in 2023 and virtually all of it in 2024 (S&P Global). The S&P 500 equal-weight underperformed the cap-weighted S&P by >10 points in 2023 (S&P Global) — a historic gap signaling concentrated, not broad, gains.
This dispersion is not an anomaly — it is the property of a regime where capital has a cost. When real rates are positive and liquidity tightens, only firms that can generate growth above their cost of capital create value. The rest stagnates or declines. HY default rates rose from 1.0% in early 2022 to 3.9% in Q3 2024 (Moody’s). US corporate bankruptcies reached 642 in 2023 — the highest since 2010 (S&P Global Market Intelligence). Selection becomes discriminating again after a decade where it did not.
The three prisms of structural market analysis
Beyond a historical reading of regimes, market analysis is organized around three inseparable dimensions whose interaction determines market dynamics at any time. This triptych is Eco3min’s transversal reading grid.
Prism 1: the monetary regime and liquidity
The monetary regime sets the operating framework for markets. The level of real rates fixes the opportunity cost of capital and the discount rate for future cash flows — the variable that governs valuation multiples across assets. The amount of available liquidity — measured by central bank balance sheets, bank reserves and Reverse Repo Facility flows — determines the system’s capacity to absorb shocks and fund positions. The stance of policy — restrictive, neutral or accommodative — conditions expectations about the trajectory.
These mechanisms are analyzed in depth in the Monetary Policy & Rates pillar and the Liquidity sub-pillar. Their transmission to corporate results, with an empirical lag of 12–24 months, is documented in the Monetary Transmission sub-pillar.
Prism 2: expectations and price formation
Markets do not react to events per se — they react to the gap between what happens and what was priced in. A payrolls print of 336,000 (BLS, Sept 2023) sells off bonds not because it is “high” absolutely but because it is double the 170,000 consensus, forcing a revision of expected rate paths. This realized-vs-expected gap — not absolute data levels — is the engine of price formation in the short and medium term.
Sentiment, positioning and volatility indicators map these expectations — but their informational power depends on the regime. In abundant-liquidity regimes, euphoria can persist beyond any historical threshold. In tightening regimes, contrarian signals regain empirical reliability. Detailed analysis is in the Expectations & Market Dynamics sub-pillar.
Prism 3: capital flows
An asset appreciates sustainably when demand persistently exceeds supply, regardless of the ex-post narrative. Tracing flows — their origin (retail vs institutional), timing (strategic vs tactical), persistence (structural vs cyclical) — explains market moves beyond after-the-fact narratives. Inflows into money market funds (+$1tn in 2023, ICI), corporate buybacks (> $800bn in 2023 for the S&P 500, Goldman Sachs), passive ETF inflows (> $600bn annual net inflows, ETFGI) — which operate through mechanical capital allocation driven by index construction and replication rules — and foreign central bank movements in Treasuries (> $7.6tn outstanding, TIC) are tectonic forces shaping market trends.
Flow analysis is developed in the Follow the Money sub-pillar. The dollar’s role as a systemic variable is treated in the Dollar sub-pillar and the Currencies & Forex sub-pillar.
Financial crises do not appear ex nihilo. They are foreshadowed by signals in the system’s plumbing — technical markets, little-reported but essential, that fund the daily operations of the financial edifice. Credit spreads, the repo market, cross-currency basis swaps, Treasury liquidity and the TED spread act as a sensor network: they detect dysfunction before equity indices announce the alarm.
The sequence is empirically documented. In September 2019 the overnight repo rate jumped from 2% to 10% in hours (Federal Reserve), signaling a sudden liquidity drain — the Fed had to inject $75bn daily in emergency operations. In March 2020 bid-ask spreads on Treasuries — the world’s most liquid asset — widened more than tenfold (BIS), producing a market dislocation that forced the Fed to buy $1tn of Treasuries in three weeks. In March 2023 the SVB bank run — $42bn withdrawn in 24 hours (FDIC) — revealed $620bn of latent losses unrecognized across the US banking system (FDIC Quarterly Banking Profile).
The current regime concentrates several identified fragility hotspots: the Treasury basis trade (estimated $800–1,000bn positions, Brookings/Fed), commercial real estate ($5.8tn debt, office vacancy >20%, CBRE/Mortgage Bankers Association), private credit ($1.7tn of opaque valuations, Preqin) and leveraged loans ($1.4tn, LCD/PitchBook). These vulnerabilities are analyzed in detail in the Hidden Stresses sub-pillar and the Systemic Fragilities sub-pillar.
Microstructure: when internal mechanics change dynamics
Markets are not perfect auctions. Their microstructure — order-book depth, dealer concentration, execution speed, venue fragmentation — determines price quality and the market’s ability to absorb shocks. In stress, this mechanics can amplify moves well beyond what fundamentals justify.
Three structural transformations have changed market microstructure over the last decade. The rise of passive management — ETFs and index funds now account for over 50% of US equity fund AUM (ICI, 2024) — creates mechanical flows disconnected from fundamental analysis. Same-day expiry options (0DTE) now form over 40% of S&P 500 options volume (CBOE, 2024), producing “gamma effects” that amplify intraday volatility. The number of market-making firms has concentrated — 5–7 players now supply most liquidity in major equity and bond markets (BIS), versus 15–20 two decades ago.
Flash crashes — GBP -6% in Oct 2016, yen -4% in Jan 2019, Treasuries in Mar 2020 — remind that this invisible infrastructure can produce moves unrelated to fundamentals. Detailed analysis is in the Market Internal Mechanics sub-pillar.
What markets misread in the current regime
Every regime change produces systematic misreads. The current regime generates three.
Extrapolating the prior regime. Allocation models calibrated on 2009–2021 — negative equity/bond correlation, low volatility, compressed risk premia, growth consistently outperforming value — yield inappropriate recommendations in the current regime. “Buy the dip” worked 43 consecutive times between 2009 and 2021 for 5% S&P dips (Goldman Sachs). In 2022 it failed: each rebound was followed by another leg down. The market was no longer in a “dip-buying” regime — it was in structural repricing.
Confusing financial conditions with policy rates. The Goldman Sachs Financial Conditions Index eased significantly between Oct 2023 and end-2024 — driven by a +24% S&P, tightening spreads and a weaker dollar — while Fed Funds stayed at 4.50%. Markets thus “undid” part of Fed tightening by asset appreciation, creating a paradox: the Fed may judge conditions too accommodative to cut rates even if nominal rates are high.
The illusion of permanent liquidity. Market liquidity — the ability to buy or sell quickly without large price impact — is abundant in normal times and evaporates when most needed. E-mini S&P order-book depth — the most direct futures liquidity metric — has fallen over 50% since 2019 (JPMorgan). This structural evaporation implies future volatility spikes are likely to be more brutal than in the prior regime, even absent proportionate fundamental shocks.
From financial markets to allocation decisions
The analytical framework formalized in this pillar does not aim to predict market direction — it aims to identify the regime in which markets operate and to understand its properties. A regime of positive real rates, contracting liquidity, positive equity/bond correlation and rising dispersion does not imply the same exposures as a regime of zero rates, permanent QE and compressed risk premia. Understanding the regime precedes the allocation decision — not the other way around.
Allocation principles, strategic frameworks and concrete implications of this reading are developed in the Investment Strategies pillar, which is the operational extension of the structural analysis formalized here and in the Monetary Policy & Rates and Macro & Geopolitics pillars.
Financial markets have changed regime. The 2009–2021 decade — negative real rates, suppressed volatility, negative equity/bond correlation, compressed risk premia, performance driven by multiple expansion — constituted a historically unique environment whose properties no longer operate. The regime emerging since 2022 is characterized by positive real rates, structural volatility, positive equity/bond correlation in an inflationary phase, rising dispersion and a return to discrimination. The relevant question is not “are markets expensive or cheap?” but “which regime of real rates, liquidity and correlation are we in, and what does that imply for price formation, risk management and capital allocation?”. This is the question this pillar and its sub-pillars seek to answer.