
Systemic Fragilities: Debt Sustainability, Shadow Banking, and Financial Stability Risks
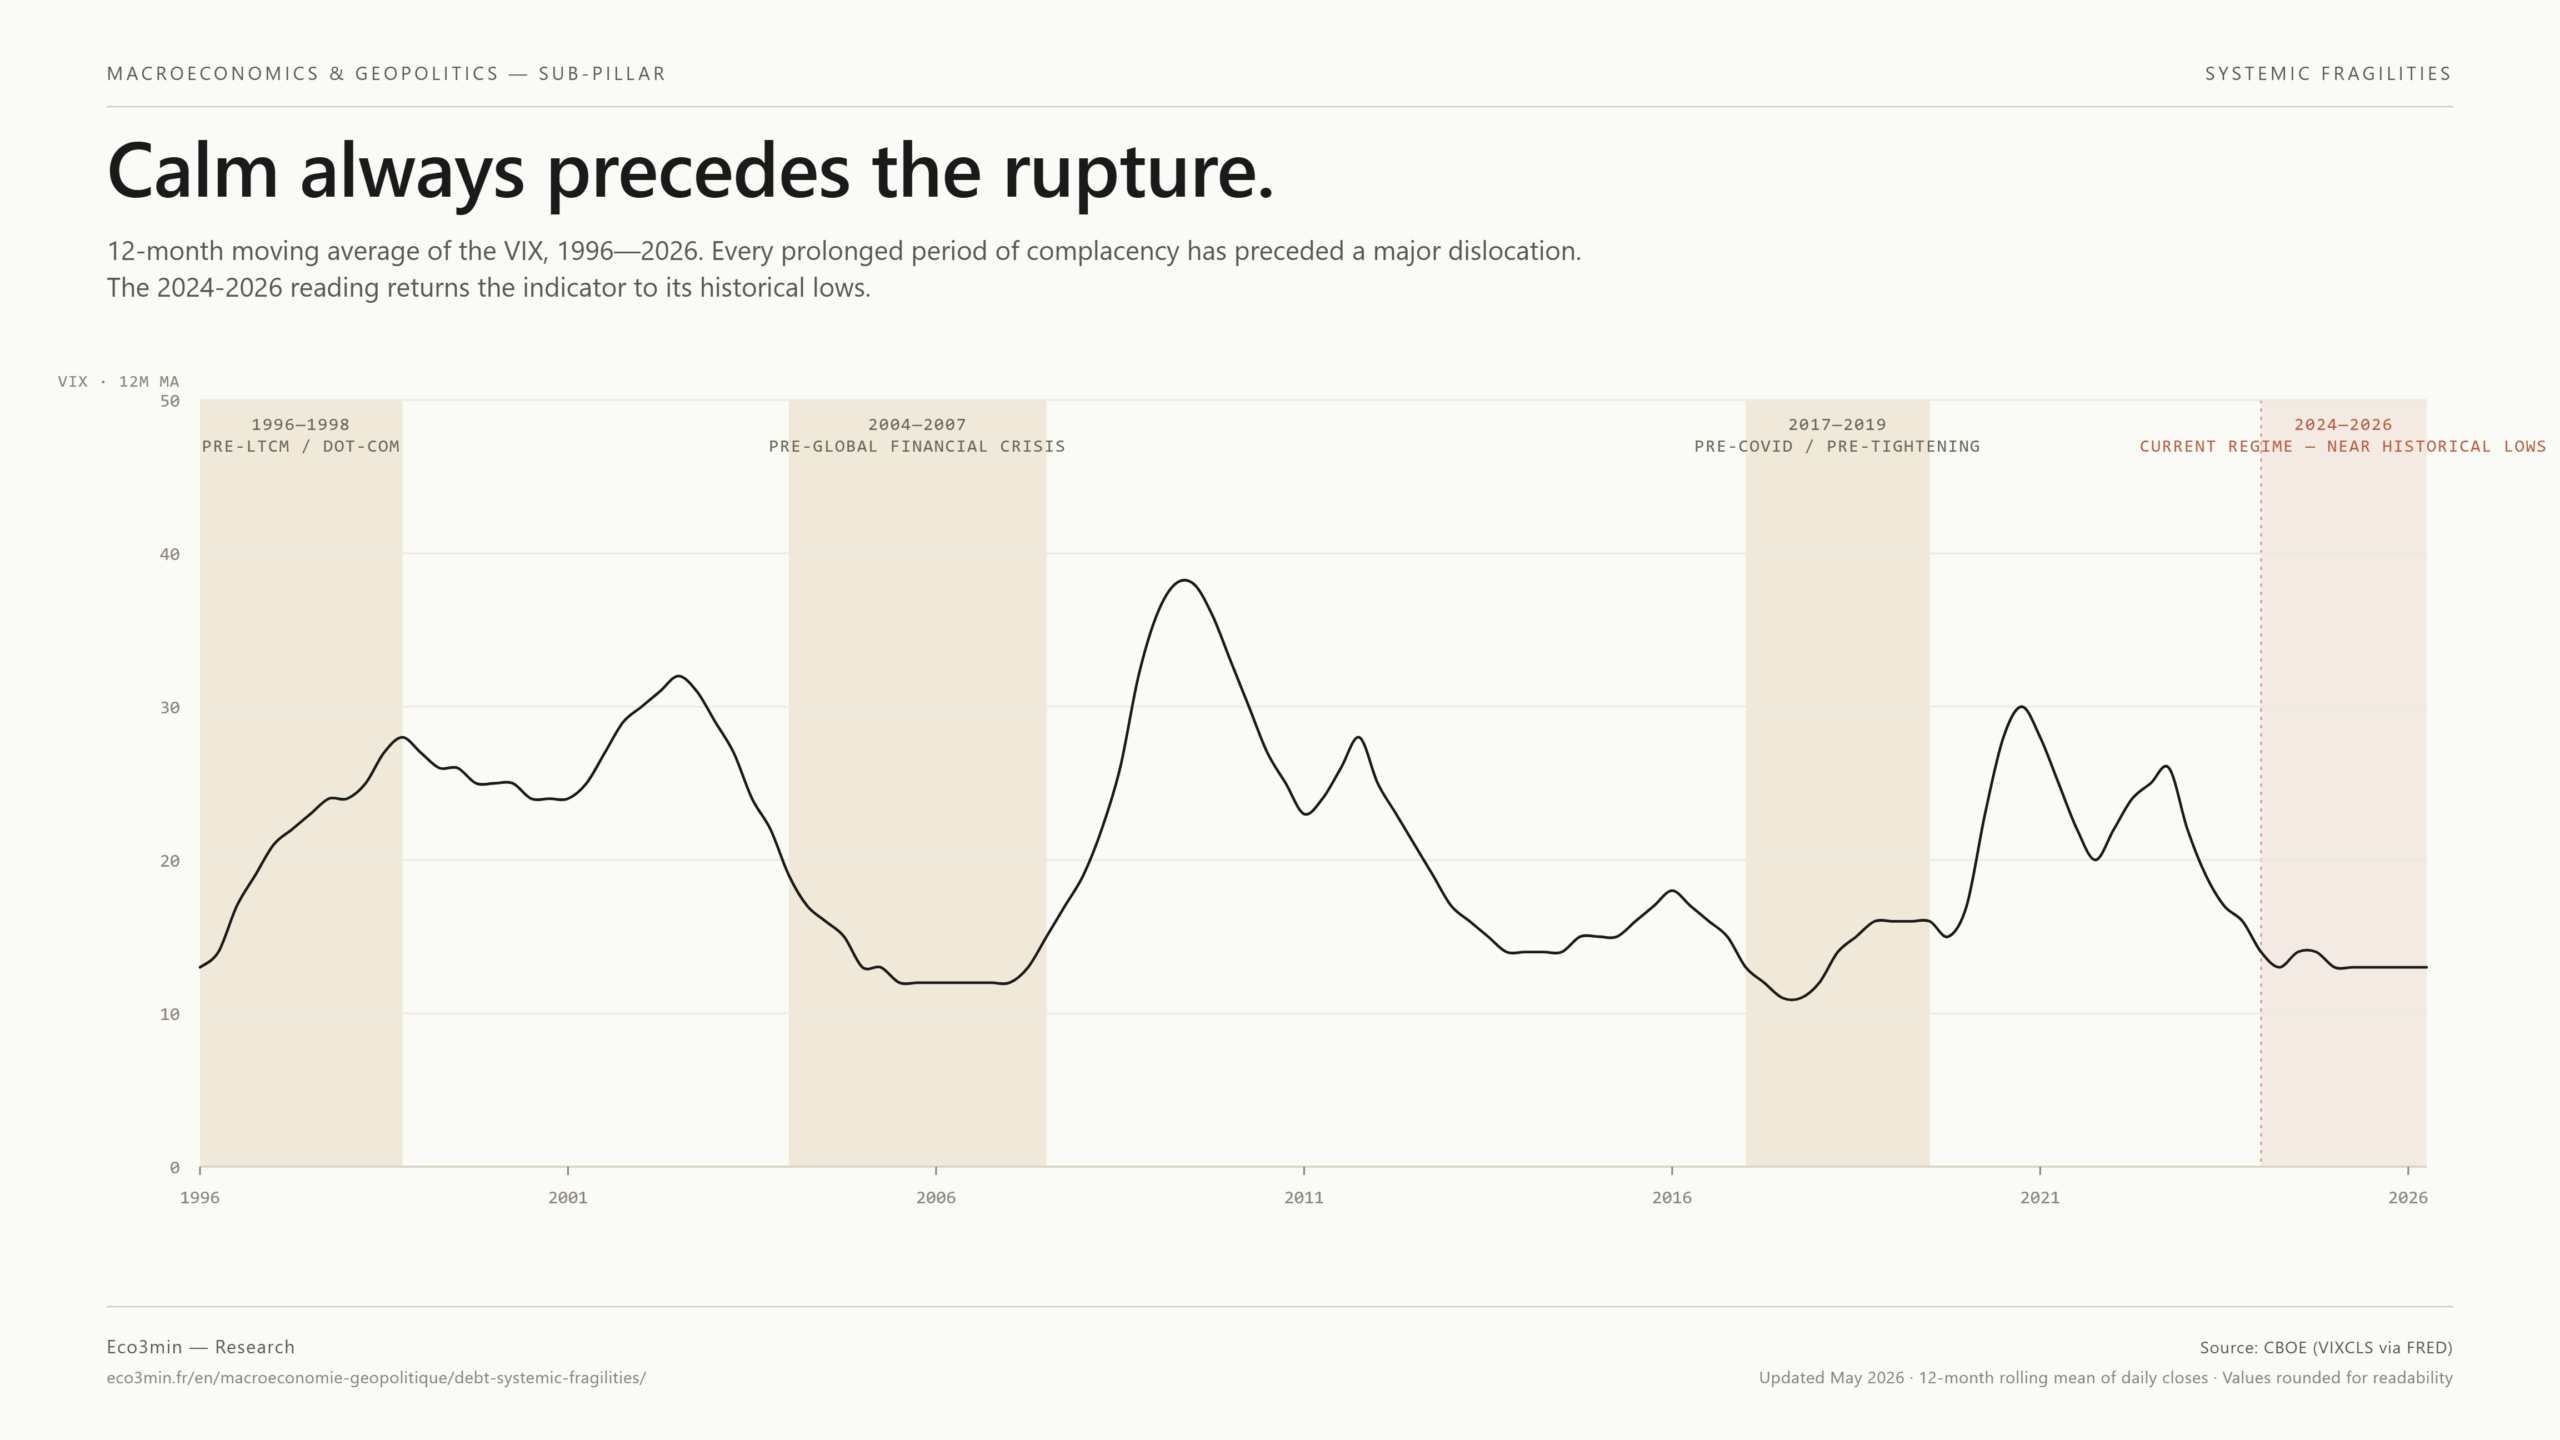
The 2024-2026 reading returns the indicator close to its historical lows — an apparent calm that, in recent history, has never been a sign of system stability.
Modern economies rest on an unprecedented stack of public and private debt in peacetime. As long as interest rates remain below nominal growth, this architecture holds. But when this differential reverses, long-invisible fragilities abruptly resurface. Systemic crises are not accidents — they are the predictable result of imbalances accumulated during expansion phases, when abundant liquidity and compressed risk premiums mask the gradual deterioration in credit quality and debt sustainability.
This page provides a structured reading of systemic fragilities related to indebtedness, nonbank finance, and monetary imbalances. The objective is not to predict a crisis — an exercise history shows to be futile — but to identify where and how the system can break, and which signals to monitor to anticipate rupture points.
What is a systemic fragility?
A systemic fragility refers to a configuration in which financial, monetary, or institutional imbalances make the entire system vulnerable to a shock, even a moderate one. The key concept is nonlinearity: the system absorbs growing tensions without visible reaction, then abruptly tips once a critical threshold is crossed. Hyman Minsky formalized this dynamic as early as 1986: stability breeds risk-taking, which breeds instability — an endogenous process that regulation struggles to capture in real time. Among recent additions to this taxonomy, stablecoins extend the unregulated tier of dollar money — see the digital eurodollar layer documented in our stablecoin study.
These fragilities are not always visible during expansion phases. The VIX — the implied volatility index of the S&P 500 — averaged below 15 for most of 2017 and 2019 (CBOE), signaling extreme complacency while imbalances were accumulating. The U.S. high yield spread fell to 303 basis points in June 2021 (ICE BofA), months before the most aggressive tightening in forty years. The absence of apparent stress is often the most misleading signal.
How Eco3min analyzes systemic fragilities
Eco3min analyses approach systemic fragilities through several converging angles: public and private debt sustainability, expansion of nonbank credit, emergency monetary interventions, and financial stress signals. This page provides the interpretive framework linking these analyses and embeds them in the broader dynamics of the economic cycle and liquidity conditions.
Three systemic crises, one common pattern
Systemic crises over the past thirty years share a remarkably similar structure despite apparently different triggers. Analyzing three major episodes helps identify invariants — and understand why the financial system cyclically reproduces the same fragilities. A closer look: the panorama of eleven regime shifts.
2008: the subprime crisis and the collapse of structured credit
The 2008 financial crisis is the archetype of modern systemic fragility. The central mechanism was the accumulation of risk in off-balance-sheet vehicles — SIVs (Structured Investment Vehicles), CDOs (Collateralized Debt Obligations), securitization conduits — that transformed low-quality mortgages into AAA-rated bonds. Outstanding CDOs reached $2 trillion at their 2007 peak (SIFMA). The five largest U.S. investment banks reported leverage ratios above 30:1 (SEC, 2008). Taken from the SEC Inspector General’s report 446-A on the Consolidated Supervised Entity program. Ratios of that order held only because the same securities financed several positions at once, a mechanism that runs through the reuse of client collateral and the limits placed on it.
The collapse was abrupt: between September and November 2008, the global financial system came close to total paralysis. Lehman Brothers’ bankruptcy (September 15, 2008) froze the interbank market — the Libor-OIS spread reached 364 basis points (Federal Reserve). AIG, which had sold $440 billion in CDS (credit default swaps) on subprime-backed CDOs, required a $182 billion public bailout (Treasury). The S&P 500 fell 57% between October 2007 and March 2009.
The central lesson: fragility was not in subprime mortgages themselves — a few-hundred-billion-dollar market — but in the intermediation chain that transformed localized risk into global systemic risk through leverage, securitization, and balance-sheet interconnectedness.
2020: the fastest liquidity crisis in history
The Covid shock of March 2020 revealed a different type of fragility: the system’s dependence on continuous liquidity. Within two weeks, the VIX reached 82.7 (CBOE) — above the 2008 peak. The U.S. Treasury market, considered the world’s most liquid and safest, experienced severe dysfunction: bid-ask spreads widened tenfold, and hedge funds running “basis trade” arbitrage strategies faced massive margin calls, amplifying dislocation (Federal Reserve Bank of New York).
The Fed injected more than $1 trillion of liquidity in three weeks (Federal Reserve) — an intervention pace without precedent in financial history. Money market funds faced $150 billion in redemptions in five days (ICI), forcing the reactivation of emergency facilities created in 2008. The episode showed that even a well-capitalized banking system — major banks’ capital ratios had been significantly strengthened since 2008 — could face systemic liquidity stress when nonbank intermediaries falter.
2023: the regional bank crisis and duration risk
The collapse of Silicon Valley Bank (SVB) in March 2023 — the largest U.S. bank failure since Washington Mutual in 2008 — exposed a more insidious fragility: hidden duration risk on bank balance sheets. SVB held $91 billion in long-term securities (mainly MBS and Treasuries) whose market value had fallen by $15 billion due to rising rates (FDIC). This unrealized loss, not recognized under HTM (held-to-maturity) accounting rules, became critical when depositors — mainly tech startups — withdrew $42 billion in 24 hours, the largest bank run in history (FDIC).
Signature Bank and First Republic followed. Unrealized losses across the U.S. banking system reached about $620 billion in Q1 2023 (FDIC Quarterly Banking Profile). The Fed urgently created the Bank Term Funding Program (BTFP), allowing banks to borrow at par against depreciated securities — a measure that stabilized the system while implicitly acknowledging that rising rates had created massive losses across the banking sector.
The common pattern across these three episodes: risk accumulation during periods of low rates and abundant liquidity, followed by abrupt crystallization when financial conditions tighten, a pattern at the heart of our analysis of the real economic cycle — often through an unexpected link in the intermediation chain.
Debt sustainability: a conditional illusion
Debt is not a problem in itself. It becomes one when debt servicing absorbs a growing share of income and constrains investment, consumption, or fiscal room for maneuver. The key lies in a simple but decisive differential: the relationship between the effective interest rate on debt (r) and the economy’s nominal growth rate (g). Once that differential turns against a sovereign, the pressure to keep r low migrates from the treasury to the central bank — the mechanism at the core of fiscal dominance over monetary policy. As long as r < g, the debt-to-GDP ratio can stabilize or mechanically decline even with primary deficits. When r > g, every dollar of debt requires additional fiscal effort simply to avoid a debt spiral. More on this: the link between U.S. public debt and gold’s monetary role.
The r − g differential: is the debt sustainable?
EFFECTIVE RATE (r) vs NOMINAL GROWTH (g)It is not the level of debt that determines its sustainability, but the sign of r − g. A change in the rate regime can flip it without a single dollar of debt moving.
Public debt: unprecedented peacetime levels
Public debt in advanced economies has reached unprecedented levels outside world war periods. U.S. federal debt held by the public stood at 97% of GDP at the end of 2024 (Congressional Budget Office), up from 35% in 2007. The euro area debt-to-GDP ratio was 89% (Eurostat), Japan’s 255% (IMF), France’s 112%, and Italy’s 137%. Background: Japan’s lost decades, 1989-2003.
The rate reversal of 2022–2023 abruptly changed debt arithmetic. In the United States, net federal interest payments exceeded $880 billion in fiscal year 2024 (CBO) — more than the Defense budget ($886 billion). The CBO projects this burden will reach $1.7 trillion per year by 2034, absorbing more than 4% of GDP alone. In France, debt servicing became the largest state budget item in 2024, ahead of Education (Cour des Comptes). Watching debt service overtake a core state function is one of the clearest markers of the growing weight of finance in advanced economies.
The equilibrium prevailing during the 2010s — negative real rates and nominal growth above debt costs — allowed chronic deficits to be financed without a sustainability crisis. The r-g mechanics and their interaction with the inflation regime are detailed in the complete guide to inflation regimes. This regime is structurally challenged by the return of positive real rates. The question is not whether debt is “too high” in absolute terms, but whether the r-g differential remains compatible with stabilizing the debt-to-GDP ratio without major fiscal adjustment. This dynamic is central to the analysis of the U.S. current account deficit as a structural risk.
Private debt: the silent risk
Private debt — households and corporations — often poses a more immediate risk than public debt because it is directly exposed to rate and income fluctuations. Total U.S. household debt reached $17.7 trillion in Q3 2024 (Federal Reserve Bank of New York), a historic record. Non-mortgage consumer credit (credit cards, auto loans, student loans) exceeded $5 trillion, with credit card delinquency rates rising to 3.2% — the highest level since 2011 (Federal Reserve). For context: the Social Security reserve trajectory.
On the corporate side, U.S. corporate debt outstanding exceeded $13.5 trillion at the end of 2024 (SIFMA). The most fragile segment is leveraged loans and private credit — a market that expanded from $800 billion to over $1.7 trillion between 2018 and 2024 (Preqin), largely outside traditional banking regulation. A significant share of this debt was issued at floating rates, making borrowers directly sensitive to Fed tightening. Because such lending sits outside the bank perimeter, it escapes the capital ratios imposed by Basel III, which bind regulated balance sheets alone.
Shadow banking and nonbank finance: off-radar risks
A growing share of global credit circulates outside the traditional banking system. The Financial Stability Board (FSB) estimates that nonbank financial intermediaries (NBFIs) — investment funds, hedge funds, insurers, pension funds, securitization vehicles, lending platforms — managed about $218 trillion in assets at the end of 2023 (FSB, Global Monitoring Report 2024), nearly 50% of global financial assets. This figure has doubled since 2008. Measured against the regulated sector it now rivals, that stock moves the systemic weight of non-bank credit intermediation out of the realm of taxonomy and into that of financial stability.
The issue is not the existence of these actors — they play a useful role in financing the economy — but their interconnectedness with the banking system and limited access to safety nets. Unlike banks, NBFIs do not have access to central bank lender-of-last-resort facilities. They are not subject to the same liquidity and capital requirements. In periods of stress, this asymmetry creates fire-sale risk — forced asset sales that transmit shocks to the rest of the financial system. Without that backstop, the daily funding still has to come from somewhere, and it comes from the concentration of hedge fund financing among a handful of banks.
Three segments concentrate the risks most closely monitored by regulators. Open-ended funds, which offer daily liquidity while holding illiquid assets — corporate bonds, loans, real estate — create a structural liquidity mismatch estimated at several trillion dollars (FSB, 2024). Leveraged hedge funds, whose notional exposure through derivatives often exceeds their capital multiple times, can amplify market shocks — the Treasury basis trade, involving leverage of 50:1 to 100:1, nearly destabilized the U.S. bond market in March 2020 (BIS). Finally, private credit — direct lending to companies by nonbank funds — relies on internal models rather than market prices for valuation, potentially masking credit quality deterioration invisible in aggregate data. Worth reading alongside: our study on U.S. federal deficits above 5% of GDP at full employment.
The case of Chinese shadow banking particularly illustrates these dynamics. Trusts, wealth management products (WMPs), and opaque local government financing channels have accumulated nonperforming claims estimated in the trillions of yuan, within a system where implicit state guarantees blur the assessment of real risk.
Viewing the absence of a visible crisis as evidence of system stability. Minsky’s financial instability hypothesis teaches the opposite: it is during periods of apparent calm that risk-taking intensifies and fragilities accumulate. Low VIX, compressed spreads, and subdued volatility are not signs of health — they are the preconditions for the next dislocation.
Monetary crises and central bank responses: the lender-of-last-resort dilemma
When systemic fragilities crystallize, the response almost always comes from the central bank. Upstream of that response sits a preventive layer, macroprudential policy and what it is for, designed to slow the build-up of imbalances before they crystallize. Emergency liquidity provision, asset purchases, creation of exceptional facilities: these tools stabilize the system in the short term, but at the cost of growing distortions that feed the fragilities of the next cycle.
Recent history illustrates the progressive escalation of these interventions. In 2008, the Fed created a dozen emergency facilities and expanded its balance sheet from $900 billion to $2.2 trillion in a few months (Federal Reserve). In 2020, it injected more than $3 trillion in one year and crossed a red line by purchasing corporate bonds for the first time, including high yield via ETFs — a mandate extension few would have considered possible a year earlier. In 2023, facing the regional bank crisis, the Fed created the BTFP within 48 hours, lending to banks at par against securities worth 85 cents — an implicit subsidy that stabilized the system at the cost of considerable moral hazard. A related read: our study on U.S. interest payments set against defense spending since 1947.
Each intervention creates expectations of future intervention — moral hazard. Market participants, aware that the central bank will step in during stress, incorporate this free insurance into their risk-taking. The result is a cycle where each rescue makes the next more necessary and more costly. Rescue sequences of that shape recur across sovereigns and decades, which is why the recurring pattern of sovereign debt crises can be read as a sequence rather than a series of accidents. The ECB illustrated this dynamic at a different scale: its OMT program (2012), QE (2015), and PEPP (2020) each expanded what is considered within the mandate of financial stability — to the point that euro area sovereign spreads now embed an “ECB premium” that weakens market discipline.
These mechanisms are analyzed in our reading of contemporary monetary crises and in the study of the historic turning point in monetary policy. The institutional framework of these interventions is detailed in the Central banks and rate cycles sub-pillar.
Volatility and stress signals: reading cracks before rupture
Systemic crises never emerge without warning signals — but these signals are often ignored, misread, or drowned in market noise. Several indicators warrant systematic monitoring. Organising such monitoring across borders is precisely the job handed to the Financial Stability Board.
The VIX and its term structure. The absolute VIX level — the “fear gauge” — is less informative than its term structure. Normal contango (VIX futures > spot) indicates complacency. A shift to backwardation (spot > futures) signals acute stress and immediate hedging demand. In March 2020, spot VIX exceeded 82 while 3-month futures remained at 50 — a gap reflecting market conviction that the Fed would intervene to normalize conditions (CBOE).
Credit spreads. The widening of high yield and investment grade spreads is one of the most reliable indicators of rising systemic stress. The U.S. high yield spread (ICE BofA) moved from 303 basis points in June 2021 to 583 in July 2022, then compressed below 300 by late 2024 — a full stress-normalization cycle in three years. Agency ratings move on a slower clock than those spreads, and the gap between the two is what the market reaction to sovereign downgrades tends to expose. Historically, a sustained move above 600 basis points has preceded every recession since 1990. A threshold that has held across four decades is the sort of marker analysts reach for when discussing the likely shape of the next financial crisis.
Cross-currency basis swaps. This technical market measures the cost of dollar access for non-U.S. banks. A significant widening of the EUR/USD or JPY/USD basis swap signals offshore dollar shortages — one of the most powerful systemic transmission channels, as detailed in the Dollar sub-pillar. The EUR/USD basis swap reached −150 basis points in 2008 and −85 in March 2020 (Bloomberg).
Cross-asset correlation. In normal regimes, equities, bonds, and commodities show moderate or negative correlations. When all assets fall simultaneously — as in 2022, when the 60/40 stock-bond portfolio had its worst year in a century — this signals systemic liquidity stress: investors sell everything to raise cash regardless of fundamentals. In 2022, long-term U.S. bonds lost 31% while the S&P 500 fell 19% (S&P Global, ICE BofA) — a positive correlation unseen since the 1970s.
These signals are examined in detail in the analysis of the abrupt return of volatility and in the durable divergence between finance and the real economy.
Mapping current fragilities
Without predicting the next crisis, it is possible to identify vulnerability clusters that, under a stress scenario — recession, geopolitical shock, market accident — types of disruptions also analysed in our deglobalization sub-pillar — would concentrate systemic contagion risks.
U.S. commercial real estate
~$5.8tn in debt (Mortgage Bankers Association, 2024), much of it maturing in 2025-2026 and needing to refinance far above origination rates. Office vacancy > 20% (CBRE). Regional banks hold ~70%.
Private credit and leveraged debt
Market doubled in five years to $1.7tn (Preqin): limited transparency, model-based valuation. Leveraged loans total $1.4tn (LCD/PitchBook), mostly floating-rate — directly sensitive to policy rates.
Leverage in rate markets
The Treasury basis trade (cash versus futures) represented $800bn to $1tn outstanding at end-2024 (Brookings, Fed). The BIS and FSB monitor it as a dislocation risk for the most important market in the global financial system.
Sovereign debt of vulnerable countries
Italy 137%, France 112%, Japan 255% of GDP. In the euro area, the BTP-Bund spread is the barometer: a sustained widening beyond 250bps has historically signaled a confidence crisis (ECB).
Systemic crises are not exogenous accidents — they are the endogenous product of imbalances accumulated during expansion phases, when abundant credit and compressed risk premiums mask the gradual deterioration of balance-sheet quality. The relevant diagnosis is not “will a crisis occur?” but “where are risk concentrations, what is the weakest link in the intermediation chain, and which shock could crystallize latent tensions?”. In the current regime — public and private debt at record levels, rapidly expanding nonbank finance, real rates back in positive territory — vulnerability clusters are identifiable. The timing of their crystallization is not.
← Back to the pillar page Macroeconomics and geopolitics
Last updated — 18 September 2026
Disclaimer – Financial Information: The analyses, commentary, and content published on eco3min.fr are provided for informational and educational purposes only. They do not constitute investment advice or a solicitation to buy or sell financial instruments. Past performance is not indicative of future results. All investment decisions involve risk and are the sole responsibility of the reader.
Read next
Full pillar →Macro tools: read the regime and the cycle
Reading frame Eco3min's macro tools do not predict the cycle — they make it legible. Where the financial-education…
Geopolitics and Macroeconomics: Structural Transmission to Markets and Economic Regimes
Four geopolitical transmission channels measured since 1990 (European TTF gas price in EUR/MWh, Trade Policy Uncertainty index, world…
Crisis Hub: eleven crises read as macro regime shifts
The dynamic counterpart to the regime Atlas: eleven crises read not as isolated events, but as shifts from…