How Interest Rates Reshape Financial Markets: Valuations, Flows, and Risk Premia
Interest rates do not cause an instantaneous rupture in financial markets. They gradually reshape valuation criteria, asset-allocation trade-offs and portfolio structures — a slow, cumulative, and uneven process.
Markets do not react to rates — they reorganize around them.
Movements in interest rates progressively redefine valuation frameworks and allocation trade-offs. Their influence spreads through discounting mechanisms, capital flows, and financing conditions, far beyond the immediate movements of indices.
Reading markets solely through daily moves hides the core dynamic: rates act as a structural constraint that recomposes risk premia, the hierarchy of expected returns, and portfolio structures over several quarters.
A paradox runs through financial debate since the 2022–2023 tightening: central banks raised policy rates at the fastest pace in four decades, yet equity markets reached record highs. For some observers, this coexistence proves that rates no longer exert the influence attributed to them. For others, it signals an unsustainable gap between the cost of capital and valuations. Both readings miss the central mechanism: interest rates do not hit financial markets like a shock that comes and goes, but act like a gravitational constraint that gradually redraws the balance of power across asset classes.
This process is slow, cumulative, and deeply unequal. A rise in policy rates does not mechanically cause a simultaneous fall across all assets: it changes the discount rate applied to future cash flows, redirects capital flows between bonds, equities, real estate and currencies, and shifts investors’ required rates of return. These adjustments occur over quarters — sometimes years — and produce their most visible effects not in index levels but in the dispersion of performance across sectors, geographies and duration profiles.
This analytical framework builds on the monetary policy fundamentals developed in the analysis of the role of the real cost of money in markets and aligns with the market anticipation dynamics. The present article focuses on the concrete mechanics by which rate changes transmit to different asset classes.
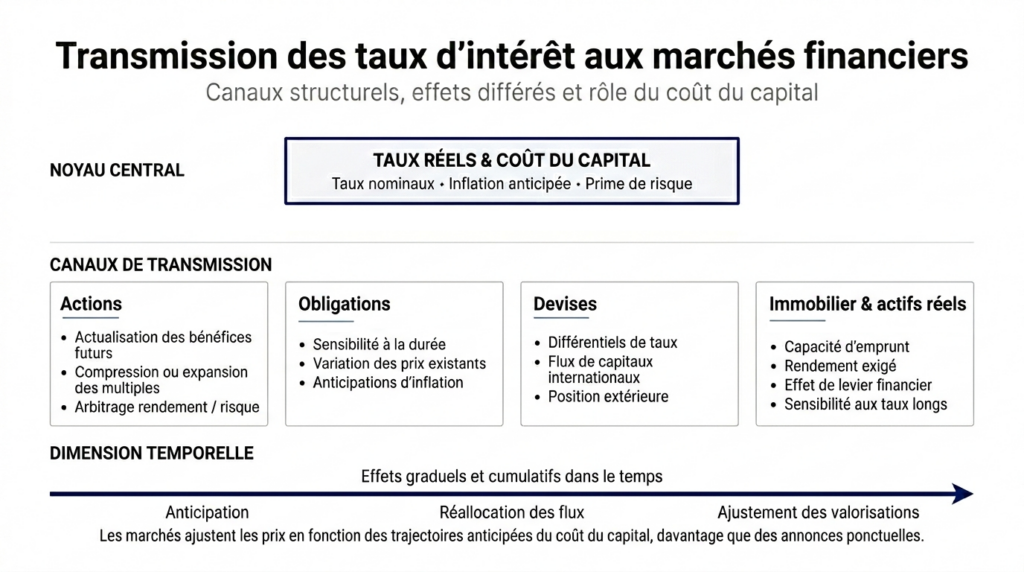
Markets do not react to rates — they reorganize around them. Interest rates influence financial markets through three main channels: the discount rate (which compresses or expands valuations), the reallocation of flows between asset classes (which changes the balance of power), and the credit/balance-sheet channel (which affects financing capacity and leverage). The first visible effect is not a generalized drop in indices but growing dispersion — between growth and income stocks, between leveraged and low-debt sectors. This progressive reorganization mechanism is well documented (BIS, Fed, academic literature); the precise magnitude of adjustment still to come in the current cycle remains debated.
The central mechanism: three channels, one progressive reorganization
The transmission of interest rates to financial markets follows a causal chain in which each link operates with its own timing and intensity.
Trigger: the change in the risk-free rate. The central bank policy rate sets the floor for the risk-free return in the economy. Any change in that rate first propagates to interbank rates and then to sovereign bond yields across the curve. This movement redefines the benchmark against which all asset classes are assessed. The 2022–2023 cycle provides the clearest illustration: the U.S. 10-year Treasury yield rose from about 1.5% in early 2022 to a peak above 5% in October 2023 (FRED, Federal Reserve Bank of St. Louis), while the German 10-year Bund moved from -0.2% to over 3% in the same period — a historic repricing of the risk-free rate that mechanically altered the opportunity cost of every risky investment.
Main transmission channel: discounting and valuation. The most direct mechanism runs through discounting future cash flows. In the standard Discounted Cash Flow model, an asset’s present value is inversely related to the discount rate. When the risk-free rate rises, the discount rate increases and the present value of future flows falls — mechanically, even without any deterioration in corporate fundamentals. A Federal Reserve Bank of New York working paper (Adrian, Crump & Moench, 2013) formalized the decomposition of bond yields into expected rate and term premium components, showing that term-premium variations affect equity valuation multiples as much as — if not more than — policy rate moves themselves.
This channel affects assets very unevenly depending on their duration profile. Growth stocks — where most cash flows are far in the future — are mechanically more sensitive to the discount rate than income stocks that deliver immediate cash returns. Bloomberg data for 2022–2024 show this asymmetry: the MSCI World Growth index underperformed the MSCI World Value index by more than 15 percentage points cumulatively during the rise in real rates, before outperforming again when rate-cut expectations emerged — a divergence consistent with differential discounting effects.
Amplifier: flow reallocation and substitution effects. Beyond valuation, interest rates set in motion a reallocation of capital between asset classes. When bond yields rise, bonds become relatively more attractive versus equities — a mechanism the BIS (2025 annual report) calls the “inter-class substitution effect.” This process is not instantaneous: it passes through strategic allocation decisions by institutional investors (pension funds, insurers, sovereign wealth funds), whose reallocations occur over quarters. The BofA Global Fund Manager Survey (December 2025) recorded an overweight to bonds vs equities at the highest level since 2009 — a signal of ongoing reallocation whose full effects on flows have yet to materialize.
Macro-financial consequence: dispersion, not crash. The combination of these channels produces a result that defies common intuition: a sustained rise in rates does not necessarily trigger a generalized market collapse. It produces a progressive reorganization whose first observable signal is dispersion — widening performance gaps across sectors, styles (growth vs value), firms by leverage, and duration sensitivity. Broad indices can mask this reality for quarters or even years before a tipping point is reached. Observations from the 2010–2019 and 2022–2025 cycles confirm this: phases of durable real-rate rises have coincided more with widening sector performance gaps than with broad index declines.
What the consensus integrates — and the gap it underestimates
The prevailing market reading, echoed by most investment-bank strategists and allocation surveys, rests on a reasonable central scenario: policy rates have peaked, a gradual easing cycle is underway or imminent, and high equity valuations are justified by an anticipated monetary pivot combined with earnings resilience. This diagnosis is not without basis — futures markets do indeed price a progressive easing scenario.
Its fragility lies in an implicit assumption: that the repricing of the risk-free rate is complete and that markets have already priced the new cost-of-capital regime. Yet several indicators suggest the adjustment remains incomplete. The equity risk premium, as estimated by Goldman Sachs Research (December 2025), hit its lowest level since 2007 — signaling that compensation for holding equities versus bonds has compressed to levels historically associated with complacent risk appetite. The BIS (quarterly report, December 2025) notes that corporate credit spreads remain near cyclical lows, a disconnect with tightened financing conditions documented in credit-flow data.
The consensus is therefore correct to expect easing, but it may underestimate the gap between valuations that assume a rapid return to accommodative conditions and a reality in which the cost of capital, even if falling, remains structurally higher than in the 2010–2020 decade. It is in this gap that the most significant repricing risk lies — not a crash, but a progressive and uneven adjustment of risk premia.
Assuming that the absence of a broad correction means rates have no effect on markets. In practice, rates first manifest their influence through compressed risk premia, lower valuation multiples, and widening dispersion across sectors and styles — adjustments that precede, by several quarters, any visible broad index decline. Capitalization-weighted indices can hide significant deterioration among most constituents. The most relevant indicators are not the S&P 500 level but sector performance dispersion and the compression of the equity risk premium.
| “Repricing completed” reading | Progressive reorganization reading | |
|---|---|---|
| Implicit assumption | The market has priced the new rate regime | The adjustment of risk premia is incomplete |
| Observed signal | Indices at highs, resilient earnings | Equity risk premium at its lowest since 2007, compressed spreads |
| Expected mechanism | Monetary pivot → revaluation | Structurally higher cost of capital → dispersion and gradual repricing |
| Main risk | Inflation reaccelerates, pivot delayed | Brutal adjustment if easing expectations are disappointed |
| Preferred indicators | Policy rates, earnings, forward guidance | Term premium, equity risk premium, sector dispersion, reallocation flows |
Differentiated transmission: why each asset class absorbs the rate shock at its own pace
The general transmission scheme hides deep asymmetries between asset classes that explain why the same rate movement produces apparently contradictory effects across market segments.
Bonds: direct mechanics, contrasting sensitivities. The bond market is the first recipient of the rate signal through the inverse relationship between yield and price. But the magnitude of adjustment depends on duration: long bonds concentrate most of the volatility, while short-term instruments reflect monetary policy expectations. The 10-year Treasury yield is the pivot variable because it conditions the discount rate for all risky assets. Between 2022 and 2025, the MOVE index (ICE BofA) — measuring implied volatility on Treasuries options — remained more than 40% above its prior-decade average (Bloomberg data), signaling an active and incomplete repricing in the bond market.
Equities: slow compression of multiples. In equities, the effect of rates is not a shock but an underground pressure. The S&P 500 cyclically-adjusted price/earnings ratio (CAPE Shiller) stood above 33 at the end of 2025 — a multiple historically associated with compressed future returns, according to Robert Shiller’s data (Yale). The structural question posed by the new rate regime is the sustainability of these multiples when the risk-free yield offers a real alternative: with the 10-year Treasury yielding around 4–4.5%, the opportunity cost of holding high-multiple equities is mechanically higher than when yields were 1.5%. This differential discounting mechanism is how rates redraw winners and losers across equity markets.
Real estate: the credit channel as a direct belt. Real estate is the asset class most directly exposed to rates because acquisition relies heavily on credit. Financing costs determine buyers’ borrowing capacity and, by extension, prices. From 2022 to 2025, rising rates led to a 25–40% contraction in transaction volumes depending on the market (Eurostat for the euro area, NAR for the United States), often before prices began to correct — a timing gap that illustrates the “volume first, prices later” sequence typical of monetary transmission to real estate.
Currencies and commodities: indirect channels. The wave of rate changes propagates to FX markets via yield differentials across monetary zones. A U.S. rate hike attracts capital into the dollar, appreciating the currency and weighing on U.S. exporters while putting pressure on dollar-denominated indebted emerging markets. Commodities, priced in dollars, face a double effect: a stronger dollar increases costs for buyers outside the dollar area, while monetary tightening dampens physical demand. This indirect channel explains why commodities respond to rates with delays and intensities that depend as much on dollar dynamics as on rates themselves.
The nominal-rate trap: why the real rate is the relevant variable
Focusing on the nominal policy rate is one of the most common errors in financial analysis. What determines the real impact of rates on markets is the real rate — the nominal rate adjusted for expected inflation. The distinction between nominal and real rates is decisive: two configurations with identical nominal rates can produce diametrically opposed effects on asset valuations.
The current cycle strikingly illustrates this trap. The central scenario held by most investors assumes policy rates remain elevated while inflation gradually falls. If that trajectory holds, the real rate — the effective constraint on markets — increases mechanically even without further hikes. FRED data on 10-year real rates (TIPS yields) confirm this dynamic: the real yield on the 10-year Treasury stabilized around 2% at the end of 2025, a level not persistently seen since 2007 — a structural repricing of the real cost of capital with considerable implications for asset valuations.
Implications for reading the markets in the current cycle
If the progressive-reorganization framework is relevant, it changes the reading of several ongoing dynamics.
For valuation reading. Sustained real rates around 2% exert structural pressure on valuation multiples, especially for long-duration assets (growth stocks, commercial real estate, venture capital). If this level persists — a scenario compatible with the real cost of money framework — current valuations implicitly assume a substantial acceleration in earnings growth to justify paid premia. Any disappointment on earnings would be a repricing catalyst in a context where valuation cushions are historically thin.
For allocation between asset classes. The shift toward bonds documented by the BofA Fund Manager Survey reflects a structural rebalancing, not only tactical positioning. With a positive real bond yield for the first time in over a decade, the competition between equities and bonds to attract capital has changed. This inter-class substitution mechanism, amplified by regulatory constraints on institutional investors (Solvency II for European insurers, ALM rules for pension funds), will continue to weigh on flows to equities. The dynamic interacts with market expectations, whose variations can speed up or slow down the reallocation process.
For sectoral reading. Widening performance dispersion between sectors is the first signal of markets reorganizing around the new rate regime. Highly leveraged sectors (listed real estate, utilities, infrastructure) and long-duration growth names (unprofitable tech, biotech) bear most pressure. Conversely, sectors able to generate immediate income (energy, banks, some industrials) benefit from the flow reorientation. This sector rotation is the main adjustment mechanism — far more so than movements in aggregate indices.
Invalidation condition. This framework loses relevance if real rates quickly return to zero or negative territory, restoring the 2010–2020 conditions. That scenario would require either a major deflationary shock (deep recession, financial crisis) or renewed ultra-accommodative monetary policy (massive quantitative easing). It would also be invalidated if a productivity shock tied to AI produced sufficient earnings acceleration to justify current multiples despite a high cost of capital. Conversely, an unexpected inflation rebound or a sovereign debt confidence crisis would amplify and accelerate the repricing described.
Three time horizons to monitor transmission to markets
Short horizon (0–6 months): the path of rate expectations is the dominant factor. If the easing cycle priced by markets materializes, financial conditions will loosen and support valuations in the short term. If central banks delay a pivot — a scenario compatible with more persistent residual inflation — excessively compressed risk premia would become vulnerable to repricing. Indicators to watch: the term premium on the 10-year Treasury, bond-market volatility (MOVE), sector dispersion in the S&P 500 and the Euro Stoxx 600.
Cycle horizon (1–3 years): the structural question is the “market neutral rate” — the level of real rate consistent with current valuations over a cycle horizon. If the real rate stabilizes durably around 1.5–2%, equity multiples must converge toward cycle-adjusted historical averages for that rate regime, implying a gradual repricing of roughly 10–20% on the most exposed segments (estimates from Goldman Sachs Research, BIS). Institutional flow reallocation toward bonds will continue. Interaction with the real economic cycle will determine whether the adjustment remains orderly or crystallizes into a correction.
Structural horizon (5+ years): the current cycle may mark the end of a forty-year trend of declining interest rates — a “supercycle” documented by the BIS (Borio, 2023) and by long-run analyses from the Bank of England (Schmelzing, 2020) over eight centuries of rate history. If this regime shift is confirmed, valuation frameworks inherited from 2010–2020 (negative real rates, permanent QE, TINA — “There Is No Alternative”) must be thoroughly revised. The asset classes most sensitive to duration — private equity, commercial real estate, venture capital — would face a structural multiple adjustment. Monetary policy and its interactions with cycles would then play a permanent recalibrating role for risk premia, in an environment where the cost of capital becomes an active constraint rather than a negligible parameter.
Markets do not react to rates as to a shock — they reorganize around them. The first signal is not index declines but dispersion: between growth and income stocks, between leveraged and low-debt sectors, and between asset classes by duration sensitivity. This reorganization is ongoing, not complete. Broad indices hide a progressive adjustment of risk premia, with the equity risk premium at its lowest since 2007 and compressed credit spreads as the most visible symptoms. The most likely risk is not a crash but a slow, cumulative and uneven repricing — precisely the type of risk standard indicators detect the latest.
Robust: The transmission mechanism via discounting is a foundational principle of finance (DCF). The inverse relationship between real rates and valuation multiples is documented over a century of data (Shiller, 2000; Campbell & Shiller, 1988). The substitution effect between bonds and equities in periods of positive real rates is confirmed by allocation surveys and flow data. Increased sector dispersion during real-rate rises is observable in historical data (Bloomberg, MSCI).
Uncertain: The real-rate level that constitutes the “break point” for current valuations is debated — estimates range from 2% to 3% on the 10-year real depending on the model. The net impact of AI on future earnings (which could justify high multiples despite high rates) remains largely speculative. The speed of institutional flow reallocation is hard to predict — it depends on regulatory constraints and investment committee decisions that do not follow standard market mechanisms. The timing of any significant repricing is by nature unpredictable.
Regular monitoring of the weekly macro checkpoint allows this framework to be confronted with the most recent data on valuations, flows and financial conditions. The analysis is part of a broader decoding of financial market mechanics, where interest rates are the structuring variable around which all prices organize. Several trajectories remain open, but the progressive-reorganization reading — rather than an instantaneous reaction to announcements — offers a framework more resilient to cyclical surprises.
- Markets do not react to rates like to a shock — they reorganize around them. Interest rates are the gravitational variable that progressively redraws the balance of power between asset classes.
- The first signal of this reorganization is not index declines but dispersion: widening performance gaps across sectors, styles and duration profiles.
- The equity risk premium at its lowest since 2007 and compressed credit spreads signal a potentially incomplete adjustment of risk premia — a gap with a structurally higher real cost of capital.
- The real rate — not the nominal rate — is the determining variable. The central scenario of falling inflation and sustained policy rates implies a mechanically tighter real rate even without new hikes.
- This framework is invalidated if real rates return to zero (restoring 2010–2020 conditions) or if a productivity shock (AI) justifies current multiples despite a high cost of capital.
Mis à jour : 20 March 2026
This article provides economic and financial analysis for informational purposes only. It does not constitute investment advice or a personalized recommendation. Any investment decision remains the sole responsibility of the reader.