Inflation Explained: Regimes, Structural Drivers, and Macro-Financial Implications
Inflation is often reduced to a monthly statistic — CPI or PCE — commented on in real time by markets. This reading is misleading. Inflation is not a number, but an economic regime. It results from complex interactions between supply, demand, money, wages, energy, and geopolitics. Understanding inflation means identifying whether we are facing a transitory shock, a persistent dynamic, or a lasting structural shift.
This page offers a structured reading of inflation as a global macroeconomic phenomenon. The objective is not to anticipate the next monthly figure, but to understand the forces shaping the trajectory of prices — and their consequences for monetary policy, real rates, liquidity, real estate, and financial markets.
What is inflation?
Inflation refers to a generalized and sustained increase in prices, resulting from imbalances between supply, demand, money, and productive structures. It should not be confused with a temporary fluctuation in the price index or an isolated temporary shock, but is embedded in distinct macroeconomic regimes whose duration is measured in years, or even decades.
Two main measures coexist in the United States. The Consumer Price Index (CPI), published monthly by the Bureau of Labor Statistics, measures price changes paid by urban households. The Personal Consumption Expenditures (PCE) index, calculated by the Bureau of Economic Analysis, covers a broader basket and is the Fed’s preferred measure for calibrating monetary policy — its official target is 2% annually. In the euro area, the harmonized HICP published by Eurostat serves as the ECB’s reference, with the same 2% target.
How to read inflation on Eco3min
Analyses published on Eco3min approach inflation from multiple angles: macroeconomic regimes, transmission to real estate, interaction with monetary policy, effects on real rates, and consequences for structural imbalances. This page serves as the reference framework connecting these perspectives.
Three major inflation regimes since 1970
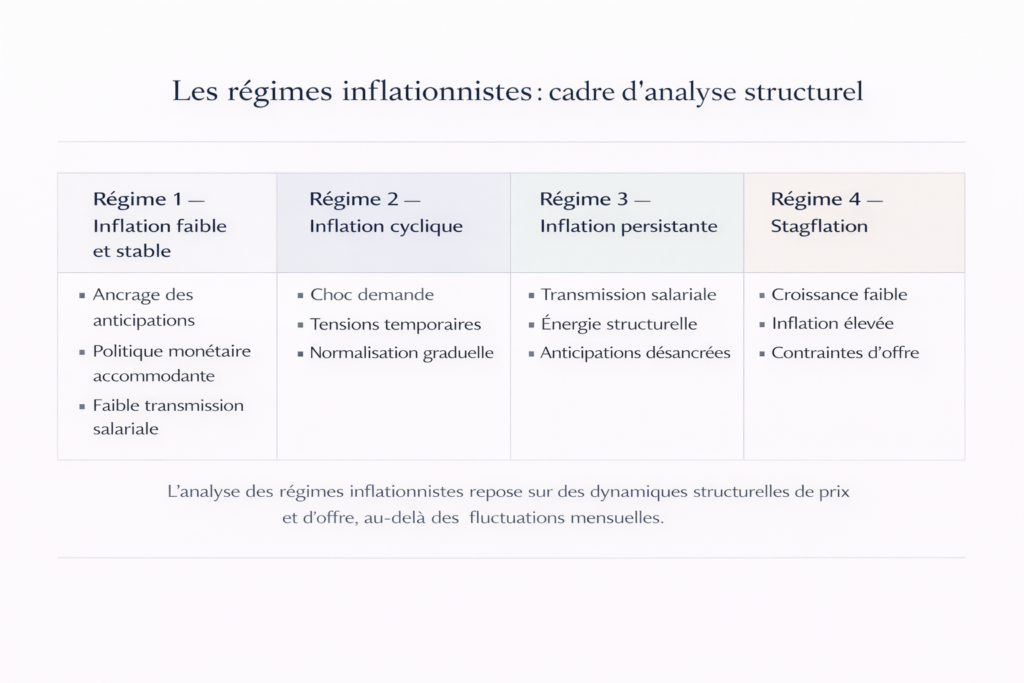
Inflation does not fluctuate randomly around a stable trend. It organizes into durable regimes whose transitions are often abrupt. Over the past fifty years, advanced economies have experienced three structurally distinct configurations — each driven by different forces and radically different economic policy responses.
1970–1985: structural inflation and de-anchoring of expectations
U.S. inflation averaged 7.4% per year between 1970 and 1982 (BLS), with two major peaks: 12.3% in December 1974 and 14.8% in March 1980. This period resulted from a convergence of forces: the 1973 and 1979 oil shocks, expansionary fiscal policies financed through monetary creation, and a wage–price spiral amplified by automatic indexation in many contracts.
The decisive element of this period was not the level of prices, but the de-anchoring of expectations. Economic agents — households, firms, unions — incorporated the assumption of persistently high inflation into their decisions, creating a self-reinforcing dynamic. The Fed’s policy rate, kept too low for too long under the leadership of Arthur Burns and then William Miller, no longer provided a credible anchor.
It took Paul Volcker’s radical tightening — the Fed Funds rate reached 20% in June 1981 (Federal Reserve) — and the severe recession that followed to break this spiral. The cost was considerable: the U.S. unemployment rate exceeded 10.8% in November 1982 (BLS). But the inflation regime shifted.
1985–2020: the Great Moderation and entrenched disinflation
Between 1985 and 2020, U.S. PCE inflation averaged around 2.1% per year (BEA). In the euro area, HICP fluctuated between 1% and 2% for most of the 2010s (Eurostat). This regime of structural disinflation rested on several pillars: central bank credibility gained through inflation targeting, globalization of production chains compressing costs, wage moderation in a globalized labor market, and deflationary technological innovation.
The paradox of this period lay in monetary policy’s inability to push inflation back up toward target. Despite policy rates at zero and massive asset purchase programs — the Fed’s balance sheet rose from $900 billion in 2008 to $4.5 trillion in 2015 (Federal Reserve) — core PCE inflation remained below 2% for most of 2012–2020. Injected liquidity flowed into financial assets rather than the real economy, fueling equity and real estate valuations without generating significant consumer price pressures.
This regime conditioned an entire generation of investors and policymakers to view low inflation as the economy’s natural state — a cognitive anchor that made the 2021–2022 shock all the more destabilizing.
2021–?: supply rupture, fiscal stimulus, and regime uncertainty
The abrupt return of inflation in 2021–2022 marked the clearest regime break in four decades. U.S. CPI reached 9.1% in June 2022 (BLS). In the euro area, HICP peaked at 10.6% in October 2022 (Eurostat), driven by the surge in energy prices following the invasion of Ukraine. In the United Kingdom, inflation exceeded 11% in October 2022 (ONS).
This shock resulted from an unprecedented configuration: massive supply bottlenecks — the New York Fed’s Global Supply Chain Pressure Index reached 4.3 standard deviations above its average in December 2021 — combined with demand artificially boosted by the largest fiscal transfers since the Marshall Plan. In the United States, three successive stimulus plans injected about $5 trillion into the economy (Committee for a Responsible Federal Budget).
The central question since 2023 concerns the regime into which advanced economies have entered. Disinflation has been rapid — U.S. CPI fell back below 3% as early as June 2023 — but the “last mile” toward the 2% target has proven more resistant. Core PCE inflation still hovered around 2.8% at the end of 2024 (BEA). This inflation residue may signal an incomplete return to the pre-2020 regime, or the emergence of a structurally higher regime — between 2.5% and 3.5% — driven by industrial reshoring, the energy transition, and geopolitical fragmentation.
This transition between regimes is analyzed in depth in our reading of the new economic cycle and in the study devoted to the risk of mild stagflation, which examines the conditions under which the economy could settle durably into a regime of weak growth and above-target inflation.
Inflation as a regime, not an event
The most common mistake is analyzing inflation as a sequence of statistical surprises. A monthly figure above consensus triggers a wave of commentary on the “return of inflation”; a figure below revives the disinflation narrative. This event-driven reading misses the essential.
In reality, economies evolve within distinct inflation regimes, characterized not by the instantaneous level of prices but by the stable combination of several variables: inflation level and volatility, anchoring of expectations, wage dynamics, firms’ pricing power behavior, and central bank stance. The same 3% inflation rate may belong to two radically different regimes depending on whether long-term expectations remain anchored at 2% or drift toward 4%.
New York Fed surveys show that one-year inflation expectations among U.S. households jumped from 3.0% in January 2021 to 6.8% in June 2022, before falling back toward 3.0% by the end of 2024. Five-year expectations, however, remained relatively stable around 2.5–3.0% throughout the period — an indicator that a full 1970s-style de-anchoring has not (yet) occurred.
Confusing a temporary slowdown in inflation with a durable return to the pre-2020 disinflation regime. The 2023–2024 disinflation partly reflects supply chain normalization and lower energy prices — mechanical factors that do not prejudge the underlying structural regime.
The deep drivers of inflation
Inflation rarely results from a single factor. It emerges from the combination of several forces whose relative weight varies across cycles: supply bottlenecks, energy shocks, real wage dynamics, excess or scarcity of liquidity, and geopolitical fragmentation. Inflation diagnosis consists of identifying which force dominates — and whether their interaction produces a self-sustaining dynamic or a transitory adjustment.
The labor market: the decisive link
Inflation durably above target requires transmission to wages. Without this feedback loop, supply shocks eventually fade mechanically — which explains why the Fed monitors unit labor costs as closely as CPI itself. In the United States, average hourly earnings rose 5.9% year-over-year in March 2022 (BLS), a pace incompatible with 2% inflation, before slowing toward 3.9% by late 2024.
However, labor market interpretation is itself tricky. The phenomenon of hidden unemployment behind apparent tightness shows why wage pressures may be misread: a low unemployment rate does not necessarily mean a tight labor market if participation remains depressed or hours worked stagnate.
Margins and productivity: the buffer or the amplifier
On the corporate side, margins act as the buffer between costs and prices. During an inflation shock, firms with market power (pricing power) fully — or even more than fully — pass cost increases on to selling prices. The debate on “greedflation” (margin-driven inflation), fueled by economist Isabella Weber’s research and ECB data on euro area unit margins, highlighted this dynamic in 2022–2023.
Over the longer term, productivity determines compatibility between wage growth and price stability. Productivity rising by 2% annually can absorb equivalent wage increases without inflationary pressure. When productivity stagnates — as it has for about fifteen years in most advanced economies — any wage increase mechanically translates into higher unit costs. This dynamic is detailed in the analysis of the productivity shock as an underestimated macro risk.
Inflation and real rates: the structuring variable
The real interest rate — nominal rate minus expected inflation — is the central transmission variable between inflation and the real economy. Real rates, not nominal rates, determine the effective cost of credit, asset valuation, and investment incentives.
During the 2010s, real rates remained negative or near zero across advanced economies despite already low inflation — a configuration that fueled financial and real estate asset price inflation. The real yield on the 10-year Treasury, measured by TIPS, remained negative from 2012 to 2022 (Federal Reserve). The 2022–2023 shift was abrupt: U.S. 10-year real rates rose back above 2%, a level unseen since 2007.
This return of positive real rates profoundly alters the macro-financial environment. The cost of capital becomes constraining again, discounting of future cash flows weighs on valuations, and credit effectively tightens — mechanisms that transmit inflation to the real economy well beyond its direct impact on household purchasing power. The Monetary policy and rates pillar page details these transmission channels.
Inflation and real estate: a critical threshold
Real estate is one of the main transmission channels of inflation to the real economy — and one of the most lagged. The “shelter” component (rents and owners’ equivalent rent) accounts for about one-third of U.S. CPI (BLS), making it the single largest category. Its statistical measurement embeds a structural lag of 12 to 18 months relative to effective market rents, which can artificially keep measured inflation elevated even as real pressures are already easing.
Beyond the mechanical index effect, inflation affects the real estate market through the rate channel. When inflation exceeds a certain threshold, rising real rates and tighter credit eventually reverse property price dynamics. The U.S. 30-year fixed mortgage rate rose from 2.65% in January 2021 to a peak of 7.79% in October 2023 (Freddie Mac) — a tripling in less than three years that froze transactions without a major price correction, creating a “locked” market.
This shift is analyzed in our study on the macro threshold of real estate inflation. It shows why persistent inflation is not necessarily favorable to real assets, contrary to common belief. The real estate cycle follows its own dynamics, which interact with the inflation regime but cannot be reduced to it.
Inflation and monetary policy: an asymmetric relationship
Inflation shapes central bank responses, but with lags, structural biases, and a fundamental asymmetry. Monetary authorities typically react late to accelerating inflation — the Fed maintained the adjective “transitory” for more than nine months in 2021 — then compensate with abrupt tightening: a 525-basis-point increase in 16 months between March 2022 and July 2023, the fastest tightening cycle since the early 1980s.
This asymmetry is not accidental. It results from multiple mandates (employment and price stability), aversion to Type II errors (tightening too early and causing an unnecessary recession), and the intrinsic difficulty of distinguishing in real time a transitory shock from a regime shift. The market impact of these decisions is analyzed in our study on monetary tightening and financial markets.
Expectations play a key role here. Inflation perceived as persistent alters behavior well before formal rate decisions: firms adjust prices, workers negotiate catch-up raises, lenders demand higher term premiums. This is why the Fed places considerable weight on inflation expectation measures — whether surveys (Michigan, New York Fed) or market indicators (breakeven inflation, inflation swaps).
In the current cycle, central banks in 2026 face a dilemma with no exact precedent: easing too quickly risks re-anchoring an inflation regime above target; maintaining restrictive rates for too long could precipitate a slowdown that lagging data would only reveal with a delay of several quarters.
Inflation, debt, and liquidity: systemic interactions
Inflation does not evolve in isolation. It interacts with two macro-financial variables whose influence is often underestimated in cyclical analysis: debt stock and global liquidity conditions.
Public debt levels in advanced economies — averaging 122% of GDP across G7 countries in 2024 (IMF, Fiscal Monitor) — create structural tension with the objective of disinflation. Persistently positive real rates mechanically increase interest burdens and constrain fiscal margins. In the United States, net federal interest payments exceeded $880 billion in fiscal year 2024 (Congressional Budget Office), more than the Defense budget. This configuration creates an implicit — rarely acknowledged — incentive to tolerate moderately above-target inflation to erode the real value of debt.
On the liquidity side, the inflation regime shapes how the financial system operates. In a disinflationary regime, abundant liquidity compresses risk premiums and lifts valuations. In an inflationary regime, the same liquidity can fuel an asset-price spiral that complicates monetary steering. The Financial Markets cluster explores these dynamics in the context of current market conditions.
Inflation is not read in a monthly figure, but in the consistency between wages, energy, real rates, money, and economic policy. The relevant diagnosis is not “inflation is rising or falling,” but “which regime are we in?” Since 2021, the answer remains open — and it is precisely this regime uncertainty that shapes all contemporary macro-financial trade-offs.
Explore the framework — Inflation and macro-financial regimes
This sub-pillar is part of a network of analyses that shed light on the different facets of the inflation phenomenon and its systemic interactions:
- Mild stagflation: the underestimated macro risk — When weak growth and persistent inflation coexist.
- The new economic cycle — Structural singularities of the post-Covid cycle and their inflation implications.
- Real estate inflation: the macro threshold — How inflation alters property price dynamics beyond a certain real-rate level.
- Monetary tightening and financial markets — The channels through which the fight against inflation transmits to valuations.
- Productivity shock: the hidden risk — Why slowing productivity makes inflation structurally harder to control.
← Back to the pillar page Macroeconomics and geopolitics