The Most Revised Number in Finance: How NFP Revisions Systematically Mislead at Turning Points (1980–2026)

Every month, the Bureau of Labor Statistics releases a number that moves trillions of dollars within seconds. Every month, that number is wrong — and at business cycle turning points, it is wrong in the same direction.
Nonfarm payrolls are the most market-moving economic data release in the world — yet the initial estimate is revised in 98% of cases. This study examines 345 months of BLS revision data from 1980 to 2026 and reveals a systematic directional bias: during the six months surrounding recession starts, 71% of revisions are downward, with a mean revision of −24,000 jobs per month. The dataset provides initial release, second estimate, and final revised values for every monthly NFP report, alongside NBER recession dating, forward S&P 500 returns, and the proprietary revision-gap analysis that does not exist in any single public source.
The initial NFP release systematically overstates job creation during recession windows: 71% of revisions are downward within ±6 months of recession starts, with a mean revision of −24,000 jobs. During normal periods, revisions are split roughly 58% upward / 42% downward. In 2025, all 11 months with final data were revised downward, with a cumulative −638,000 jobs erased — the worst revision year since 2008. The March 2025 preliminary annual benchmark revision was −911,000 jobs, the largest in at least two decades.
Payrolls Level
Monthly Change
3-Month MA
12-Month MA
- During the six months surrounding each NBER recession start date since 1980, 71% of NFP revisions have been downward, compared with 42% during normal expansion periods. The mean revision during these windows is −24,000 jobs per month, versus +12,000 during normal periods. This is not noise — it is a systematic directional bias embedded in the BLS survey methodology.
- In 2025, all 11 months with completed revision cycles were revised downward, with a cumulative −638,000 jobs erased from initial releases. Three months experienced sign reversals — the initial release showed job gains, but the final estimate showed job losses: June (+147K → −13K), August (+22K → −26K), and December (+50K → −17K).
- The BLS annual benchmark revision for March 2024 was −589,000 jobs (final, released February 2025). The preliminary benchmark for March 2025 is −911,000 jobs — the largest negative preliminary revision in at least two decades. These consecutive downward benchmarks suggest the CES birth-death model has been systematically overstating employment since at least 2023.
- The largest single-month revision in the dataset was −672,000 in March 2020, when the initial estimate of −701,000 was revised to −1,373,000 — the initial release understated the actual job loss by nearly 50%. The second-largest was September 2008 (−244,000), when the GFC was already underway but the initial data masked its severity.
- The current monthly change of +178,000 (March 2026 initial release) sits at the 54th percentile of all monthly observations, near the historical median. However, the 12-month moving average has decelerated to +22,000 — the slowest pace outside of a recession since the early 2000s, largely reflecting the heavy negative revisions to 2025 data.
1,047 monthly observations · CC BY 4.0 · Updated monthly · Methodology · Cite this dataset
Monthly Obs.
Revision Obs.
Mean Abs. Revision
Recession Window Mean
Downward in Recessions
2025 Benchmark Rev.
Chart: US Nonfarm Payrolls Monthly Change — Initial Release vs Final Revised Value (1980–2026)
Nonfarm Payrolls: Monthly Change with Recession Shading
1,047 monthly observations from January 1939. NBER recession periods shaded. Data: BLS PAYEMS via FRED.

The visual pattern is deceptive: what appears as a smooth deceleration into recession was, in real time, masked by initial releases that were systematically too optimistic. The revision gap — the distance between what policymakers saw and what actually happened — is the analytical contribution of this dataset.
Sources: U.S. Bureau of Labor Statistics, FRED (PAYEMS), NBER recession dates. Chart: Eco3min Research.
How to Read This Chart
Each bar represents the final revised monthly change in total nonfarm payrolls (thousands of persons, seasonally adjusted) from the BLS establishment survey. Gray shaded areas indicate NBER-dated recessions. The chart excludes April–June 2020 extremes from the visible range for readability (April 2020: −20,787K; May 2020: +2,725K; June 2020: +4,781K).
What the chart does not show is equally important: the initial release values — what markets and policymakers actually saw in real time — were systematically different from these final numbers. That gap is the subject of this study. For context on how the monthly payrolls figure connects to broader labor market dynamics, see our unemployment rate dataset and initial jobless claims series.
The Systematic Revision Bias: Why NFP Is Wrong in One Direction at Turning Points
The conventional understanding of NFP revisions treats them as noise — symmetrical, unpredictable, and averaging to zero over time. The overall mean revision since 1980 is indeed only +5,000 per month, which appears to vindicate this view. But this average conceals a critical asymmetry: the distribution of revision direction is dramatically different depending on where you are in the business cycle.
| Period | Months | Mean Revision | % Downward | Mean Abs. Revision |
|---|---|---|---|---|
| Recession window (±6m) | 68 | −24K | 71% | 53K |
| Normal expansion | 277 | +12K | 42% | 49K |
| All periods | 345 | +5K | 48% | 49K |
The dominant narrative holds that NFP revisions are symmetric noise that averages out. The data tells a different story: during the 68 months falling within ±6 months of an NBER recession start date, 71% of revisions were downward, with a mean of −24,000 — compared with 42% downward and a mean of +12,000 during normal expansions. The initial release systematically overstates job creation precisely when policymakers need accurate data most.
The mechanism is structural, not random. The BLS Current Employment Statistics (CES) survey relies on two components: a sample of approximately 119,000 establishments, and a birth-death model that estimates employment changes from business formations and closures. During recessions, the birth-death model systematically overestimates new business formation — because its statistical inputs lag the real economy by 6 to 12 months. The result is a predictable upward bias in the initial release during periods of deterioration, corrected only months later when the quarterly unemployment insurance (UI) tax records become available. For a broader perspective on how this mechanism connects to monetary policy decisions, see the Federal Funds Rate history — the Fed is making rate decisions based on data that will be revised.
Revision Direction by Recession Episode
| Recession | Window | n | Mean Rev. | Cumulative | Sign Reversals |
|---|---|---|---|---|---|
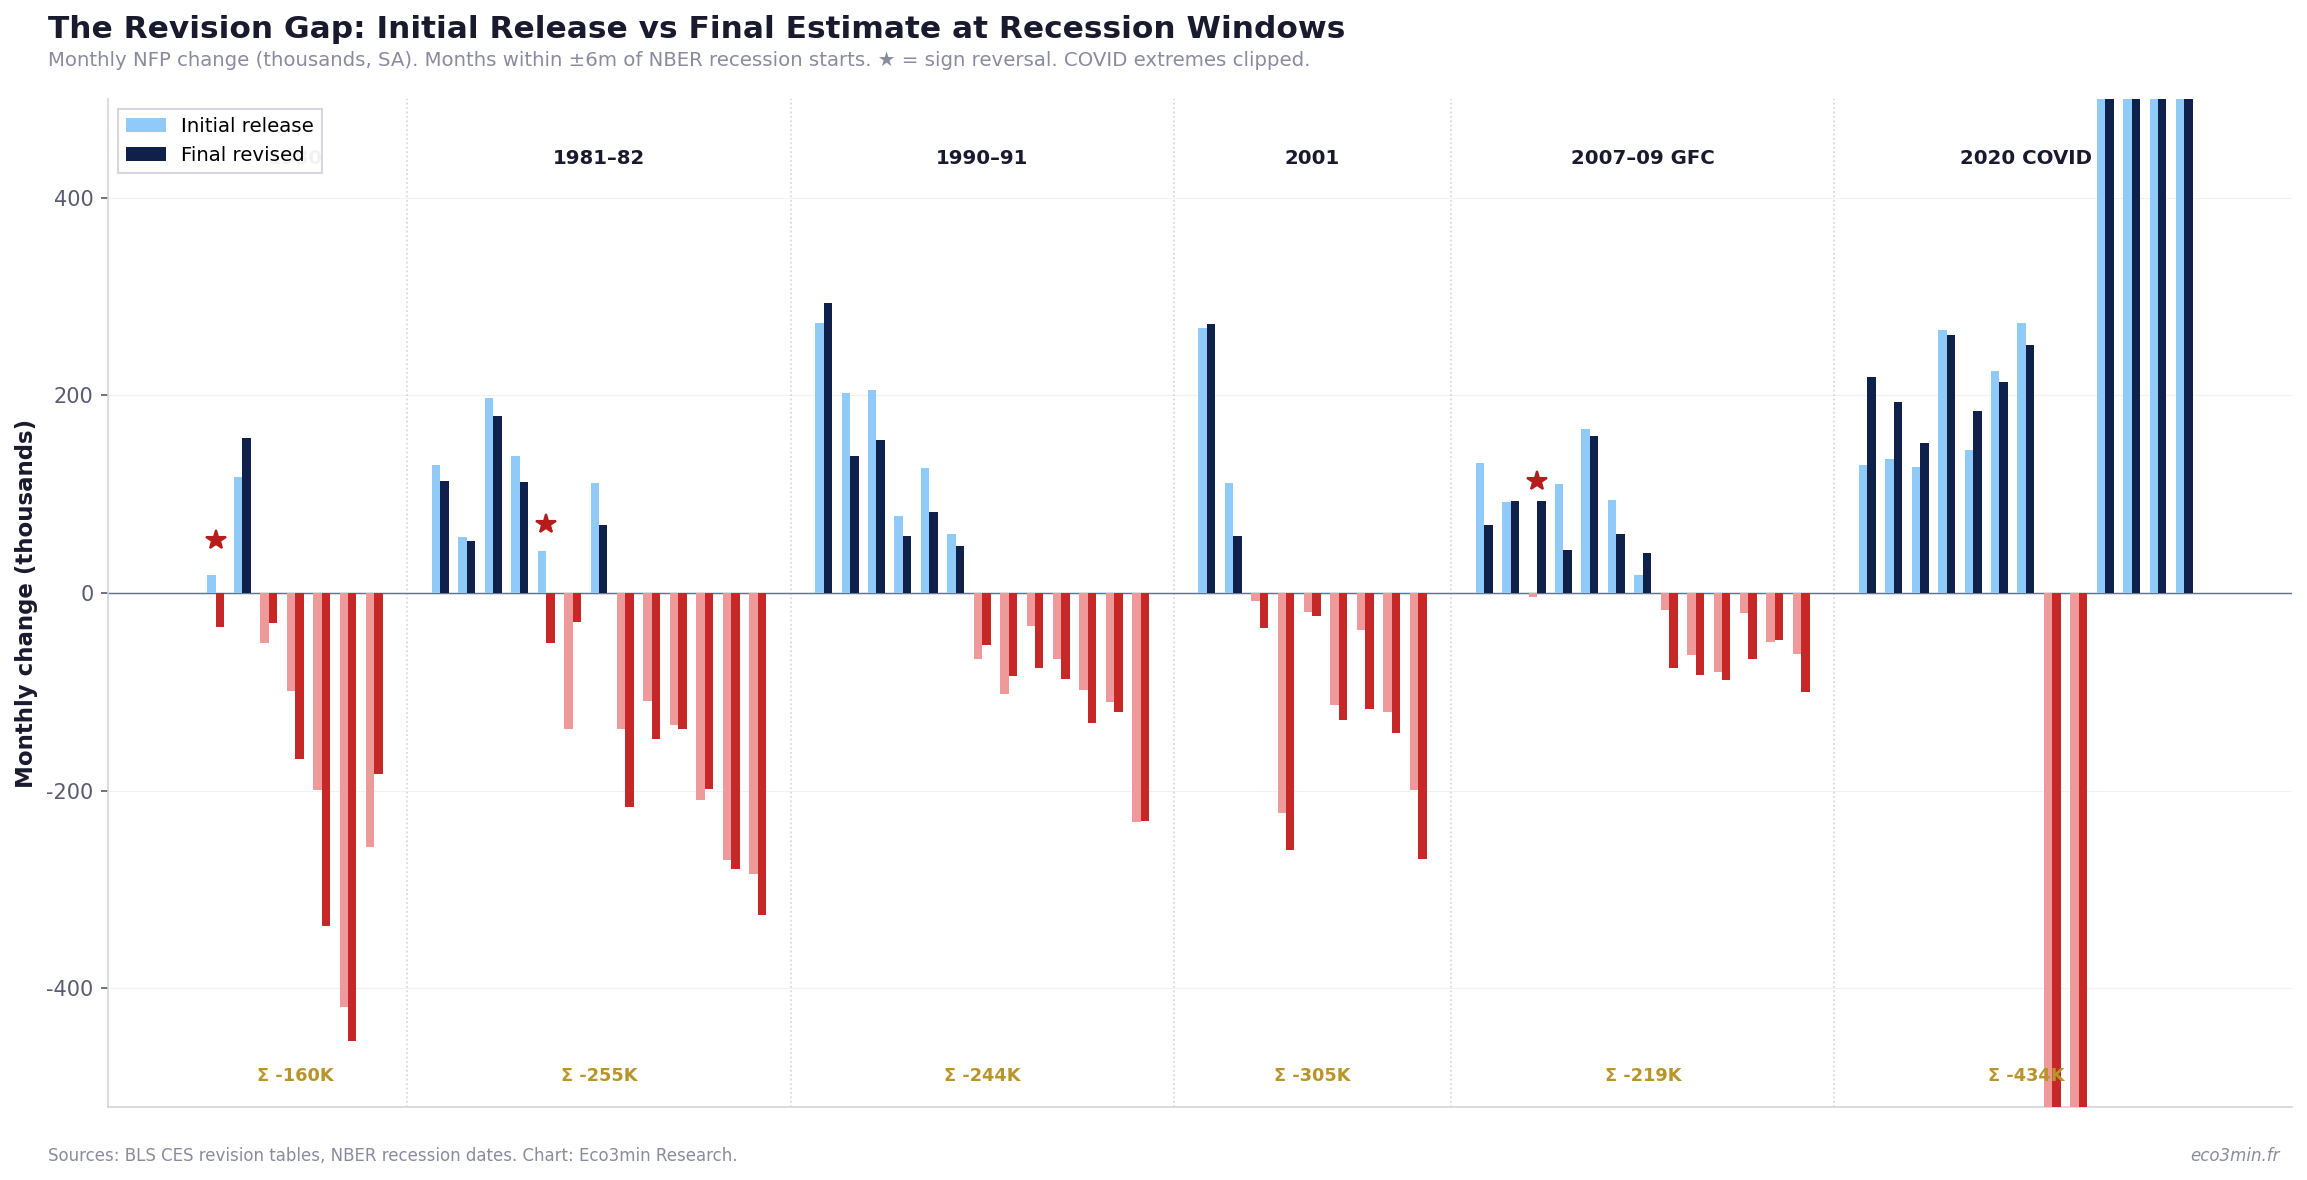
| Jan 1980 | Jul 79 – Jul 80 | 7 | −23K | −160K | 1 |
| Jul 1981 | Jan 81 – Jan 82 | 13 | −20K | −255K | 1 |
| Jul 1990 | Jan 90 – Jan 91 | 13 | −19K | −244K | 0 |
| Mar 2001 | Sep 00 – Sep 01 | 9 | −34K | −305K | 0 |
| Dec 2007 | Jun 07 – Jun 08 | 13 | −17K | −219K | 1 |
| Feb 2020 | Aug 19 – Aug 20 | 13 | −33K | −434K | 0 |
The pattern is remarkably consistent across six recessions spanning 40 years and five Fed chairs. The mean revision is negative in every single episode. The cumulative downward revision ranges from −160,000 (the short 1980 recession) to −434,000 (the COVID recession). This consistency rules out coincidence and points to a structural feature of the BLS methodology.
Sign reversals — months where the initial release showed job gains but the final estimate showed losses — are particularly consequential because they directly mislead policy. Three such reversals occurred during recession windows: January 1980 (+18K → −34K), May 1981 (+43K → −50K), and August 2007 (−4K → +93K, a rare upward reversal). For context on how credit markets were simultaneously signaling stress during several of these episodes, see our credit spread leading indicator analysis.
Anatomy of a Revision: The 2007–2009 GFC and the 2024–2025 Anomaly
The GFC Template: September–December 2008
The four months from September to December 2008 illustrate the revision mechanism at its most consequential. In real time, the September employment report (released October 3, 2008 — just as Lehman’s aftershocks were rippling through global markets) showed a loss of 159,000 jobs. The number was bad, but not catastrophic. It was revised to −403,000 — a downward revision of 244,000, the second-largest in the dataset. October, November, and December followed the same pattern, with cumulative revisions of −183K, −64K, and −157K respectively.
By the time the final estimates were available, the four-month total was −2,104,000 — but the initial releases had only shown −1,456,000. The initial data had understated the job loss by 45%. The Federal Reserve, Congress, and markets were calibrating their responses to a labor market that was 648,000 jobs weaker than anyone in real time could see. For the complete timeline of how the Fed’s balance sheet expansion responded to this data, that gap in information was consequential.
The 2024–2025 Anomaly: A Living Case Study
The current revision cycle is producing results that rhyme uncomfortably with pre-recession patterns. In 2025, all 11 months with completed revision data were revised downward — a feat not seen since 2008. The mean revision of −58,000 is the most negative annual average in the post-2003 dataset.
| Month | Initial | Final | Revision | Direction |
|---|---|---|---|---|
| Jan 2025 | +143K | +111K | −32K | ↓ |
| Feb 2025 | +151K | +102K | −49K | ↓ |
| Mar 2025 | +228K | +120K | −108K | ↓ |
| Apr 2025 | +177K | +158K | −19K | ↓ |
| May 2025 | +139K | +19K | −120K | ↓ |
| Jun 2025 | +147K | −13K | −160K | ↓ sign reversal |
| Jul 2025 | +73K | +72K | −1K | ↓ |
| Aug 2025 | +22K | −26K | −48K | ↓ sign reversal |
| Nov 2025 | +64K | +41K | −23K | ↓ |
| Dec 2025 | +50K | −17K | −67K | ↓ sign reversal |
Three months in 2025 experienced sign reversals — initial releases showing job creation that was later revised to job losses. June 2025 is the most striking: the initial release of +147,000 was revised to −13,000, a swing of 160,000 jobs. In real time, markets celebrated the June jobs report. In reality, the economy was contracting. This is the revision gap at its most dangerous.
The pattern extends to the annual benchmarks. The BLS benchmark revision for March 2024 removed 589,000 jobs from the previously published totals — meaning the employment situation throughout 2023–2024 was materially weaker than the real-time data suggested. The preliminary benchmark for March 2025, announced in September 2025, is an even larger −911,000. These are not normal recalibrations — the 10-year average absolute benchmark revision is 0.2% of total employment, equivalent to roughly 300,000 jobs. Consecutive revisions of −589,000 and −911,000 are historically anomalous. For how these revisions interact with broader financial conditions, see our NFCI dataset.
Annual Benchmark Revisions: The Structural Correction Mechanism
The monthly revision process (initial → second → third estimate) is only part of the story. Once a year, the BLS benchmarks the entire CES series against the Quarterly Census of Employment and Wages (QCEW), which uses administrative records from the unemployment insurance system covering 97% of nonfarm payroll workers. This benchmark is the “gold standard” — but it arrives 12 to 15 months after the reference period.
| Benchmark Year | Revision (thousands) | % of Employment | Direction |
|---|---|---|---|
| March 2019 | −505 | −0.3% | ↓ |
| March 2024 | −589 | −0.4% | ↓ |
| March 2025 (prelim.) | −911 | −0.6% | ↓ |
The March 2025 preliminary benchmark of −911,000 deserves particular attention. It represents the largest preliminary downward revision since the BLS began publishing this data in the current format. A Congressional Research Service report noted that this figure reflects two primary error sources: response bias (establishments responding to the CES survey had higher employment than non-respondents) and birth-death model overshoot (the model overestimated new business formation during a period of elevated business closures).
When the March 2025 benchmark is finalized and incorporated into the January 2027 employment report, it will retroactively reduce the job creation totals for the April 2024 through March 2025 period by roughly 911,000. If the historical pattern holds, some of this revision will be distributed backward into prior months, further weakening the already-revised 2024 data. The labor market was materially weaker than the real-time data indicated throughout 2024 and 2025.
The practical consequence for users of this dataset is significant: any analysis of the 2024–2025 labor market using currently published PAYEMS values should be treated as preliminary. For a deeper analysis of how the M2 money supply and M2 growth rate interact with employment trends, the revision pattern matters — the monetary-employment transmission channel was operating in an environment where the employment data was systematically overstated.
Chart: The Revision Gap — Initial Release vs Final Estimate at Recession Windows
NFP Revision Gap: Initial vs Final Estimate During Recession Windows
Months falling within ±6 months of NBER recession start dates, 1980–2025. Each pair shows the initial release (left) and final revised value (right).

The revision gap is not random. In 6 out of 6 recession episodes, the cumulative revision during the ±6-month window was negative, ranging from −160K (1980) to −434K (2020). The initial release consistently painted a less dire picture of the labor market than the final data would eventually reveal.
Sources: U.S. Bureau of Labor Statistics (CES revision tables), NBER recession dates. Chart: Eco3min Research.
Revision Regime Classification
To make the revision data analytically actionable, we classify each month into one of four revision regimes based on the magnitude and direction of the total revision (3rd estimate minus 1st estimate):
Historically concentrated during and immediately around recessions. The 2008 GFC produced five consecutive months in this regime (Sep 08 – Jan 09). The 2025 data has produced five months in this regime — an alarming frequency for a non-recessionary period.
The most common category during late-cycle periods. Often the first signal that the birth-death model is losing accuracy. During the 12 months before the 2001 recession start, 8 fell in this category.
The typical revision regime during healthy expansions. The mean revision in this band is +19K. Historically associated with periods of steady job growth and low economic uncertainty.
Most common during recoveries and economic booms. The 2021 post-COVID recovery produced 11 out of 12 months in this category, with a mean revision of +159K — the BLS was systematically underestimating the speed of the rebound.
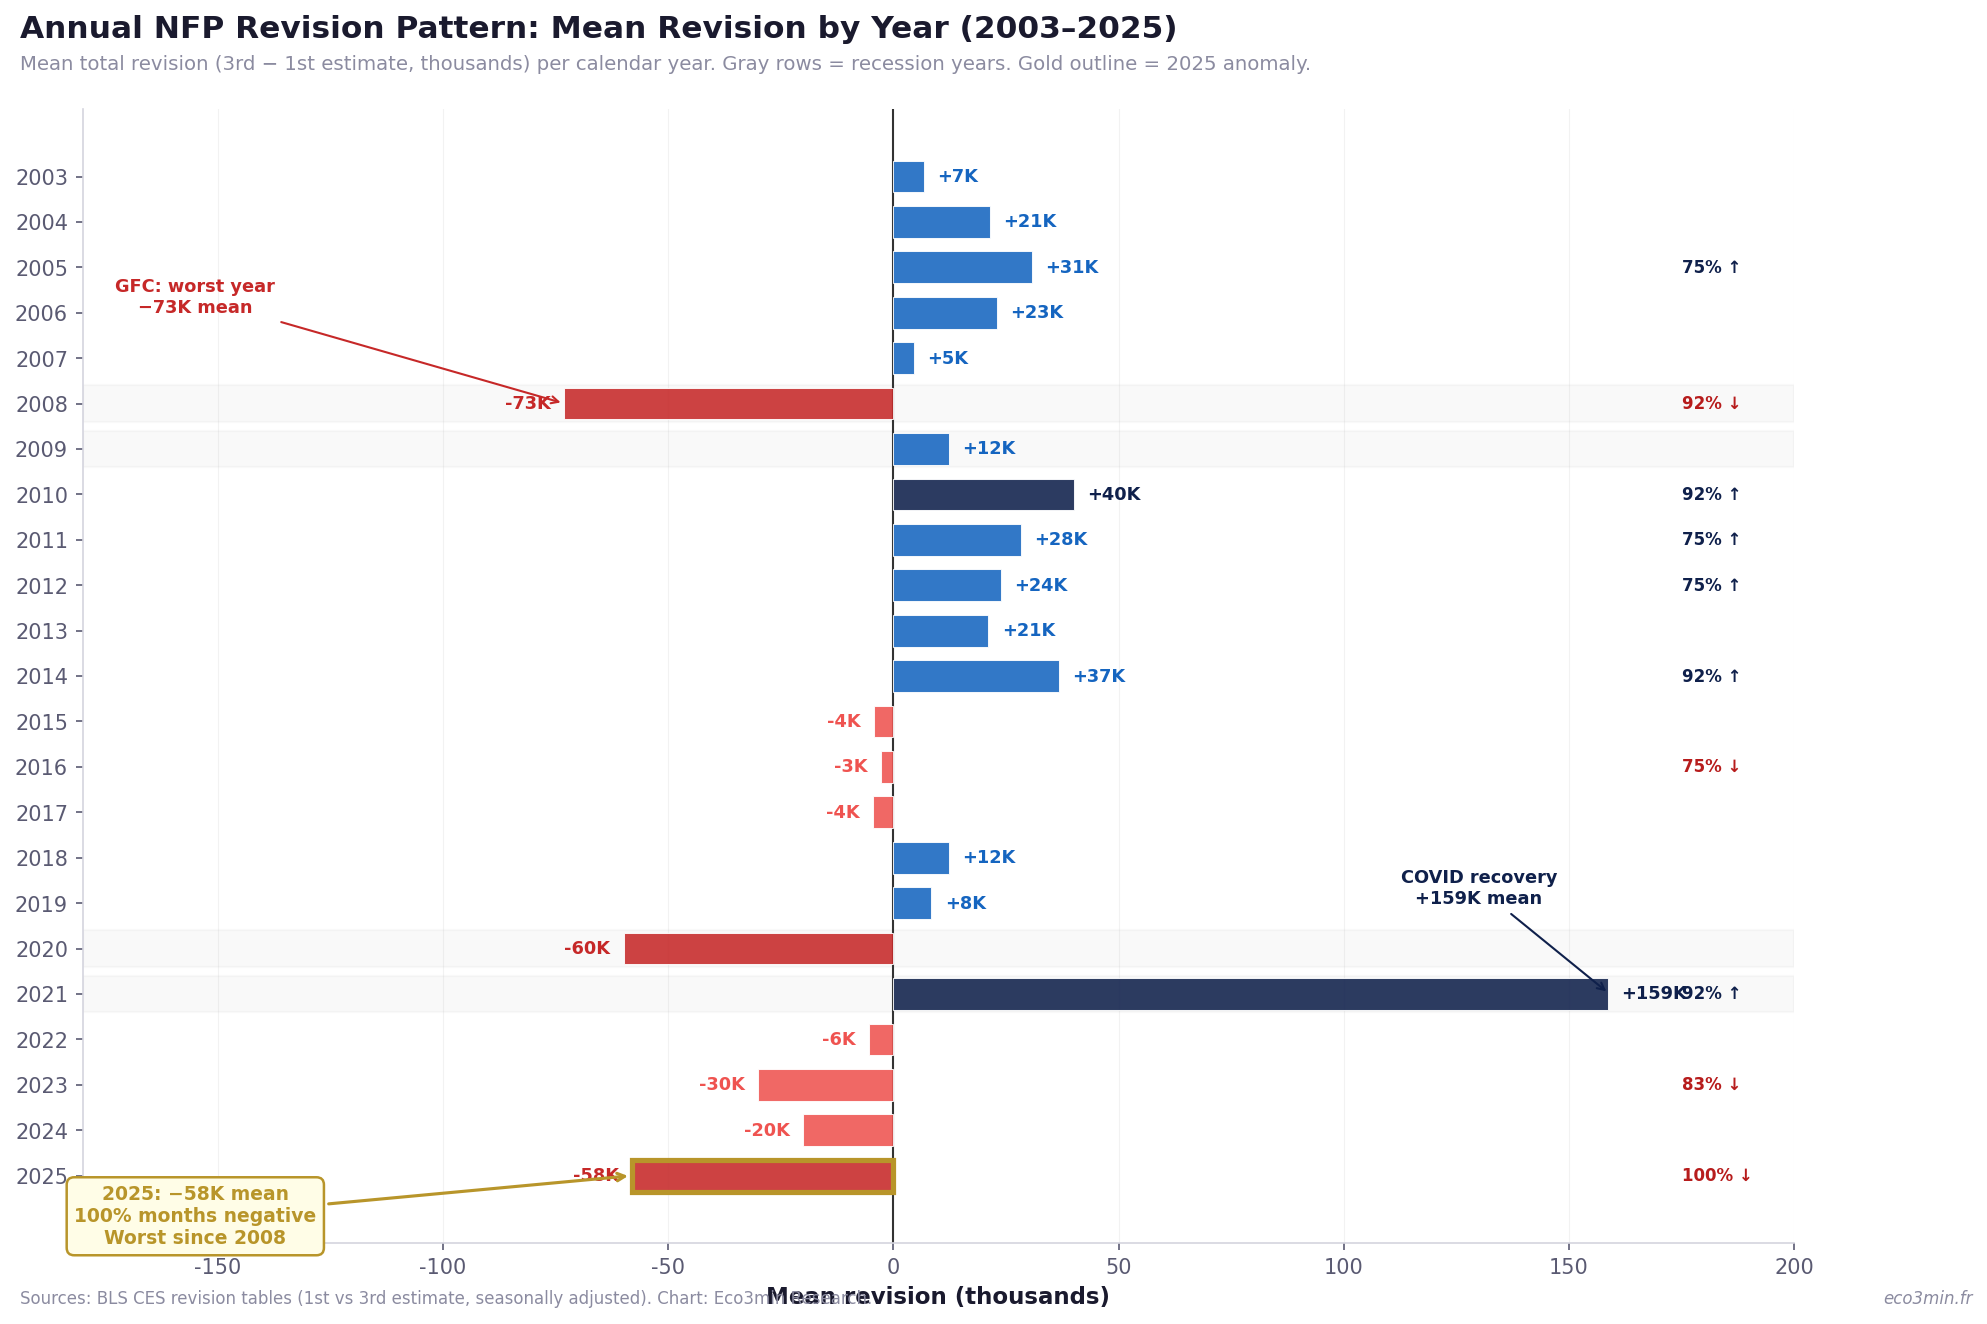
Chart: Annual Revision Pattern by Year (2003–2025)
Annual NFP Revision Pattern: Mean Revision by Year
Mean total revision (3rd − 1st estimate, thousands) per calendar year. Gray rows = recession years. Gold outline = 2025 anomaly.

The 2025 revision pattern (mean −58K, 100% of months negative) is nearly as extreme as 2008 (mean −73K, 92% negative) — yet 2025 has not been classified as a recession by the NBER. Either the revision mechanism is producing a false alarm of unprecedented magnitude, or the real-time data is masking a deterioration that will only become visible retrospectively. The historical record offers no precedent for a non-recessionary year with this revision profile.
Sources: BLS CES revision tables (1st vs 3rd estimate, seasonally adjusted). Chart: Eco3min Research.
What Happened Next? Forward S&P 500 Returns by NFP Band
To connect NFP data to equity outcomes, we classify each monthly observation by the magnitude of the (final revised) monthly change and compute the forward 6-month and 12-month S&P 500 return from each observation date. The results challenge the simple intuition that bad jobs data leads to bad markets.
| NFP Band | n | Median 6m | Median 12m | P25–P75 (12m) | % Positive 12m |
|---|---|---|---|---|---|
| Deep Contraction (< −100K) | 45 | +7.7% | +11.6% | −19.2% to +26.4% | 62% |
| Mild Contraction (−100K to 0) | 36 | +0.5% | +9.1% | −4.2% to +17.9% | 67% |
| Weak Growth (0 to +100K) | 68 | +4.7% | +9.9% | +3.5% to +14.2% | 79% |
| Moderate Growth (+100K to +200K) | 120 | +7.5% | +13.9% | +7.0% to +22.2% | 85% |
| Strong Growth (+200K to +300K) | 130 | +6.4% | +12.4% | +3.6% to +21.0% | 83% |
| Boom (> +300K) | 84 | +5.1% | +12.0% | +2.3% to +23.5% | 80% |
Deep contraction months (NFP change below −100K) produce a median 12-month S&P 500 return of +11.6%, with 62% positive — driven by the fact that extreme job losses tend to coincide with policy responses (rate cuts, fiscal stimulus) that support equity recoveries. The highest median return comes from moderate growth months (+13.9%), reflecting the “Goldilocks” dynamic: strong enough to sustain earnings, weak enough to keep monetary policy accommodative.
The overlapping-window methodology means adjacent months share most of their forward return period, introducing autocorrelation. Point estimates are reliable, but confidence intervals should use Newey-West standard errors with at least 12 lags. For a more granular view of how equity returns relate to monetary conditions, see the real interest rates vs CAPE ratio study.
Past distributions are not predictive of future outcomes. Regime-conditional statistics describe historical patterns, not expected returns.
- ▸ 12-month MA at +22K: a sustained move below zero would signal net job losses on a rolling annual basis — last occurrence: 2009–2010. The current deceleration from +136K (12-month average ex-COVID) to +22K is the fastest outside of a recession since 2001.
- ▸ 2025 revision pattern: if the final March 2025 benchmark (due February 2027) confirms or exceeds the preliminary −911K, it would retroactively place several months of 2024–2025 in negative territory — potentially triggering a retrospective recession dating discussion.
- ▸ Next Employment Situation: April 2026 data, scheduled for release May 8, 2026. February 2026 will receive its final revision in this release (currently at −133K after a −41K downward revision from the initial −92K).
- ▸ NBER recession dating: the Business Cycle Dating Committee has historically waited 6–12 months after a recession begins before making its determination, relying on revised data. If a recession began in late 2025, announcement would be expected in mid-to-late 2026.
Historical Turning Points: Five Episodes of Consequential Revision
1. January 1980: The False Positive
The January 1980 employment report showed a gain of +18,000 jobs — a reassuring number amid growing recession fears. The final estimate: −34,000. The NBER would later date the recession start to January 1980. Policymakers saw growth; the economy was already contracting. For a broader view of how the Federal Funds Rate was being adjusted during this episode, the false positive in payrolls data likely contributed to the delayed policy response.
2. September 2008: The GFC Understatement
The September 2008 initial release of −159,000 suggested a meaningful but manageable deterioration. The final figure: −403,000 — a downward revision of 244,000, the largest non-COVID revision in the dataset. This report was released on October 3, 2008 — one and a half weeks after Lehman Brothers filed for bankruptcy. The data that was supposed to inform the policy response was understating the damage by more than 60%.
3. March 2020: The COVID Blind Spot
The COVID recession produced the largest single-month revision in history: the March 2020 initial release of −701,000 was revised to −1,373,000. The revision of −672,000 reflects the extreme difficulty of surveying establishments during a sudden economic stop. The BLS was transparent about the measurement challenges, but the practical consequence was the same: Congress was calibrating fiscal relief packages based on data that understated the job loss by 96%.
4. 2024–2025: The Silent Revision
Unlike the dramatic single-month revisions of past recessions, the 2024–2025 revision pattern is gradual and cumulative. No individual month produced a revision exceeding −160K, but the persistence is unprecedented: all 11 months of 2025 with final data were revised downward. The cumulative −638K, combined with the −589K March 2024 benchmark and the preliminary −911K March 2025 benchmark, suggests that the labor market trajectory from 2023 to 2025 was materially weaker than the real-time data indicated. The ISM Manufacturing PMI was concurrently signaling contraction in the manufacturing sector, corroborating the revision direction.
5. Current Observation: March 2026
The March 2026 Employment Situation report showed +178,000 jobs — a rebound from the revised −133,000 in February (initially reported as −92,000, since revised down by 41,000). The healthcare sector added 76,000 jobs as striking workers returned. Given the 2025 revision pattern, the question is not whether March 2026 will be revised, but by how much and in which direction. The 12-month moving average of +22,000 is the key metric to watch.
Methodology & Dataset Design
This dataset merges three public sources into a single panel that does not exist elsewhere: the FRED PAYEMS series (total nonfarm payrolls level), the BLS CES revision tables (initial, second, and final over-the-month change estimates), and NBER recession dating. Forward S&P 500 returns are computed from Yahoo Finance monthly close data.
| Variable | Type | Unit | Source | Notes |
|---|---|---|---|---|
| date | date | YYYY-MM-DD | — | First of month |
| payems | float | Thousands | FRED PAYEMS | Final revised level |
| monthly_change | float | Thousands | Derived | payems[t] − payems[t−1] |
| monthly_change_3m_ma | float | Thousands | Derived | 3-month rolling mean |
| monthly_change_12m_ma | float | Thousands | Derived | 12-month rolling mean |
| payems_yoy_change | float | Thousands | Derived | Year-over-year level change |
| payems_yoy_pct | float | % | Derived | Year-over-year % change |
| initial_release_change | float | Thousands | BLS CES | First preliminary estimate |
| second_estimate_change | float | Thousands | BLS CES | Second estimate |
| final_estimate_change | float | Thousands | BLS CES | Third/final sample estimate |
| revision_total | float | Thousands | Derived | 3rd − 1st estimate |
| revision_pct_of_initial | float | % | Derived | Revision as % of |initial| |
| sign_reversal | int | 0/1 | Derived | 1 if sign(initial) ≠ sign(final) |
| nfp_band | str | Category | Derived | NFP change regime classification |
| nber_recession | int | 0/1 | NBER | 1 during NBER recession |
| recession_window_6m | int | 0/1 | Derived | 1 if within ±6m of recession start |
| expansion_months | int | Months | Derived | Months since last recession end |
| sp500_close | float | Index | Yahoo Finance | Monthly close |
| sp500_fwd_6m_pct | float | % | Derived | 6-month forward S&P 500 return |
| sp500_fwd_12m_pct | float | % | Derived | 12-month forward S&P 500 return |
Reproduction Code
import pandas as pd
import numpy as np

# Load PAYEMS from FRED
payems = pd.read_csv('PAYEMS.csv', parse_dates=['DATE'])
payems.columns = ['date', 'payems']
payems['monthly_change'] = payems['payems'].diff()

# BLS revision data from:
# https://www.bls.gov/web/empsit/cesnaicsrev.htm
rev = pd.read_csv('bls_revisions.csv', parse_dates=['date'])
rev['revision_total'] = rev['final_estimate'] - rev['initial_release']

# NBER recession windows
recession_starts = ['1980-01', '1981-07', '1990-07',
                    '2001-03', '2007-12', '2020-02']
for start in recession_starts:
    mask = (rev['date'] >= start - pd.DateOffset(months=6)) & \
           (rev['date'] pd.DateOffset(months=6))
print(rev[mask]['revision_total'].mean())Eco3min Macro Data Hub
— nonfarm payrolls, unemployment, initial claims, yield curves, and 32 macroeconomic indicators.
Dataset Download & Reproducibility
The complete dataset is provided in open formats for quantitative analysis and academic research. Updated monthly following each Employment Situation release.
License: Creative Commons Attribution 4.0 (CC BY 4.0). Free for research, academic, and journalistic use with attribution to Eco3min.
For researchers: The dataset includes all variables needed for event studies around employment releases, revision-cycle analysis, birth-death model evaluation, and forward return computations. The revision data spans 1980–2026 with 345 monthly observations of initial, second, and final estimates.
Data Sources & Academic References
- Primary
U.S. Bureau of Labor Statistics / FRED — All Employees, Total Nonfarm (PAYEMS). Monthly, seasonally adjusted, January 1939–present. - Primary
U.S. Bureau of Labor Statistics — CES Nonfarm Payroll Employment: Revisions between over-the-month estimates, 1979–present. First, second, and third estimates of monthly employment change. - Primary
National Bureau of Economic Research (NBER) — US Business Cycle Dating Committee. Official recession start and end dates. - Primary
Yahoo Finance / S&P Dow Jones Indices — S&P 500 Index (^GSPC). Monthly close prices. - Research
Aruoba (2008) — “Data Revisions Are Not Well-Behaved,” Journal of Money, Credit and Banking. Demonstrated that macroeconomic data revisions exhibit systematic bias and predictability. - Research
Orphanides & van Norden (2005) — “The Reliability of Inflation Forecasts Based on Output Gap Estimates in Real Time,” Journal of Money, Credit and Banking. Showed that real-time data revisions substantially affect policy analysis. - Reference
Congressional Research Service (2025) — “Current Employment Survey Benchmark Revisions,” IF12827. Analysis of the CES benchmark revision methodology and historical context. - Reference
U.S. Bureau of Labor Statistics — CES Birth-Death Model methodology and FAQ. Explains the statistical model that is the primary source of revision bias.
Methodological Limitations
- Revision data starts in 1980. The BLS revision tables in the current format begin with January 1979 (with 1980 being the first full year with recession window data). Earlier recessions cannot be analyzed with the same methodology, limiting the sample to six recession episodes.
- Benchmark revisions are not fully incorporated. The revision_total column captures only the first-to-third estimate change (a 2-month window). Annual benchmark revisions, which can be substantially larger, are incorporated into the PAYEMS level but not tracked as separate revision events in this dataset.
- Birth-death model methodology has changed. The BLS modified the CES birth-death model in 2003 (NAICS conversion) and has made incremental changes since. Pre-2003 and post-2003 revision patterns are not perfectly comparable.
- Small recession sample. Six recession episodes since 1980 provide a clear pattern but limited statistical power. The 71% downward rate in recession windows is based on 68 observations — sufficient for pattern recognition but not for formal confidence intervals.
- COVID distortions. The 2020 recession introduced extreme outliers (−20,787K in April 2020) that skew summary statistics. Where appropriate, we report statistics with and without the March–June 2020 period.
- Forward returns use overlapping windows. Monthly observations share 11 out of 12 months in their forward 12-month return calculation, introducing autocorrelation. Newey-West standard errors with at least 12 lags are recommended for statistical inference.
Frequently Asked Questions
Are nonfarm payroll revisions systematically biased?
Yes, but the bias is conditional on the business cycle phase. Across all 345 months with revision data (1980–2025), the mean revision is only +5,000 — appearing unbiased. However, during the six months surrounding recession starts, 71% of revisions are downward with a mean of −24,000, while during normal expansions, 58% are upward with a mean of +12,000. The bias is systematic and directional, concentrated precisely at the moments when accuracy is most valuable for policy and market decisions.
Why are nonfarm payrolls revised so much?
The BLS produces the initial NFP estimate from a survey of approximately 119,000 establishments, supplemented by a birth-death model that estimates employment changes from business formations and closures. As additional survey responses arrive (increasing the response rate from roughly 60% to 90%), the estimate is revised twice. Separately, the annual benchmark revision adjusts the entire series to the Quarterly Census of Employment and Wages (QCEW), which covers 97% of nonfarm workers. The mean absolute revision (first-to-third estimate) is 49,000 jobs.
What was the largest NFP revision in history?
The largest single-month first-to-third estimate revision was −672,000 in March 2020, when the initial release of −701,000 was revised to −1,373,000. For annual benchmark revisions, the March 2025 preliminary revision of −911,000 is the largest on record. The March 2024 final benchmark was −589,000, and the March 2019 benchmark was −505,000. These three consecutive large downward benchmarks (2019, 2024, 2025) suggest a systematic issue with the birth-death model during periods of elevated business closures.
How do NFP revisions affect the stock market?
The equity market impact of revisions is surprisingly muted in the aggregate. Months with downward revisions show a median 12-month forward S&P 500 return of +11.4% (76% positive), while months with upward revisions show +11.2% (84% positive). The higher positive rate for upward revisions reflects the general equity tailwind during expansions. The key channel is indirect: downward revisions during recession windows contribute to belated recognition of economic deterioration, which can delay policy responses and extend the duration of equity drawdowns.
What is the current NFP trend and how reliable is it?
The March 2026 initial release showed +178,000 jobs, with the 12-month moving average at +22,000 — the slowest pace outside of a recession since the early 2000s. However, given the 2025 revision pattern (all 11 months revised downward, mean −58K), the current published data should be treated as preliminary. If the March 2025 benchmark revision of −911K is fully incorporated, several months in the trailing 12-month window will be revised further downward, potentially pulling the 12-month MA below zero.
Can I use this dataset for academic research?
Yes. The complete dataset is available for download in CSV and Excel formats under a Creative Commons Attribution 4.0 (CC BY 4.0) license. It includes 1,047 monthly observations of payroll levels, 345 months of revision data with initial/second/final estimates, NBER recession flags, recession-window flags, forward S&P 500 returns, and the proprietary NFP band classification. Please cite as: Eco3min Research (2026), “The Most Revised Number in Finance: US Nonfarm Payrolls Revision Dataset (1939–Present).”
Source
The Most Revised Number in Finance: How NFP Revisions Systematically Mislead at Turning Points — Dataset (1939–Present).
Eco3min Macro Data Hub — Research Indicators.
eco3min.fr/en/nfp-revisions-mislead-at-turning-points/
Dataset released under the Creative Commons Attribution 4.0 International License (CC BY 4.0).
Free to reuse with attribution.
Related Eco3min Research
Last updated — 5 April 2026