
M2SL: US Money Supply M2 Monthly Data from FRED (1959–2026)
M2SL monthly US M2 money supply from FRED since January 1959 — over 60 years of broad-money data with pre-calculated YoY growth. CSV, Excel, Python and R examples included.
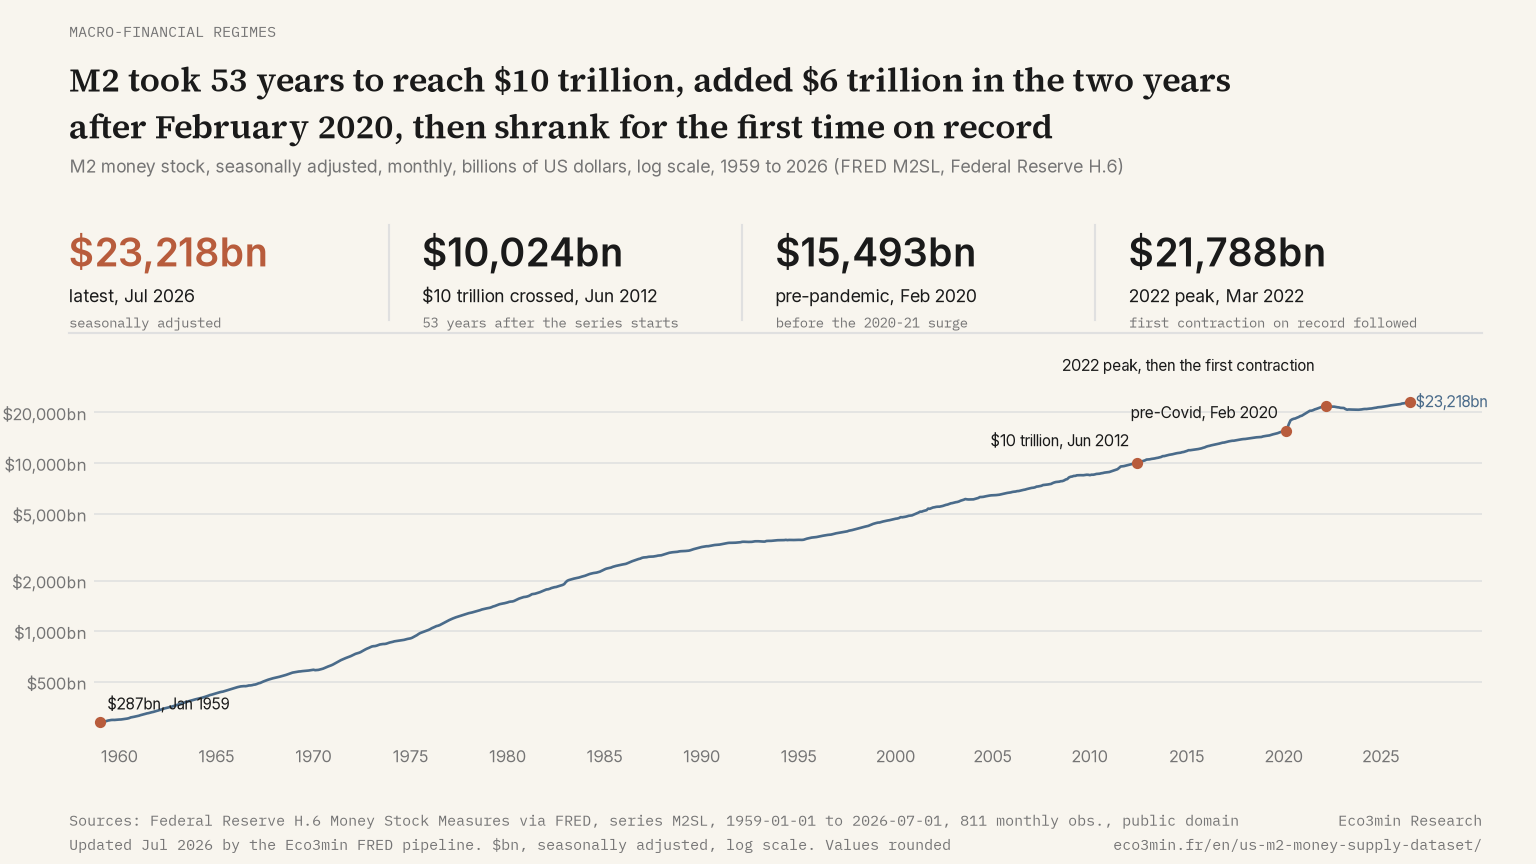
The M2SL series, published monthly by the Federal Reserve via FRED, measures the US M2 money supply — currency, checkable deposits, savings deposits, retail money market mutual funds, and small-denomination time deposits, seasonally adjusted in billions of US dollars. Since January 1959, M2SL has expanded from 287 billion to over 21 trillion. M2 growth has historically led CPI inflation by roughly 12–18 months in some regimes: the 41 percent expansion of M2SL between February 2020 and April 2022 preceded the 9.1 percent CPI inflation peak of June 2022, reviving monetarist debate after a decade of weak transmission.
Dataset: US Money Supply M2 (1959–2026) · Updated 2026-07-01
Loading FRED data…
Source: FRED series M2SL · Federal Reserve Bank of St. Louis
Macro Takeaway
M2SL measures money held by the non-bank public — distinct from bank reserves at the Federal Reserve and from the gross Fed balance sheet. Figure drawn from the FRED M2SL series. The level rises mechanically with nominal GDP and population growth; the analytically meaningful transformations are the year-over-year growth rate (tracked separately in the M2 growth rate dataset) and the ratio to nominal GDP (the M2-to-GDP ratio dataset), which neutralizes the secular trend.
The empirical lag between M2SL growth and CPI inflation has been one of the most durable controversies in macroeconomics. The 12–18 month leading relationship held strongly through the 1959–1990 period and largely collapsed during the 2009–2019 Great Moderation as the velocity of money fell sharply. It re-emerged with force in 2020–2022 when an unprecedented expansion preceded the post-pandemic inflation peak.
M2SL is structurally different from reserve-level liquidity measures: it responds to bank deposit dynamics and saver behavior, not directly to Fed open-market operations. The Fed balance sheet (WALCL) can expand sharply without M2SL responding, as occurred during QE2 and QE3, when reserves grew but bank lending and broad money did not.
M2SL Dataset Overview
| Indicator | US Money Supply M2 — FRED Series M2SL |
|---|---|
| Geography | United States |
| Frequency | Monthly |
| Period | 1959–2026 |
| Variables | date, m2_billions, m2_yoy |
| Format | CSV, Excel (XLSX) — instant download |
| Sources | Federal Reserve Bank of St. Louis — FRED |
| Last updated | — |
CSV & Excel Variables
The CSV and Excel files contain the following columns, ready for analysis in Python, R, or any data tool.
| Column | Type | Description |
|---|---|---|
date | Date (YYYY-MM-DD) | Observation date (first of month) |
m2_billions | Float | M2 money supply level, in billions of USD (seasonally adjusted) |
m2_yoy | Float | Year-over-year change in M2 (%) |
Column names match the CSV headers exactly.
M2 Growth Rate by Horizon
The level of M2 only rises; the information is in its growth rate. This tool computes the percentage change of M2 over the horizon you select, one month to five years, for every month since 1959, aligned by date. It reports the latest growth rate, the fastest and slowest windows with their dates, and the share of windows in which M2 grew, which shows how rare the 2022 to 2023 contraction was.
M2 grew 5.4 percent in the twelve months to July 2026. The fastest twelve-month growth on record is +26.8 percent to February 2021, the slowest −4.6 percent to April 2023; M2 grew in 98.1 percent of the 799 twelve-month windows since January 1960, and the 15 declining windows all fall between December 2022 and February 2024.
Download the Complete M2SL Dataset
The full M2 money supply dataset is available as instant CSV and Excel download — no signup, no API key.
FRED Direct CSV Access
The underlying data is available from FRED under series code M2SL:
https://fred.stlouisfed.org/graph/fredgraph.csv?id=M2SL
Eco3min Structured CSV — Direct Access
https://eco3min.fr/dataset/us-m2-money-supply.csv
This URL returns the complete M2SL dataset in CSV format with pre-calculated YoY growth. Use directly in pandas, R, curl, or any data tool.
Load M2SL Data in Python
import pandas as pd

url = "https://eco3min.fr/dataset/us-m2-money-supply.csv"
df = pd.read_csv(url, parse_dates=["date"])

print(df.head())
print(df["m2_billions"].describe())
print(df["m2_yoy"].describe())
Load M2SL Data in R
library(readr)

url <- "https://eco3min.fr/dataset/us-m2-money-supply.csv"
df <- read_csv(url)

head(df)
summary(df$m2_billions)
summary(df$m2_yoy)
Both examples load the M2 money supply CSV directly from the URL — no download or API key required.
Methodology
M2SL is published monthly by the Federal Reserve Board of Governors as part of the H.6 statistical release (“Money Stock Measures”). Taken from the Federal Reserve’s H.15 statistical release. It aggregates M1 (currency in circulation, demand deposits, traveler’s checks, and other checkable deposits) plus savings deposits, small-denomination time deposits below 100,000 USD, and retail money-market mutual fund balances.
The series is seasonally adjusted and expressed in billions of US dollars. The Federal Reserve revises the methodology periodically: a notable redefinition in May 2020 reclassified savings deposits from the M1/M2 boundary, mechanically increasing M1 substantially without changing the M2 total. M2SL is published monthly with a roughly four-week lag from the reference month.
The year-over-year growth column (m2_yoy) is calculated by Eco3min from the raw M2SL levels. This Eco3min dataset is updated monthly (15th of each month, 08:00 UTC) via automated pull from the FRED API.
Data Quality & Provider Notes
M2SL is the canonical broad-money aggregate for the United States, with a continuous monthly series back to January 1959 and quarterly variants extending further. The Eco3min mirror updates monthly with the H.6 release plus a pre-calculated year-over-year change.
- Release latency. The Federal Reserve publishes the H.6 release on the fourth Tuesday of each month with M2 data for the preceding month. FRED ingests within hours; Eco3min mirrors within 72 hours.
- Revisions policy. Recent observations are subject to small revisions over the following 1–2 months as deposit and money-market fund data are finalized. Historical values are rarely revised after the initial 90-day window. Major redefinitions (such as the May 2020 reclassification of savings deposits) create structural breaks worth flagging in component-level analysis.
- Alternative sources. Bloomberg (M2 Index), Refinitiv/LSEG, and the BIS Monetary and Financial Statistics database provide parallel series. ALFRED (Archival FRED) preserves vintage M2SL values, useful for real-time-data analysis of how policymakers viewed money supply at the moment of past policy decisions.
- Known gaps. No gaps in the monthly cadence since 1959. The May 2020 methodology revision is the most consequential structural break in the modern series: comparing M2 components pre- and post-revision requires careful reconstruction, though the M2 total remains continuous.
For analysts focused on real-time monetary policy signals, the year-over-year growth rate (m2_yoy column) carries substantially more signal than the level. The level rises mechanically with nominal GDP; deviations of the growth rate from its long-run average are the analytically informative metric.
Common Pitfalls When Using M2SL
M2SL is widely cited in monetary analysis, but several recurring interpretation errors distort the signal.
- Reading the level rather than the growth rate. M2SL trends upward mechanically with nominal GDP and population growth. The level alone carries little signal. Year-over-year change, change relative to nominal GDP, or deviation from a trend reference are the analytically meaningful transformations. The 21 trillion USD figure in 2026 is not “high” without that normalization context.
- Applying the monetarist transmission mechanically. The empirical 12–18 month lag between M2 growth and CPI inflation has held in some periods (1970s, 2020–2022) but broken in others — the 2009–2019 period saw substantial M2 expansion with persistent below-target inflation, attributed to depressed velocity and reserves trapped in the banking system. The relationship is conditional, not deterministic, and depends critically on velocity dynamics.
- Confusing M2 with reserves or the monetary base. M2 measures money held by the public (deposits and currency). Bank reserves (TOTRESNS) are claims of banks on the Federal Reserve. The two can move in opposite directions: QE creates reserves but does not mechanically create M2 unless those reserves support new bank lending. Confusing the two leads to systematic misreading of QE eras.
- Comparing M2 across regimes without adjusting for methodology breaks. The May 2020 reclassification of savings deposits altered M1 substantially and changed the internal composition of M2. Comparing M1-to-M2 ratios across that break, or using older M1 series to extrapolate, introduces a methodology-error component independent of any underlying monetary dynamics.
Historical Regimes
M2SL history since 1959 traces the principal monetary regimes of the modern US economy: Bretton Woods, the Volcker disinflation, the Great Moderation, the post-2008 QE era, and the pandemic surge that revived monetarist debate.
- 1959–1979 — Bretton Woods and post-Bretton Woods inflation buildup. M2SL expanded from 287 billion to 1.5 trillion. The acceleration of M2 growth from 7 percent annualized in the 1960s to over 12 percent by the late 1970s preceded the inflation crisis of 1979–1981, an episode central to monetarist theory and the empirical case for a money-supply leading indicator.
- 1980–1990 — Volcker disinflation. M2SL growth decelerated to 6–8 percent through the 1980s as Paul Volcker’s Federal Reserve formally adopted M2 targeting in October 1979. CPI inflation declined from 13.5 percent in 1980 to roughly 4 percent by 1986, validating the M2-inflation link at the cost of the deepest recession since the 1930s.
- 1990–2007 — Great Moderation. M2SL grew at 5–7 percent annually with stable single-digit inflation and steady velocity. The Federal Reserve shifted away from explicit money-supply targeting toward interest-rate-based policy under Alan Greenspan, and academic debate intensified over whether M2 retained signal value in the new operating framework.
- 2008–2019 — QE era with weak transmission. Despite massive Fed balance sheet expansion via QE1, QE2, and QE3, M2SL growth remained modest at 5–7 percent. The textbook money-multiplier transmission broke down: Fed assets (WALCL) expanded roughly 5-fold, but bank lending and broad money did not respond proportionally. CPI inflation stayed below the 2 percent Fed target for most of the decade.
- February 2020 – April 2022 — Pandemic surge. M2SL expanded from 15.4 trillion in February 2020 to 21.8 trillion by April 2022 — a 41 percent increase in 26 months, the largest monetary expansion in the modern series. The mechanism combined fiscal transfers credited directly to household deposits, PPP loan flows into business deposits, and elevated household saving. The lagged effect on CPI inflation peaked at 9.1 percent in June 2022, an episode analyzed in the M2 and inflation Friedman-test study.
- 2023–2026 — Post-pandemic contraction and stabilization. M2SL contracted year-over-year for the first time in the modern series during 2023 as deposits flowed into money-market funds (capturing higher overnight rates) and the Fed conducted QT. M2 growth returned to the 3–5 percent range by 2025 as deposit flows stabilized and Fed policy normalized. The episode confirmed that velocity dynamics remain a first-order driver of the M2-inflation relationship.
Related Macroeconomic Datasets
M2SL is the broadest commonly reported money-supply measure, but it operates on a different timescale from reserve-level liquidity. M2 growth has historically led inflation by 12–18 months in active-velocity regimes, while reserve-level liquidity tracks shorter-term financial-system plumbing. Cross-referencing these dimensions provides a dual-horizon view of monetary conditions.
- US M2 Growth Rate (YoY) — The rate-of-change transformation that carries most of M2SL’s signal for inflation analysis.
- M2 to GDP Ratio — Normalizes M2SL against nominal output, the canonical transformation for monetarist analysis.
- US CPI Inflation History — The variable M2SL growth has historically led by 12–18 months in active-velocity regimes.
- Fed Balance Sheet (WALCL) — Reserve-side counterpart, useful for contrasting reserve creation with broad-money response.
- Treasury General Account (TGA) — Autonomous factor that drains reserves but does not directly affect M2SL.
Macroeconomic Dataset Hub
This M2SL dataset is part of the Eco3min macro-financial data repository. Browse all available FRED datasets with instant CSV download.
Explore the Eco3min Dataset Hub
Sources
- Federal Reserve Bank of St. Louis — FRED database, series M2SL
- Federal Reserve Board of Governors — H.6 statistical release (“Money Stock Measures”)
Dataset Reference
Last updated — 21 September 2026
Disclaimer – Financial Information: The analyses, commentary, and content published on eco3min.fr are provided for informational and educational purposes only. They do not constitute investment advice or a solicitation to buy or sell financial instruments. Past performance is not indicative of future results. All investment decisions involve risk and are the sole responsibility of the reader.