Earnings Revisions and Market Reversals: Reading the Equity Cycle Early
Before indices wobble, revisions to earnings expectations already sketch the outlines of coming reversals. This signal, subtle but rarely wrong, is one of the most reliable leading indicators of the equity cycle.
How to use earnings revisions to anticipate market reversals
It’s not the reported result that moves the market — it’s the direction in which expectations shift.
Aggregated earnings revisions constitute a leading signal of the equity cycle whose reliability surpasses that of quarterly releases themselves. The trajectory of expectations — not their absolute level — determines inflection points in equity markets, with a lead time of 2 to 6 months ahead of index movements.
This mechanism explains why an index can display apparent strength while its fundamentals are deteriorating under the surface: revisions capture microeconomic inflection points before they show up in aggregates. For an investor, tracking the momentum of revisions is like observing the market below the surface: the signal appears in profit estimates before it appears in prices. Reading the cycle through revisions changes the timing of allocation and risk-management decisions.
Every earnings season produces its share of apparent contradictions. One company that reports in line with expectations sees its stock decline; another with lackluster figures soars. The hurried observer concludes markets are irrational. Cycle analysis reveals a different logic: it is never the raw result that dictates the trend, but the subsequent movement of expectations. A positive surprise accompanied by downward revisions to future guidance is a negative signal — not a positive one. The analytical value of earnings revisions lies in this apparent inversion.
Historical data leave little room for doubt: major re-rating phases and large corrections were consistently preceded by sustained inflection points in aggregated revisions, often months before index moves. This mechanism ties into the broader framework of earnings surprises as a signal for the equity cycle and the dynamics of economic cycles and market expectations.
- Indices react late to cycle reversals — they smooth the signal through concentration
- Earnings revisions lead indices by 2 to 6 months
- Key signal: coordinated sector diffusion + up/down ratio < 1
It’s not the reported result that moves the market — it’s the direction in which expectations shift. The momentum of earnings revisions (the ratio of upward to downward revisions) is a leading signal of market reversals with a lead time of 2 to 6 months on index moves. This signal operates through an identifiable causal mechanism: aggregated revisions capture deterioration (or improvement) in micro fundamentals before it materializes in macrofinancial aggregates. Over the last five cycles, coordinated degradation in aggregated revisions has invariably preceded episodes of index underperformance. The mechanism is well documented (Fed, academic literature, I/B/E/S data); the open question is the diffusion threshold at which a sectoral inflection turns into a market-wide reversal.
Why earnings revisions anticipate market reversals
The relationship between earnings revisions and market reversals is not a chance correlation: it rests on a causal chain whose central mechanism is information transmission from micro to price macro.
Inflection in company fundamentals → Management guidance revisions → Analyst estimate adjustments → Shift in aggregated expectations → Valuation repricing → Index movements
Typical lead of revisions on indices: 2 to 6 months. Each link is independently observable.
Trigger: inflection in company fundamentals. The signal originates not from the quarterly report but from the moment management teams begin to perceive a change in their operating environment — slowing order books, margin pressure, lengthening sales cycles, client caution. These signals first show up in guidance (management-provided projections), which are the raw material for analyst estimates. A working paper from the St. Louis Fed (Gavin & Kliesen, 2002) shows that earnings revisions momentum is a significant predictor of index reversals with a lead of 2 to 4 months. I/B/E/S (now LSEG) data confirm this result on a panel of 20,000 companies covered by over 800 brokerages.
Transmission channel: micro → macro aggregation. The pivot mechanism is the translation of a microeconomic signal (a company downgrades its outlook) into a macrofinancial signal (aggregated expectations turn). This process unfolds in waves. First, revisions appear in the most cycle-sensitive sectors — industrials, discretionary consumption, small caps. Then they spread to intermediate sectors. Finally, when defensive sectors themselves start to experience downward revisions, the reversal signal is generally confirmed. Academic research (Chan, Karceski & Lakonishok, 2003, “Analysts’ Conflicts of Interest and Biases in Earnings Forecasts”, Journal of Financial and Quantitative Analysis) documents a structural optimism bias among analysts, meaning downward revisions are particularly informative: they occur when deterioration is strong enough to overcome institutional optimism.
Amplifier: diffusion effect and sectoral dispersion. What distinguishes an isolated sectoral inflection from a market-wide reversal is diffusion. When downward revisions are confined to one or two sectors, they may reflect idiosyncratic shocks without systemic implication. When they spread simultaneously across a majority of sectors — measured by I/B/E/S as the “breadth of revisions” — the signal becomes structural. Bloomberg data for 2018–2019 and 2022–2023 illustrate this: multiple simultaneous negative revisions across more than six sectors preceded broad index corrections by 3 to 5 months. The dispersion of stock responses to earnings releases (standard deviation of post-earnings price moves) is a complementary signal: high dispersion indicates the market is discriminating rather than complacent — behavior typical of transition phases.
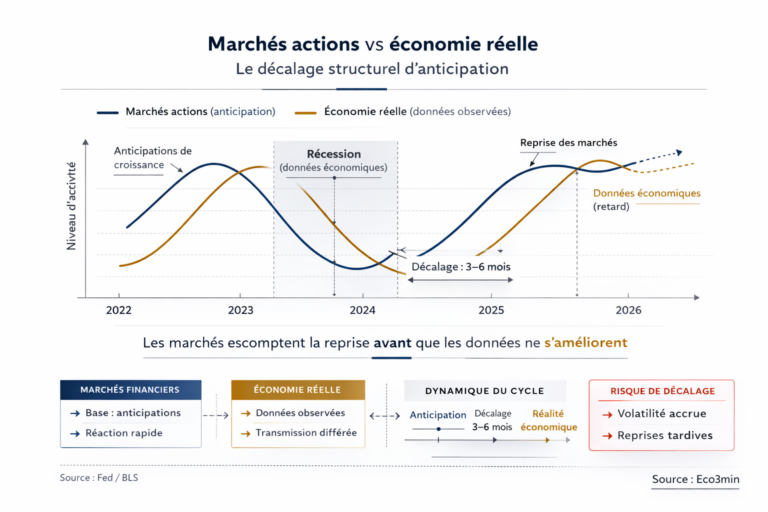
Consequence: delayed repricing of indices. These channels combine to produce the characteristic lag between revision inflection and index movement. Large-cap weighted indices mechanically smooth the signal: as long as a few mega-cap stocks hold up (tech, luxury), the index can mask generalized deterioration in expectations among the majority of constituents. This smoothing creates a 2 to 6 month window during which revisions signal deterioration that the index does not yet reflect — precisely where reading revisions adds the most value. The analysis of the structural gap between equity markets and the real economy documents this concentration masking effect.
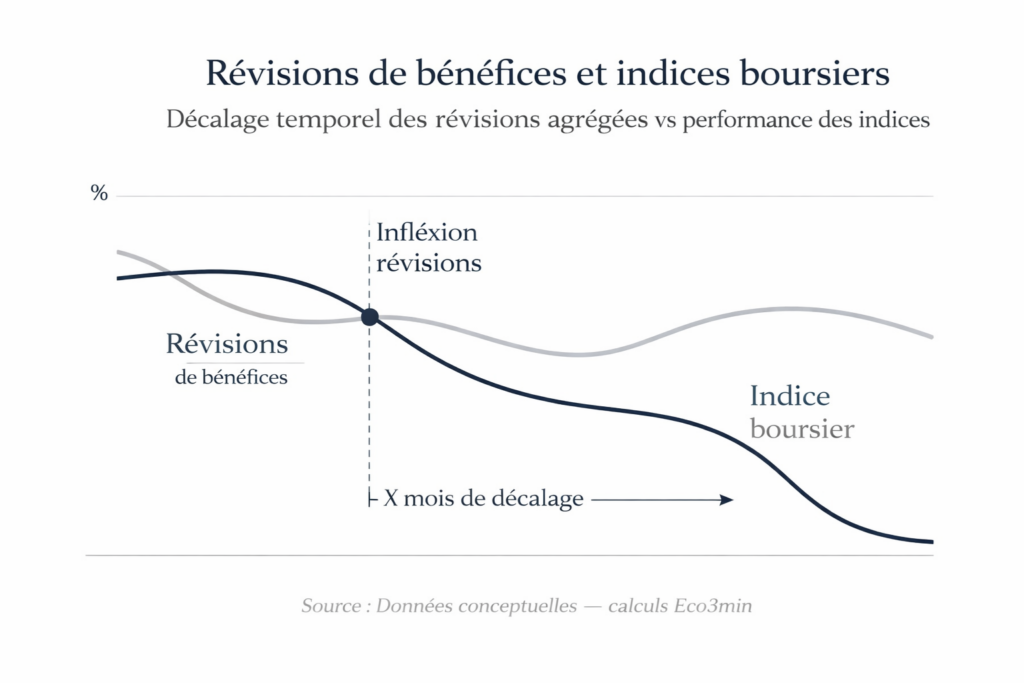
- 2 to 6 months: typical lead of aggregated revisions on index reversals. Source: Gavin & Kliesen, 2002, St. Louis Fed.
- 5 out of 5: in the last five cycles, coordinated degradation in revisions preceded episodes of index underperformance. Source: I/B/E/S data, Bloomberg.
- Optimism bias: analysts revise downward late — making downward revisions especially informative. Source: Chan, Karceski & Lakonishok, 2003.
- End 2025: the S&P 500 revisions up/down ratio fell below 1.0 for the first time since mid-2023. Source: Bloomberg, LSEG consensus.
- Diffusion threshold: simultaneous downward revisions across more than 6 of 11 GICS sectors have historically signaled a market-wide reversal. Source: I/B/E/S data, Bloomberg.
What the consensus looks at — and what it should look at
The market’s dominant reading of corporate results, amplified by media coverage of earnings seasons and echoed by sell-side commentary, focuses on a single indicator: the quarterly “surprise.” Beating or missing consensus is treated as the alpha and omega of analysis. This reading is doubly limited.
First, the consensus bar is itself biased: analysts tend to lower estimates in the weeks prior to reporting, creating an artificially low threshold that most companies “beat.” I/B/E/S historical data show that on average 70 to 75% of S&P 500 companies report above consensus each earnings season — incompatible with the idea of a genuine surprise. The quarterly surprise is largely endogenous to the consensus process, not an informative signal about true company health.
Second, and more fundamentally, quarterly reporting is by nature backward-looking: it measures what happened, not what will happen. The true leading signal lies in what happens after the release: does management revise guidance up or down? Do analysts adjust profit estimates for upcoming quarters? Does the momentum of revisions accelerate or decelerate? The post-release dynamic holds the most relevant information for anticipating market moves — not the beat/miss of the completed quarter.
Interpreting a quarterly surprise — positive or negative — as a directional signal. A result that “beats consensus” by 3% means nothing if future guidance is revised downward and the momentum of estimates for coming quarters weakens. The market’s reaction the day after a release reflects revision of future expectations, not appreciation of the past quarter. That’s why a good report can make a stock fall (negative guidance revision) and a poor report can make it rise (positive forward guidance).
| Reading by quarterly surprise | Reading by revisions momentum | |
|---|---|---|
| Focus | Beat/miss of the past quarter | Trajectory of estimates for upcoming quarters |
| Nature of the signal | Backward-looking (measures the past) | Forward-looking (anticipates the future) |
| Known bias | Consensus lowered before release (70–75% of beats) | Structural optimism bias → downward revisions are more informative |
| Relevant horizon | 1 day (post-release reaction) | 2 to 6 months (lead on indices) |
| Key variable | Surprise % vs consensus | Revisions up/down ratio, sectoral breadth of revisions |
Sectoral diffusion, analyst bias and threshold effects: what complicates the reading
The transmission mechanism from revisions to indices is crossed by sources of complexity that explain why the signal, while reliable in trend, is hard to calibrate for timing and magnitude.
Masking effect from index concentration. Market-cap weighting of broad indices creates a structural bias: revisions among mega-cap stocks disproportionately influence aggregate earnings expectations, while deterioration among mid and small caps — often earlier and stronger — is masked. In Q4 2025, the top ten S&P 500 constituents accounted for 35% of total weight. Deterioration in revisions across the other 490 components can be hidden for quarters if guidance from the top ten holds. Equal-weighted indices (S&P 500 Equal Weight) and median aggregates of revisions provide an earlier, less biased signal than market-cap weighted aggregates.
Analyst optimism bias and its analytical exploitation. Academic literature (Chan, Karceski & Lakonishok, 2003; Das, Levine & Sivaramakrishnan, 1998) documents a structural optimism bias in analyst estimates linked to conflicts of interest with investment banks (pressure to preserve issuer relationships) and psychological incentives (confirmation bias, extrapolation). This bias implies estimates are on average overly optimistic — and downward revisions occur only when deterioration is strong enough to overcome institutional resistance. A persistent, coordinated downward revision signal is therefore particularly informative because it goes against the system’s natural tendency.
Threshold effects and non-linearities. The relationship between revisions and index moves is not linear. Moderate deterioration confined to one or two sectors can be absorbed without visible index impact — passive flows (ETFs) and strategic allocations stabilize markets except during stress phases. But when diffusion reaches a critical threshold — historically, downward revisions across more than six of eleven GICS sectors — the effect crystallizes non-linearly. Bloomberg data over the last five cycles show this diffusion threshold was reached 3 to 5 months before each correction larger than 10% in broad indices. The analysis of sector and company dynamics clarifies sector vulnerability rankings in each cycle.
Interaction with the cost of capital. Earnings revisions do not act in isolation: their impact on valuations depends on the interest-rate environment. In low-rate periods, the market may tolerate some deterioration in expected earnings because the discount rate remains favorable. In a period of positive real rates — as in the current cycle — negative revisions have an amplified impact: simultaneous compression of expected earnings and a higher discount rate exert double pressure on multiples. This interaction is detailed in the analysis of central banks and equity markets and in the framework on the real cost of money.
Implications for reading the current cycle
If the revisions-based framework is valid, it changes the interpretation of several ongoing dynamics.
For market diagnosis. Since the end of 2025, several market segments have shown more cautious revisions even as reported results remain robust. The S&P 500 revisions up/down ratio fell below 1.0 for the first time since mid-2023 (Bloomberg, LSEG consensus). This decoupling between past results and future expectations is characteristic of transition phases — a gap amplified by a sustained high cost of capital and margin normalization that leads management teams to adjust guidance with a lag. The data do not signal an imminent collapse but an inflection in expectations that merits close monitoring.
For sector reading. The hierarchy of revisions highlights contrasting trajectories: sectors most exposed to credit cycles (listed real estate, construction, retail) and margin-compressed names are the first to see downward revisions, while sectors structurally supported by AI and the energy transition hold up. The key question is diffusion: if revisions remain confined to cyclical sectors, the signal is sectoral; if they spread to defensive sectors (healthcare, utilities, staples), the signal becomes systemic. Prolonged US equity outperformance adds concentration risk: mega-cap stocks that lift indices are the last to experience revisions, which can mask widespread deterioration.
For allocation and risk management. Revisions provide a timing signal complementary to traditional macro indicators (yield curve, PMIs, credit conditions). When revisions momentum, the yield curve, and credit conditions converge on the same diagnosis (deterioration or improvement), the probability of a market reversal rises significantly. It is the convergence of signals — not any single indicator — that offers the most robust predictive value. The Eco3min macro diagnostic grid integrates revisions into this multi-signal approach.
Invalidation condition. This framework loses relevance if a positive demand shock — rapid AI adoption, large-scale fiscal stimulus, a sudden rebound in margins — reverses the downward trajectory of revisions by flipping expectations upward. Faster-than-expected monetary easing could also offset earnings deterioration by compressing the discount rate, supporting valuations despite negative revisions momentum. Conversely, prolonged index stability despite downward revisions may reflect temporary technical flows (buybacks, passive inflows) disconnected from fundamentals — a disconnect that amplifies the eventual correction when re-positioning occurs.
Three time horizons to track the revisions signal
Short horizon (0–6 months): the revisions up/down ratio and sectoral diffusion are the priority indicators. The next earnings season (Q4 2025 / Q1 2026) will be decisive in assessing whether the late-2025 inflection confirms or reverses. Indicators to monitor: revisions up/down ratio (Bloomberg, LSEG), sectoral breadth of downward revisions, dispersion of post-earnings reactions, and the gap between expected and realized earnings growth (earnings delivery ratio). The short-term risk is a sudden market tilt if Q1 2026 results confirm deterioration in defensive sectors.
Cycle horizon (1–3 years): the structural question is the path of corporate margins in a normalized cost-of-capital environment. If profit margins — historically high coming out of the pandemic — converge toward cycle averages, current earnings estimates embedded in valuations would be overly optimistic, triggering a prolonged downward revision cycle. Interaction with restrictive monetary policy and its delayed effects amplifies this risk: margin compression via high cost of capital adds to demand-side pressure on profits. The real economic cycle will determine the magnitude and duration of the adjustment.
Structural horizon (5+ years): the current cycle tests the market’s ability to absorb a double adjustment — normalization of discount rates and normalization of margins — without a major correction. If AI produces a sufficiently large productivity shock to keep margins elevated despite higher cost of capital, the revision cycle may be mild. Otherwise, earnings estimates embedded in prices must converge to levels compatible with positive real rates and normalized margins — an adjustment that would take the form of a downward revision cycle spread over 2 to 4 years.
It’s not the reported result that moves the market — it’s the direction in which expectations shift. Earnings revisions are the most directly observable leading signal of the equity cycle, leading index moves by 2 to 6 months. The strength of this signal lies in its mechanism: it captures micro-level deterioration (or improvement) before it materializes in macro aggregates, and it is all the more informative when it runs counter to analysts’ structural optimism bias. The late-2025 inflection — up/down ratio below 1.0 for the first time since mid-2023, amid a high cost-of-capital environment — does not signal a collapse but rather a regime change in expectations whose implications markets have not yet fully priced.
Robust: The predictive power of revisions momentum is documented in academic literature (Gavin & Kliesen, 2002; Chan, Karceski & Lakonishok, 2003) and confirmed across the last five cycles by I/B/E/S and Bloomberg data. Analysts’ structural optimism bias is an empirical fact that makes downward revisions especially informative. The diffusion sequence (cyclicals → intermediates → defensives) is documented as a signal of worsening conditions.
Uncertain: The exact diffusion threshold at which a sectoral inflection becomes a market-wide reversal varies across cycles. The impact of passive flows (ETFs) and buybacks on the relationship between revisions and indices is debated — such flows may delay repricing without preventing it. The ability of AI to sustain structurally high margins (justifying current estimates) remains largely hypothetical. The precise timing of the transition from “sectoral inflection” to “market-wide reversal” is inherently unpredictable.
Regular monitoring via the weekly macro update allows confrontation of this framework with the most recent data on revisions, sectoral diffusion and valuations. Reading the cycle through revisions — rather than through quarterly surprises — provides a more reliable leading signal because it captures the movement of future expectations, not the appreciation of the past.
- It’s not the reported result that moves the market — it’s the direction in which expectations shift. Revisions momentum anticipates index reversals by 2 to 6 months.
- The quarterly surprise (beat/miss) is a backward-looking biased signal: 70–75% of companies “beat” an artificially lowered consensus. The real signal is in post-release revisions.
- Analysts’ structural optimism bias makes downward revisions especially informative — they only occur when deterioration overcomes institutional resistance.
- Sectoral diffusion is the discriminant variable: downward revisions across more than six GICS sectors simultaneously have historically preceded corrections larger than 10% by 3 to 5 months.
- This framework is invalidated if a positive demand shock (AI, fiscal stimulus) reverses revisions momentum, or if technical flows (buybacks, passive inflows) sustainably offset fundamentals deterioration.
Mis à jour : 20 March 2026
This article provides economic and financial analysis for informational purposes only. It does not constitute investment advice or a personalized recommendation. Any investment decision remains the sole responsibility of the reader.