The Real Economic Cycle: Investment, Productivity and the Hidden Drivers of Growth
The real economic cycle takes shape in investment and productivity, long before appearing in cyclical indicators. Yet most economic debate remains trapped in quarterly figures.
The cycle forms in stocks, not flows.
The real economic cycle describes the deep dynamics of economic activity: capital accumulation, productivity trends, and future productive capacity. It is built through investment decisions and resource allocation long before it becomes visible in cyclical indicators.
Reading the cycle solely through GDP, employment, or confidence surveys means observing consequences rather than causes. An analysis based on productive stocks and transmission mechanisms makes it possible to anticipate macroeconomic turning points years in advance.
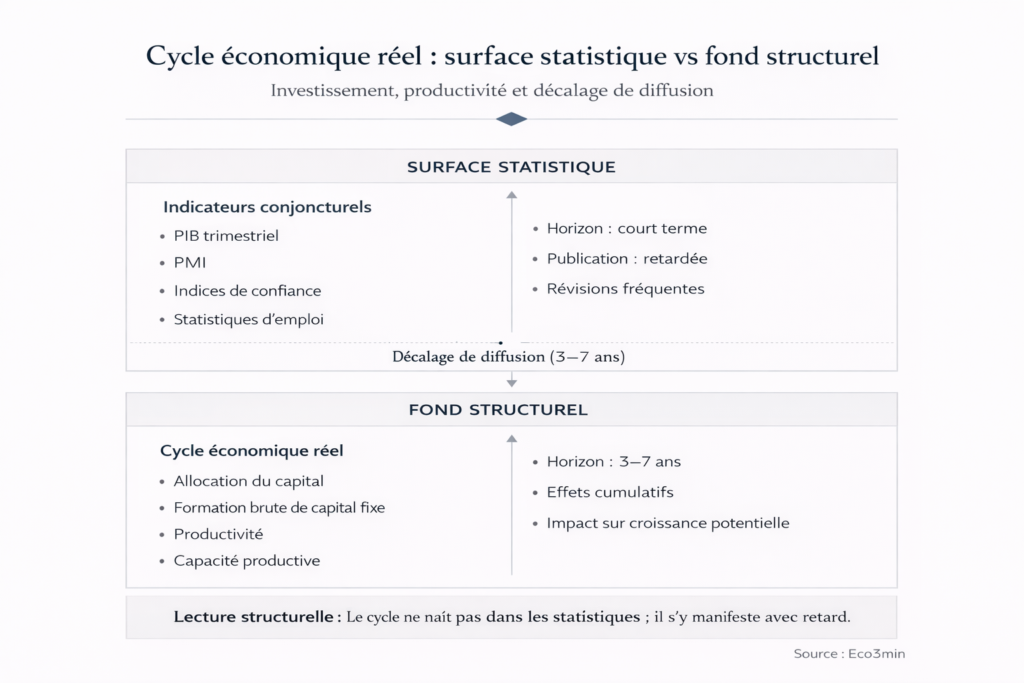
Every quarter, a GDP figure is released. Positive, it reassures. Negative, it worries. Two consecutive quarters of contraction, and the word “recession” dominates public debate. This arithmetic reading grid dominates economic coverage — and that is precisely where the problem lies. The real economic cycle does not form in published statistics: it originates in capital allocation decisions, spreads through productivity and credit channels, and becomes visible in aggregate indicators only with a structural lag of several quarters. Confusing statistical signals with underlying dynamics leads to systematically delayed diagnoses.
This confusion is not anecdotal. It affects the quality of decisions — monetary, fiscal, and investment — because it pushes policymakers to react to consequences rather than understand causes. The post-pandemic debate illustrated this strikingly: while cyclical indicators signalled a vigorous rebound in 2021–2022, the erosion of the productive capital stock and the slowdown in productivity gains were laying the foundations for a structural slowdown that official data only began to reflect two years later.
Understanding the real cycle requires a shift in framework. Not looking at what the economy produces today, but examining what determines what it will be able to produce tomorrow. It is within this gap between future capacity and present measurement that the core of the cycle is determined — and this is precisely what standard indicators fail to capture.
The cycle forms in stocks, not flows. The real economic cycle is determined by productive investment and total factor productivity gains, whose effects unfold over three to seven years — well before cyclical indicators reflect them. The core mechanism runs through the accumulation (or erosion) of the capital stock, which conditions future potential growth with a structural lag. This perspective profoundly changes cyclical diagnosis: an economy can post statistically positive growth while entering a phase of deterioration in its productive fundamentals. The transmission mechanism (investment → capital → productivity → potential) is well established; its calibration in the current cycle, marked by the energy transition and the emergence of AI, remains open.
The core mechanism: how investment shapes the cycle ahead of the data
The dynamics of the real economic cycle follow an identifiable causal chain, with each link operating on a distinct time horizon.
Trigger: productive investment decisions. The starting point of the real cycle is not a GDP figure, but the set of capital allocation decisions made by firms and public authorities — investment in equipment, infrastructure, productive capacity, and R&D. These decisions are conditioned by profitability expectations, the cost of capital, and the regulatory environment. According to IMF estimates (World Economic Outlook, October 2025), gross fixed capital formation in advanced economies grew at an average annual rate of 2.1% over the period 2022–2025, a pace the Fund itself considers insufficient to offset the accelerated obsolescence of the existing capital stock, estimated at around 3 to 4% per year in the most service-oriented economies.
Transmission channel: capital stock accumulation. Annual investment flows aggregate into the productive capital stock, which determines the economy’s production capacity. This channel operates with a structural lag of three to seven years between the decision to invest and the full materialisation of the effect on productive potential. A BIS working paper (Borio, Disyatat & Rungcharoenkitkul, 2023) formalises this mechanism by showing that the credit cycle — which finances investment and conditions production capacity — precedes the real activity cycle by around four to six quarters in advanced economies. This lag constitutes the core diagnostic problem: when investment slows, the capital stock does not immediately decline, but its growth decelerates, then its quality deteriorates — a process invisible in quarterly data.
Amplifier: productivity as a silent multiplier. Total factor productivity (TFP) — which measures the combined efficiency of labour and capital — acts as an amplifier or a brake in the transmission of investment to the real cycle. When productivity gains are dynamic, each unit of invested capital generates a multiplier effect on potential growth. Conversely, a productivity slowdown — such as that documented by OECD data since 2015, with average annual gains falling below 0.5% in the euro area versus 1.2% over 2000–2007 — reduces the effective return on investment and compresses growth potential, even if gross investment flows appear stable.
Macroeconomic consequence: the invisible erosion of potential growth. The combination of relative underinvestment and slower productivity produces a counter-intuitive outcome: the output gap closes not because the economy accelerates, but because productive potential declines. In December 2025, the OECD estimated that the output gap of G7 economies was close to zero — a signal usually interpreted as a sign of cyclical health. In reality, it partly reflects a decline in potential output itself, fundamentally altering the diagnosis: the economy is not in equilibrium, it is constrained by a falling production ceiling.
What the consensus gets right — and what it misses
The dominant reading of the economic cycle, notably advanced by the IMF in its World Economic Outlook and by most forecasting institutions, rests on a reasonable diagnosis: advanced economies are experiencing an orderly slowdown after the inflation shock of 2022–2023, and monetary normalisation is producing its effects gradually. This diagnosis is not wrong — it broadly captures the general direction.
Its limitation lies elsewhere: in what it does not look at. Most institutional cyclical analysis focuses on flows (GDP growth, inflation, employment) and treats stocks (productive capital, productivity, the quality of the entrepreneurial fabric) as slow-moving background parameters. Yet it is precisely within these stocks that the next cycle forms. The BIS (Annual Report 2025) notes that standard forecasting models poorly integrate balance-sheet dynamics and systematically underestimate threshold effects linked to the accumulation of financial imbalances — an observation illustrated by the 2001 and 2008 cycles.
The consensus is therefore broadly correct on the immediate cycle, but its analytical framework leaves a substantial blind spot: the trajectory of productive potential. It is in this blind spot that a real-cycle reading adds value — not to contradict the prevailing diagnosis, but to complement it with a structurally neglected dimension.
| Standard cyclical reading | Real cycle perspective | |
|---|---|---|
| Focus | Quarterly flows (GDP, employment, inflation) | Productive stocks (capital, productivity, capacity) |
| Key indicators | GDP, PMI, sentiment indices | Net investment, TFP, capacity utilisation |
| Signal type | Immediate, high frequency | Lagged, causal mechanics |
| Diagnostic horizon | Short-term reaction (0–6 months) | Structural trajectory (3–7 years) |
| Main risk | Overreaction to statistical noise | Underestimation of rapid turning points |
Interpreting the closing of the output gap as a sign of economic health. When productive potential itself declines — due to accumulated underinvestment and a slowdown in productivity — the output gap can close without the economy accelerating. Diagnosis requires distinguishing closure “from above” (activity acceleration) from closure “from below” (declining potential). OECD and IMF output-gap estimates are frequently revised — by an average of 0.5 percentage points according to the BIS (2025) — underscoring the fragility of this indicator in real time.
Why statistics structurally arrive after the cycle
The lag between the real cycle and its statistical measurement is not a technical flaw to be corrected: it is built into the nature of macroeconomic data. A quarterly GDP figure is published several weeks after the quarter closes as a preliminary estimate, then revised two or three times in subsequent months. The BIS (Annual Report 2025) reminds us that GDP revisions in OECD countries average 0.5 percentage points between the first estimate and the final data — a margin large enough to turn modest growth into stagnation, or vice versa.
This problem is aggravated by an attention bias: public debate focuses on the latest published figure, which by construction is the least reliable. Conjunctural surveys (PMI, purchasing managers’ sentiment indices, household surveys) offer a more reactive alternative, but they measure subjective perceptions, not real economic flows. Their correlation with actual activity varies by cycle phase and country — a point documented by a BCE working paper (Conflitti & Luciani, 2019) showing that the predictive power of PMIs deteriorates significantly during turning points, precisely when they would be most useful.
The FRED series from the Federal Reserve Bank of St. Louis on US private nonresidential investment illustrates this phase shift over the long run: turns in productive investment preceded official recessions (dated by the NBER) by four to eight quarters on average over the last six cycles. Investment signals the turning of the real cycle well before GDP confirms it — but that signal is drowned out by the noise of monthly and quarterly indicators.
Reading the conjuncture through a structural diagnostic of the macro phase therefore requires cross-checking multiple signals across horizons, weighting data by reliability and revision lag, rather than reacting to the latest monthly figure.
Non-linearities, phase lags and feedback loops: the complexity of the real cycle
The schematic Trigger → Transmission → Amplifier → Consequence describes the central mechanics, but the real cycle does not unfold linearly. Several sources of complexity modify the effective trajectory and explain why turning-point forecasts so often fail.
Investment threshold effects. Productive investment does not respond proportionally to economic conditions. Below a certain threshold of expected profitability — linked to the cost of capital, uncertainty, and the regulatory horizon — firms do not reduce investment gradually: they postpone or cancel projects. This non-linear behaviour produces “investment cliffs” that accelerate the real-cycle turning. The ECB’s Bank Lending Survey (Q4 2025) reports the share of firms postponing investment projects at levels comparable to late 2019 — a threshold that historically preceded significant contractions in gross fixed capital formation in subsequent quarters.
Geographical desynchronisation of cycles. Since 2023, large economies’ cycles have diverged markedly. Eurostat recorded in November 2025 an annualised growth rate of 0.8% in the euro area, versus 2.4% in the United States (Bureau of Economic Analysis, Q3 2025) and a marked slowdown in China, where the National Bureau of Statistics published growth of 4.5% — below the official target for the first time since 2022. This desynchronisation across major economies precludes a uniform reading of global conditions. It also creates complex interactions: a Chinese slowdown weighs on European exports with a two- to three-quarter lag, while US monetary policy affects global financial conditions via the dollar channel.
Productivity–investment feedback loop. The interaction between productivity and investment is not one-way. A slowdown in productivity reduces expected returns to investment, which slows capital flows, which further weakens productivity — a negative feedback loop that can turn a moderate slowdown into persistent stagnation. OECD data (Compendium of Productivity Indicators, 2025) document this dynamic in several European economies where TFP growth remained below 0.5% per year for a decade, feeding chronic underinvestment. Concretely, an economy trapped in this loop can display stable headline growth while its productive capacity deteriorates year after year — a process invisible in flow indicators but decisive for the next cycle.
Phases of the cycle irreducible to an arithmetic threshold
Expansion, slowdown, recession: these terms structure economic debate, but common usage reduces them to numeric thresholds — two consecutive quarters of contraction for a “technical recession”, for example. This arithmetic definition masks the reality of cycle phases, which encompass distinct configurations: capacity utilisation levels, the orientation of credit flows, corporate margin dynamics, household saving rates. An economy can shift phase without a visible statistical break, which makes announcements of turning points especially vulnerable to timing errors.
The investment cycle and its lagged effects illustrate this complexity: investment flows can remain positive while their composition deteriorates (substitution of maintenance for expansion investment), signalling a phase shift invisible in aggregates. Each cycle carries singularities that escape standardised frameworks. The current cycle is marked by two unprecedented features: massive investment needs linked to the energy transition and AI deployment, combined with a cost of capital structurally higher than in the 2010–2020 decade. This tension between rising investment needs and tighter financing conditions is one of the cycle’s defining singularities.
Implications for reading the current cycle
If the real-cycle analytical framework is relevant, it changes the reading of several current dynamics without dictating operational conclusions.
For monetary policy reading. Monetary transmission operates with a recognised lag of 12 to 24 months between a change in policy rates and its full effect on real activity. The ECB, in its December 2025 bulletin, indicated that the gap between policy rates and actual financing conditions remained significant — meaning the 2022–2023 tightening has not yet fully transmitted to investment and the capital stock. Broad financing conditions — including credit spreads, asset valuations and funding availability — transmit the monetary signal with varying intensity across economy segments. If this mechanism holds, the coming quarters should see further slowing in productive investment in the euro area, regardless of potential rate cuts. The monetary channel interacts with the potential growth mechanism to determine the real-cycle trajectory.
For cyclical diagnosis. The structural lags of macro indicators imply that the current-phase diagnosis cannot rely on a single data type. A robust reading requires crossing flow indicators (GDP, employment, industrial production) with stock indicators (capacity utilisation, net investment, trend productivity) and leading indicators (yield curve, credit conditions, investment intentions). The convergence or divergence of these signals is more informative than any one taken alone.
For advanced economies’ trajectory. If the hypothesis of relative underinvestment holds — and IMF and OECD data support it for the recent period — then G7 potential growth could remain persistently below pre-pandemic levels. This scenario is not certain, but the mechanism underpinning it (capital stock erosion → productivity slowdown → potential contraction) is sufficiently documented to warrant close monitoring. The major unknown remains AI’s impact on productivity — a potentially transformative factor whose macro effects remain, at this stage, largely hypothetical.
Invalidation condition. This analytical framework loses relevance if AI-related productivity gains materialise rapidly and massively (exceeding 1 percentage point of TFP annually in advanced economies), or if a coordinated, large-scale public investment programme — comparable to the Marshall Plan in proportion to GDP — were to break the underinvestment dynamic. In those scenarios, the negative productivity–investment feedback loop would be interrupted and the diagnosis of potential degradation must be revised.
Three time horizons for a complete reading of the cycle
Short horizon (0–6 months): the incomplete transmission of the 2022–2023 tightening continues to weigh on credit conditions and investment decisions. Conjunctural surveys (euro-area PMIs around 48–49 at end-2025, the US ISM Manufacturing index oscillating around the 50 threshold) signal anaemic industrial activity, without collapse. The short-term risk is a faster-than-anticipated deterioration in investment if financial conditions do not ease.
Cycle horizon (1–3 years): the accumulated underinvestment over 2022–2025 will begin to affect potential growth. Economies that sustained productive investment flows (notably in the energy transition and digital infrastructure) will diverge from those that adjusted through compressed investment. Desynchronisation of cycles between the US, euro area and China will remain a determining factor.
Structural horizon (5+ years): the central question is productivity. If AI- and digital-related productivity gains materialise at scale, the real cycle could enter a phase of capital-stock renewal comparable to the investment waves of the 1990s. Otherwise, Europe’s fifteen-year productivity stagnation trajectory could spread to other advanced economies — a “Japanification” scenario made mechanically plausible by the structural dynamics of the economic cycle.
The real economic cycle plays out in capital allocation and productivity, not in the indicators that measure their consequences with delay. Most cyclical debate focuses on flows — what the economy produces this quarter — while the cycle forms in stocks — what the economy will be able to produce tomorrow. This informational asymmetry explains why turning points are consistently identified ex post. Reading the cycle by its fundamentals does not offer more precise forecasts, but a framework more robust to data revisions and statistical surprises.
Robust: The transmission mechanism investment → capital stock → productivity → potential growth is empirically and theoretically documented (BIS, IMF, academic literature). The structural lag of cyclical indicators is an established statistical fact. The desynchronisation of cycles between major economies is observable in current data.
Uncertain: The intensity of current underinvestment and its precise impact on future potential remain debated. The net effect of AI on productivity is still largely hypothetical. The timing of any investment-cycle turning is inherently unpredictable. The exact calibration of monetary transmission lags in the current cycle is disputed — estimates range from 12 to 30 months depending on models and countries.
The structural dynamics of the economic cycle remain the essential foundation for interpreting cyclical signals beyond statistical noise. Regular monitoring via the weekly macro dashboard allows confronting this framework with the latest data. Several trajectories remain open, but reading the cycle by its fundamentals — investment, productivity, capital allocation — offers a framework more resilient to revisions than reacting to the month’s figures.
- The real economic cycle forms in investment and capital-allocation decisions over a three-to-seven-year horizon, well before appearing in published cyclical indicators.
- The core mechanism runs through an identifiable causal chain: investment → capital stock → productivity → potential growth, with each link operating with a structural time lag.
- Statistical revisions (averaging 0.5 percentage points of GDP according to the BIS) and publication delays create a persistent gap between official diagnosis and the real dynamics of the economy.
- Desynchronisation of cycles between the US, euro area and China prevents any uniform reading of global conjuncture and reinforces the need for a mechanism-based analytical framework rather than level-based readings.
- This framework is invalidated if a major productivity shock (large-scale AI) or a massive coordinated public investment programme breaks the negative productivity–investment feedback loop.
Mis à jour : 30 March 2026
This article provides economic and financial analysis for informational purposes only. It does not constitute investment advice or a personalized recommendation. Any investment decision remains the sole responsibility of the reader.