Monetary Regimes: Interest Rates, Liquidity and Market Cycles (1990–2026)
Interest rates, liquidity, and financial conditions: the channels through which central banks shape the macroeconomic cycle and market dynamics.
— Monetary policy does not set prices. It determines the conditions under which they are formed.
Monetary policy is the lever through which central banks regulate the financial pulse of the economy. But the question that structures this pillar is not “what do central banks do?” — it is: what monetary regime are we operating in, and what does that imply?
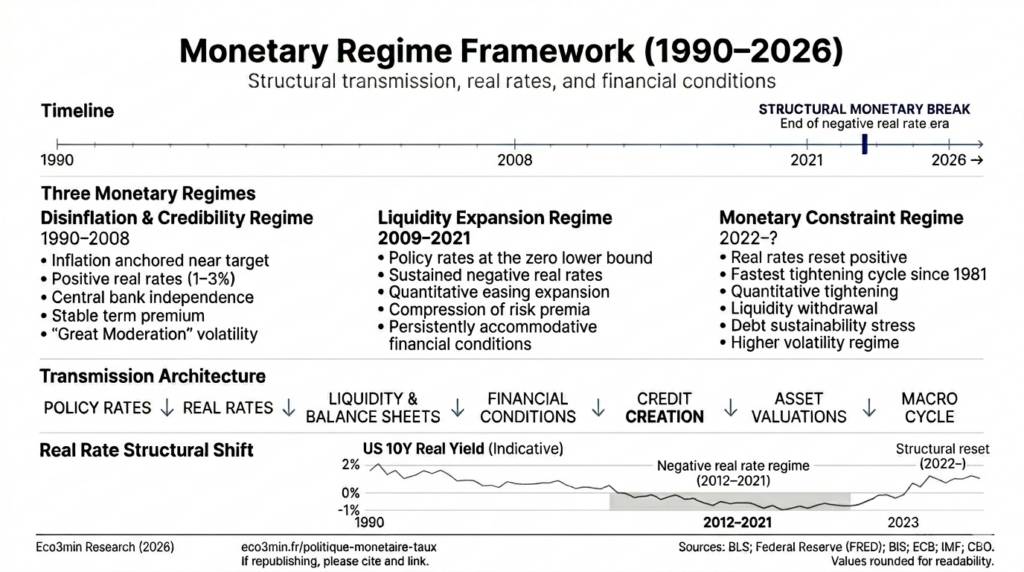
The answer has changed radically. Between 2010 and 2021, the world lived under an unprecedented monetary regime: permanently negative real rates, ever-expanding central bank balance sheets, and near-total suppression of the risk premium. This regime governed the valuation of all asset classes — equities, bonds, real estate, credit — and shaped the borrowing behavior of governments, corporations, and households alike. Since 2022, this regime has abruptly reversed. Real rates have turned positive for the first time in a decade. Capital once again has a price. And the fragilities accumulated during twelve years of free money are gradually surfacing.
For an accessible introduction to the economic and financial mechanisms discussed here, see our guide to learning how to invest.
This page serves as the analytical summit of Eco3min’s Monetary Policy and Rates cluster. It does not describe monetary instruments — the sub-pillars handle that. Instead, it offers a structural reading of the contemporary monetary regime, its origins, its rupture, and its implications for markets, debt, and capital allocation.
The eco3min macroeconomic barometer
Each month, eco3min updates this analytical framework around three structural indicators: cycle positioning, geopolitical tensions, and the market volatility regime.
This pillar provides the conceptual framework. The bulletin delivers the operational reading.
1990–2008: The reign of disinflationary stability
The first monetary regime of the contemporary era rests on an intellectual architecture forged in the 1980s: central bank independence, inflation targeting, and credibility as the anchor for expectations. Paul Volcker laid the foundations by crushing American inflation at the cost of a severe recession — Fed Funds at 20% in June 1981, unemployment at 10.8% in November 1982 (BLS) — but it was Alan Greenspan who embodied the regime in its mature form.
The results were spectacular. U.S. inflation fell from an average of 7.4% over 1970–1982 to 2.5% over 1990–2007 (BLS). The Fed’s policy rate fluctuated in a 3 to 6.5% band, high enough to maintain positive real rates — between 1 and 3% on average — but low enough to support near-continuous expansion. The “Great Moderation” — a term coined by James Stock and Mark Watson (2002) — described this period of historically low macroeconomic volatility: U.S. GDP growth showed a standard deviation of just 1.2% between 1984 and 2007, compared with 2.7% between 1950 and 1984 (BEA).
This regime produced a stable environment for markets. The S&P 500 quintupled between 1990 and 2007, driven by the combination of tamed inflation, moderate real rates, and a disinflationary globalization that compressed production costs. The 10-year Treasury yield declined from 8.5% in 1990 to 4.5% in 2007 — a secular convergence toward lower rates that supported the valuation of all asset classes.
But this regime contained the seeds of its own destruction. Stability bred complacency: Greenspan held Fed Funds at 1% for a full year between 2003 and 2004, fueling housing leverage and structured credit. The “Greenspan put” — the belief that the Fed would always intervene to support markets — encouraged ever-increasing risk-taking. Leverage ratios at major investment banks exceeded 30:1 (SEC). Outstanding CDOs peaked at $2 trillion (SIFMA). The collapse of September 2008 — Lehman Brothers, the interbank market freeze, the Libor-OIS spread at 364 basis points (Federal Reserve) — ended the first regime and opened a radically different era.
2010–2021: The historical anomaly — negative real rates and unlimited liquidity
The second monetary regime constitutes, in hindsight, the greatest anomaly in modern financial history. For over a decade, major central banks maintained policy rates near zero — or below it, at -0.50% for the ECB and -0.10% for the BoJ — while injecting trillions in liquidity through unprecedented asset purchase programs.
The scale of intervention: staggering numbers
The combined balance sheets of the four major central banks (Fed, ECB, BoJ, BoE) grew from $4 trillion at the end of 2007 to a peak exceeding $28 trillion in early 2022 (BIS) — a sevenfold increase in fifteen years. The Fed’s balance sheet alone rose from $900 billion to $8.965 trillion as of April 2022 (Federal Reserve). The ECB accumulated over €5 trillion in assets. The BoJ held more than 50% of outstanding Japanese government bonds and roughly 7% of the country’s stock market capitalization through its ETF purchases (BoJ, 2023).
Real rates — the true price of capital — turned negative and remained so almost continuously from 2012 to 2022. The U.S. 10-year real rate (measured by TIPS) fluctuated between -1% and 0% for most of this period (Federal Reserve), reaching a trough of -1.19% in August 2021. In the eurozone, real rates were even more deeply negative — the real yield on the 10-year Bund fell below -2% in 2021 (Bundesbank). In practical terms, this meant that borrowers were being paid to take on debt in real terms — a complete inversion of historical financial logic.
Structural consequences: asset prices, debt, and behavior
This regime produced deep and lasting consequences across the entire economic and financial system. The compression of real rates mechanically propelled the valuation of all long-duration assets. The S&P 500 rose from 677 in March 2009 to 4,766 at the end of 2021 — a sevenfold increase. The S&P 500 forward P/E reached 23x at the end of 2021, compared with a historical average of 16x (FactSet). Home prices reached all-time highs across virtually all advanced economies — the U.S. Case-Shiller national index rose 130% between 2012 and 2022 (S&P Global). High-yield credit spreads fell to 303 basis points in June 2021 (ICE BofA), among the lowest levels ever recorded.
Debt exploded at every level. U.S. federal debt held by the public rose from 35% of GDP in 2007 to 97% in 2024 (CBO). Eurozone public debt grew from 66% to 89% of GDP (Eurostat). The stock of U.S. corporate debt exceeded $13.5 trillion (SIFMA). U.S. household debt reached $17.7 trillion (Federal Reserve Bank of New York). The private credit market surged from $300 billion to $1.7 trillion between 2010 and 2024 (Preqin). Every euro or dollar borrowed during this period was taken out under historically abnormal conditions — conditions that will not return in the same form.
The transmission mechanism of these policies through liquidity and financial conditions — a direct driver of market dynamics — and their impact on the global dollar system are analyzed in depth in the dedicated sub-pillars.
Treating the 2010–2021 decade as the “new normal” and calibrating expectations — of returns, valuations, and financing conditions — to that period. This is the mirror image of the error made in 2007: back then, the stability of the Great Moderation was extrapolated forward. Today, the risk is extrapolating the abnormal conditions of permanent QE as though they constituted a durable equilibrium.
2022–?: The return of monetary constraint and the end of the illusion of free capital
The return of inflation in 2021–2022 — U.S. CPI at 9.1% in June 2022 (BLS), eurozone HICP at 10.6% in October 2022 (Eurostat) — forced a reversal of monetary policy of a brutality unseen in the post-Volcker era. This inflationary shock was largely rooted in the return of physical constraints on energy and commodities, which reintroduced massive supply shocks into the global economy. The Fed raised rates by 525 basis points in 16 months, the fastest tightening since 1981. The ECB hiked by 450 basis points after a decade of negative rates. The BoJ itself, the last bastion of ultra-accommodative policy, abandoned yield curve control (YCC) in 2023 and raised rates into positive territory for the first time since 2007.
The real rate shift: a regime change, not a cyclical adjustment
The most structural change is not the rise in nominal rates — it is the shift in real rates. The U.S. 10-year real rate (TIPS) swung from -1.19% in August 2021 to +2.40% in October 2023 (Federal Reserve), a 360-basis-point swing — the most violent in the history of TIPS. At the end of 2024, real rates remained firmly positive above 2%, signaling that the regime change is not a transitory episode but a structural reconfiguration.
This shift rewrites the entire financial architecture. With positive real rates, capital has a genuine cost. The discounting of future cash flows mechanically compresses valuation multiples — the S&P 500 forward P/E fell from 23x to 15.5x between end-2021 and October 2022 (FactSet). Marginal investment projects that were viable under zero rates become value-destructive. Business models built on future growth financed by cheap debt — unprofitable startups, highly leveraged real estate, SPACs — lose their economic rationale. These dynamics directly affect asset cycles, including real estate price fluctuations, through their impact on credit, real rates, and borrowing capacity.
Quantitative tightening: the gradual draining
Rate tightening is compounded by balance sheet tightening. The Fed’s quantitative tightening (QT) — an initial runoff pace of $95 billion per month, reduced to $60 billion from June 2024 (Federal Reserve) — is progressively withdrawing the liquidity injected during the previous decade. The Fed’s balance sheet fell back to around $6.8 trillion by the end of 2024, a $2.1 trillion reduction from the peak — but still seven times its pre-2008 level.
The Fed’s Reverse Repo Facility (RRP), which absorbed $2.5 trillion in excess liquidity at its peak in December 2022, dropped below $200 billion by the end of 2024 (Federal Reserve Bank of New York) — an indicator that excess liquidity in the system is progressively drying up. The ECB began its own QT, ceasing reinvestments from the APP and then the PEPP. The full impact of this contraction — analyzed in the Liquidity and Financial Conditions sub-pillar — will only become fully visible with a 12-to-24-month lag, consistent with the transmission delays documented in the literature (Friedman, 1961; Fed SF).
Early damage: weak signals and crystallization
The tightening has already produced visible fractures, each revealing a fragility accumulated during the zero-rate phase. 2022 was the worst year for bonds in a century — long-term Treasuries fell 31% (ICE BofA 20+), and the 60/40 portfolio suffered its worst year since the 1970s. In March 2023, Silicon Valley Bank failed — a $42 billion bank run in 24 hours (FDIC) — revealing $620 billion in unrealized losses sitting unrecognized across the U.S. banking system (FDIC Quarterly Banking Profile). The housing market suffered a shock: the U.S. 30-year mortgage rate climbed from 2.65% in January 2021 to 7.79% in October 2023 (Freddie Mac), compressing transaction volumes by more than 30%. The British pound experienced a flash crash in October 2022 during the Truss budget crisis, demonstrating that even reserve currencies are no longer immune to a confidence accident.
These episodes are not anomalies — they are the logical and predictable consequences of a monetary regime change. The transmission to corporate earnings, which operates with a 12-to-24-month lag, means that the full effects of the 2022–2023 tightening have not yet fully materialized.
Five structural implications of the regime change
The shift from a negative real rate regime to a positive real rate regime is not a simple cyclical adjustment. It reconfigures the structural parameters of the economy and markets across the following dimensions.
1. Debt sustainability is called into question
As long as r < g (interest rates below nominal growth), debt stabilizes mechanically even with primary deficits. The return of positive real rates reverses this dynamic for many countries. U.S. federal debt interest payments exceeded $880 billion in fiscal year 2024 — more than the defense budget (CBO). The CBO projects $1.7 trillion per year by 2034. In France, debt service has become the largest budget item, surpassing national education (Cour des Comptes). G7 public debt averages 122% of GDP (IMF). It is not the absolute level that is the problem — it is the cost of servicing debt in an environment of normalized rates.
2. Valuations must recalibrate
Asset valuation multiples are mathematically tied to the discount rate. A 360-basis-point shift in real rates implies a mechanical compression of multiples — unless earnings growth compensates, which is only possible for a fraction of the market. The concentration of performance in the Magnificent 7 — over 60% of the S&P 500’s gains in 2023 (S&P Global) — reflects precisely this reality: only companies capable of generating exceptional growth can justify elevated multiples in a positive real rate environment. The rest of the market remains under valuation pressure.
3. Real estate faces a structural correction
Real estate was the primary beneficiary of the zero-rate regime — and is logically the most vulnerable to its reversal. The U.S. 30-year mortgage rate tripled between 2021 and 2023 (Freddie Mac). Commercial real estate concentrates acute vulnerabilities: $5.8 trillion in debt with a significant portion maturing in 2025–2026 (Mortgage Bankers Association), office vacancy rates above 20% (CBRE). The detailed analysis is developed in the Real Estate & Cycles pillar.
4. Risk management becomes discriminating again
During the zero-rate decade, risk-taking was systematically rewarded. “TINA” (There Is No Alternative) pushed capital toward risky assets for lack of yield on safe ones. The return of positive rates restores the market’s discriminating function: investors are once again compensated for holding cash or high-quality bonds, which reduces capital flows toward speculative assets. High-yield default rates rose from 1.0% in early 2022 to 3.9% in Q3 2024 (Moody’s) — a normalization that separates viable borrowers from those who survived only thanks to free money.
5. The risk of fiscal dominance emerges
The final implication — and potentially the most destabilizing — is the risk of fiscal dominance: the configuration in which government budget constraints become so pressing that they end up dictating monetary policy, at the expense of price stability. When debt interest payments exceed 4% of GDP — a threshold the United States is approaching (CBO) — political pressure to keep rates low becomes structural, regardless of what inflation would warrant. Central bank independence, a cornerstone of the inflation-targeting regime since the 1990s, is not an irreversible achievement — it is an institutional convention that can be gradually eroded under fiscal pressure. The Central Banks sub-pillar analyzes in detail the structural biases and pressures these institutions face.
What markets are misreading about the current regime
Every monetary regime change produces systematic misreadings whose identification constitutes an analytical edge. The current regime generates three recurring errors.
Extrapolating a rapid pivot. Markets have repeatedly anticipated a quick return to low rates — the “Fed cuts” priced into futures markets in early 2024 projected six rate cuts for the year, or 150 basis points. The Fed delivered three (75 bps). This error reflects an anchoring bias toward the 2010–2021 regime, when every slowdown was followed by massive easing. In a regime of structurally higher inflation and massive fiscal deficits, the threshold for triggering easing is mechanically higher.
Confusing nominal rates with financial conditions. Financial conditions can loosen without the Fed cutting rates — and vice versa. The Goldman Sachs Financial Conditions Index eased significantly between October 2023 and end-2024, driven by rising equities, tightening spreads, and a weaker dollar, even as Fed Funds remained at 4.50%. This disconnect creates a paradox: the Fed may judge conditions too accommodative even while nominal rates remain elevated, complicating the reading of the monetary signal.
Underestimating stock effects. QT is withdrawing liquidity, but the stock of excess liquidity accumulated during QE remains substantial — the Fed’s balance sheet at $6.8 trillion at end-2024 is still seven times its pre-2008 level. This stock acts as a shock absorber that delays the transmission of tightening, creating the illusion that tightening “isn’t working.” When the effects materialize, they often do so violently — as the September 2019 repo crisis, the March 2020 Treasury dislocation, and the March 2023 SVB failure each illustrated.
The yield curve: synthesis and leading indicator
The yield curve condenses into a single line the expectations of thousands of investors about growth, inflation, and monetary policy. Its inversion — when short-term rates exceed long-term rates — has preceded every U.S. recession in the past fifty years. The inversion of the 2Y-10Y spread from July 2022 to September 2024 was the longest since the 1980s (Federal Reserve), simultaneously reflecting recession expectations and the perception of durable tightening.
But the dis-inversion — the moment the curve re-steepens — is historically the most actionable signal. It indicates that the market is pricing in imminent Fed easing, typically in response to an ongoing economic deterioration. The last five U.S. recessions began within 6 to 12 months of the dis-inversion (NBER, Federal Reserve).
Three monetary trajectories for the decade ahead
The current monetary regime is not a destination — it is a transition whose outcome remains open. Three trajectories are plausible.
Structural normalization — the base case — assumes a gradual decline in inflation toward the 2% target, allowing central banks to moderately cut nominal rates while maintaining positive real rates. Fed Funds would converge toward an estimated “neutral rate” of 2.5 to 3.5% (FOMC dot plot), central bank balance sheets would continue to slowly shrink, and the system would progressively adapt to the normalized cost of capital. Under this scenario, valuations compress, fragile players exit the market, and the new regime stabilizes — a painful but orderly process that could take three to five years.
An inflationary shock scenario envisions a new supply shock — geopolitical escalation (Taiwan, Middle East), energy crisis, wage-price spiral — reigniting inflation and forcing central banks into additional tightening, potentially beyond what the indebted system can absorb. This scenario, analyzed in the Macroeconomics & Geopolitics pillar, could precipitate a recession and expose the systemic fragilities documented in our dedicated sub-pillar.
A fiscal dominance scenario — the most disruptive — assumes that public debt accumulation ultimately forces central banks to tolerate structurally higher inflation, sacrificing price stability to maintain fiscal sustainability. This scenario would imply durably low real rates despite higher inflation — a “financial repression” that would progressively erode the real value of claims and redistribute wealth from savers to debtors. This is the scenario that the IMF and BIS are monitoring most closely in their recent financial stability reports.
The dollar at the center of the global monetary system
No analysis of the contemporary monetary regime is complete without integrating the role of the dollar in global financial flows. The greenback remains the pivot of the international monetary system: over 58% of global foreign exchange reserves (IMF), 88% of foreign exchange transactions (BIS), and the invoicing currency for the majority of commodities. Every move in U.S. monetary policy propagates mechanically across the entire global financial system through the dollar channel — a mechanism detailed in the dedicated sub-pillar.
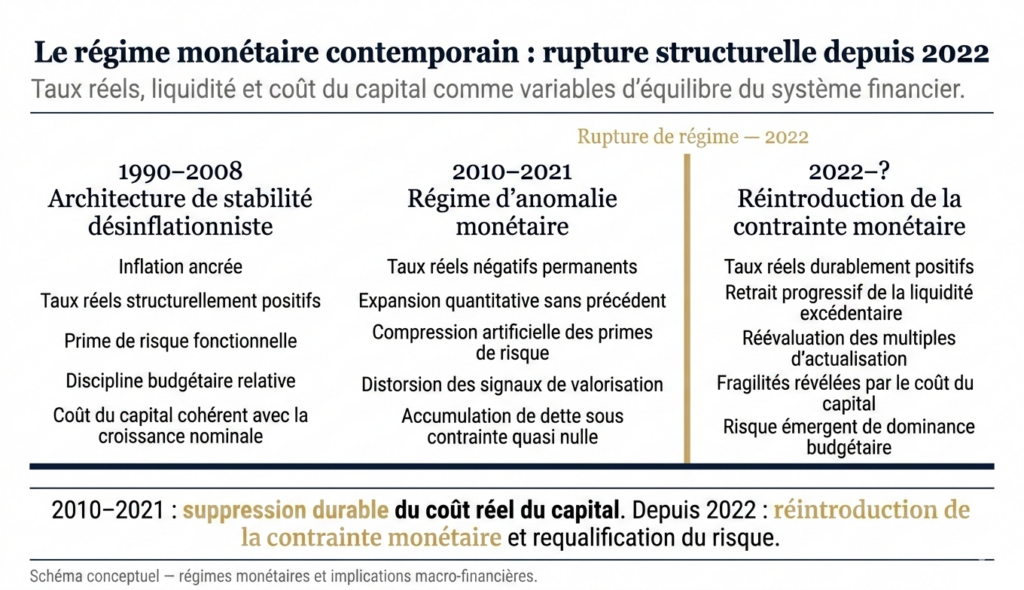
The 2010–2021 decade was not the new normal — it was a historical anomaly. Permanently negative real rates, ever-expanding central bank balance sheets, suppressed risk premiums: this regime distorted valuations, encouraged leverage, and created a systemic dependency on monetary support from which markets have not yet fully weaned themselves. The 2022 shift is not a cyclical adjustment — it is a regime change whose implications will unfold over a decade. The relevant question is no longer “when will the Fed cut rates?” but rather “what structural monetary regime are we operating in, and what does that imply for debt, valuations, and capital allocation?” That is the question this pillar and its sub-pillars endeavor to answer.