
Commodities, Inflation, and Monetary Policy: The Transmission Mechanism
From a shock in oil or metals to a Fed rate decision, the transmission chain unfolds in three stages and 12 to 24 months — a sequence that explains why every supply-driven inflation cycle since the 1970s has produced sharper recessions than demand-driven ones.

A shock in energy or metals prices triggers a predictable sequence — higher production costs, pass-through into consumer prices, monetary tightening — whose financial effects unfold over 12 to 18 months, a delay markets repeatedly underprice in their timing.
TL;DR
The commodities-to-rates chain — costs, consumer prices, central-bank tightening — is among macroeconomics' most predictable sequences, yet markets systematically misprice its 12-to-24-month timing.
- Three U.S. episodes trace the same arc: OPEC's 1973-74 shock drove inflation from 3% to above 12%, Volcker's 1979-82 tightening pushed the policy rate past 20% across two recessions, and the post-Covid 2021-23 surge produced modern history's fastest hiking cycle.
- Monetary tightening is a demand tool aimed at supply-driven inflation: raising rates does not cut crude when OPEC reduces output, so it slows the economy without touching the source, the trade-off Burns mismanaged in the 1970s and Powell faced in 2022.
- Headline versus core marks the policy fault line: when an oil shock lifts headline inflation to 6% while core holds near 3%, tightening fights supply-side inflation by throttling demand.
- Deglobalization and the energy transition both point upward: reshoring raises production costs, while battery and grid metals (lithium, cobalt, copper, nickel) push demand ahead of slow-adjusting supply, suggesting the 2010-2020 ultra-low-inflation regime may not return in the same form.
Inflation has physical causes, identifiable transmission channels, and measurable financial consequences — provided the analysis is traced back to its real sources rather than read off a single monthly print.
When the price of a barrel doubles in twelve months, a chain of mechanical effects sets in motion. It works through production costs, climbs the value chain, lifts consumer prices, triggers a central-bank response, and — one to two years later — weighs on equity valuations and the cost of credit. The sequence is one of the most predictable in macroeconomics. It is also one of the most systematically mispriced on timing. A closer look: the path from world price to the shelf.
Understanding the chain that links a shock in commodities to interest-rate policy provides a structural framework for reading prices, markets, and cycles — beyond the monthly noise of CPI commentary.
Inflation starts in the ground: energy and metals as primary sources
The dominant reading of inflation, as relayed in financial media, focuses on the monthly consumer price index. The CPI is useful, but it arrives late. The primary sources of inflation sit upstream, in the price-formation mechanism of commodities, where physical constraints meet financial flows — the first stage of the process.
Crude oil feeds into the cost structure of nearly everything: transport, chemicals, plastics, agriculture, logistics. When its price rises by 50%, each link in the chain adds a layer of extra cost. The plastics producer pays more for feedstock. The manufacturer raises its prices. The carrier passes on higher diesel. The distributor adjusts margins. By the time the final consumer sees it in a store price, three to six months have typically passed. More on this: our commodity price tracker.
That delay matters analytically. It explains why inflation prints sometimes seem to surprise markets: the commodity shock happened months earlier, and its transmission into consumer prices is gradual and non-linear. The real cycles of commodities and their macroeconomic transmission follow their own logic, driven by the physical constraints of extraction, storage, and transport — realities that financial models struggle to map.
Not all commodities transmit inflation the same way. Energy acts as a universal accelerator because it enters the production cost of everything. Industrial metals signal real demand. Agricultural commodities hit household purchasing power directly. The heterogeneity makes the link between commodities and inflation more complex — and more informative — than any composite index can show.
From physical inflation to measured inflation
The CPI measures inflation as experienced by households on average. But the construction of the index introduces biases that a reading beyond the monthly headline figure helps surface.
The CPI weights items by their share in average consumption — and average consumption belongs to no one in particular. A household heating with fuel oil in an older home experiences very different inflation from an urban renter. Lived inflation is structurally dispersed; the monetary target, by construction, is a single number. The gap between the two is where political pressure on central banks builds during inflation episodes. Background: commodities and the inflation wedge.
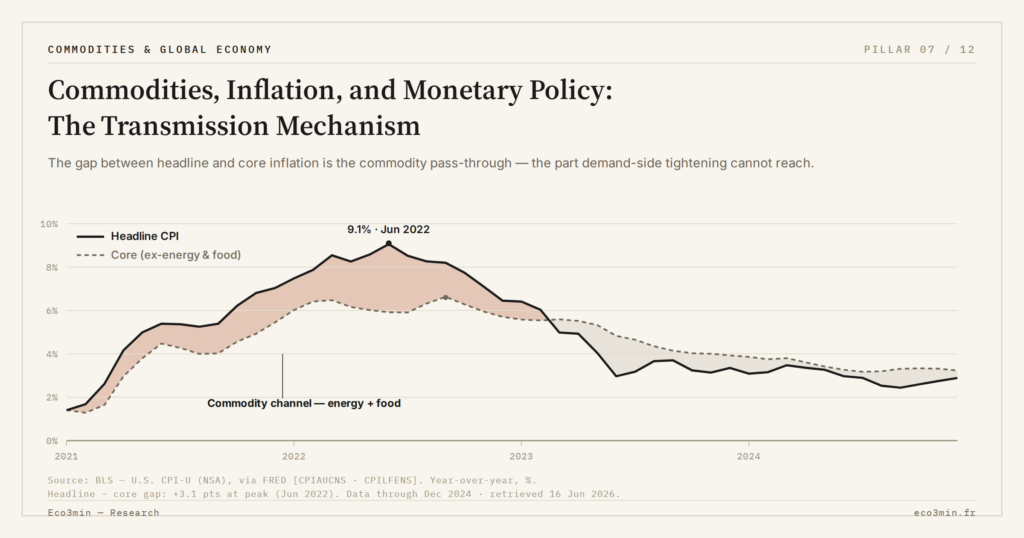
The distinction between headline inflation (including energy and food) and core inflation (excluding both) sits at the heart of the policy response. When an oil shock pushes headline inflation to 6% while core remains at 3%, the central bank faces a dilemma: tightening to contain inflation that comes from supply — not demand — slows the economy without addressing the source of the problem. This is the trade-off Burns failed to manage in the 1970s and the one Powell faced in 2022. The euro-area version of that supply-side dilemma runs through the gas channel into European CPI. For context: copper’s pass-through into producer prices.
The monetary response: tightening into a supply shock
This is where the mechanism becomes financially decisive. When inflation persistently exceeds target — generally 2% at both the ECB and the Fed — the central bank responds by raising policy rates. The goal is to slow demand and ease price pressure.
The paradox is well known to economists but rarely made explicit in market commentary: monetary policy is a demand tool applied to a problem that, in many episodes, originates on the supply side. Raising rates does not lower crude oil prices when OPEC cuts production or when a conflict disrupts shipping. But it does make credit more expensive, slow investment, weigh on consumption — and, through indirect channels, eventually reduce overall inflation pressure. The cost is an economic slowdown, often a recession.
The analytical framework of monetary policy and its limits clarifies the structure of the response. The central bank does not act on the primary cause of inflation when that cause is physical. It acts on second-round effects — inflation expectations, wage negotiations, firms’ pricing power — to prevent inflation from becoming embedded over time.
This nuance matters for understanding market lags. Investors who reason in terms of “the central bank will solve the problem” underprice both the time required and the cost of the solution. Tightening cycles triggered by commodity shocks have historically produced sharper slowdowns than those driven by demand overheating — precisely because the monetary tool is poorly calibrated for the shock it is asked to absorb. Worth reading alongside: how Fed and ECB compare.
What seven decades of U.S. inflation show
The history of U.S. inflation across post-war cycles offers a depth of perspective that short-term commentary cannot. Three episodes illustrate the commodities-inflation-policy triangle with particular clarity.
The first oil shock (1973–1974), when OPEC quadrupled crude, pushed U.S. inflation from 3% to above 12% in a year. The Fed under Arthur Burns hesitated before raising rates — too late and too little. Inflation expectations became unanchored, and the regime took a decade to break.
The Volcker tightening (1979–1982), against inflation running near 14%, pushed the policy rate above 20%. Inflation was defeated, at the cost of two consecutive recessions. The historical trajectory of U.S. real rates shows that real rates reached unprecedented levels during this period — a regime that shaped the returns of every asset class over the following decade. A related read: cocoa’s boom-and-bust episode.
The post-Covid episode (2021–2023) combined a logistics supply shock, an energy surge linked to the war in Ukraine, and massive fiscal stimulus. Central banks initially described the inflation as “transitory.” The fastest rate-hiking cycle in modern history followed.
In all three episodes, the same pattern repeats: physical shock in commodities → gradual pass-through into consumer prices (3 to 9 months) → monetary response (often delayed by 6 to 12 months) → economic and financial consequences shifted 12 to 24 months from the start of tightening. Identifying where the cycle sits in that sequence is one of the most useful keys to financial macroeconomics — and one of the few that has held across very different regimes. In depth: iron ore and China’s construction cycle.
The structural role of commodities in financial economics
Beyond crisis episodes, commodities play an indirect economic-policy role that few analyses systematically integrate. Oil is not only an industrial input: it is a vehicle for wealth transfer between producing and consuming countries, a determinant of trade balances, and a source of pressure on the currencies of net importers.
The relationship between physical supply, financial demand, and commodity price formation adds a layer of complexity. Futures markets do not merely reflect physical fundamentals: they also incorporate speculative positioning, producers’ hedging strategies, and investment flows from funds that treat commodities as an asset class. This financialization means prices can temporarily diverge from physical supply-and-demand — but it also means that financial shocks can hit commodity prices through a purely financial channel.
Deglobalization and the energy transition: long-term pressures
The framework described above applies to cyclical shocks. Several structural forces could keep sustained pressure on commodity-driven inflation.
Deglobalization and the fragmentation of value chains imply structurally higher production costs. Producing locally or in allied countries is more expensive than producing where labor is cheapest. The extra cost passes through to prices — gradually, but cumulatively.
The energy transition is, paradoxically, also inflationary in the short and medium term. Extracting the critical metals (lithium, cobalt, copper, nickel) required for batteries and electrical infrastructure pushes commodity demand higher while production capacity adjusts slowly. As long as supply lags, prices remain under tension. Also relevant: the recurring misconceptions about commodities and gold.
These pressures do not imply inflation will remain high indefinitely. They suggest that the ultra-low inflation regime that prevailed between 2010 and 2020 in advanced economies may not return in the same form — and that the relationship between commodities, inflation, and monetary policy will remain a central analytical lens for markets.
The triangle as a permanent framework
The commodities → inflation → monetary response chain is not a crisis-only phenomenon. It is a permanent cycle whose intensity varies, but whose logic remains constant. Energy prices always end up affecting rate decisions. Rate decisions always end up affecting valuations. And valuations always end up reflecting — with a lag — the physical constraints of the real economy.
For readers discovering this framework, the day-to-day financial trade-offs of households and firms take on a new dimension when read through this causal chain. And for those wanting to go deeper into the specific dynamics of commodities and their transmission into macroeconomic regimes, the study of real cycles offers an analytical depth that short-term commentary cannot match.
Last updated — 20 September 2026
Disclaimer – Financial Information: The analyses, commentary, and content published on eco3min.fr are provided for informational and educational purposes only. They do not constitute investment advice or a solicitation to buy or sell financial instruments. Past performance is not indicative of future results. All investment decisions involve risk and are the sole responsibility of the reader.
Read next
Full pillar →Reading the refinery utilisation rate: the threshold, the season, the turnarounds
A refinery runs full near ninety percent, not a hundred: the last slice of nameplate capacity is a…
IMO 2020: the regulatory shock that rewrote product spreads
An environmental rule on marine sulfur can move a refining spread more than a swing in crude. IMO…
The 2022–2023 refining golden age: anatomy of an episode
In 2022, refined fuel prices climbed faster than crude. That gap, measured by the 3-2-1 crack spread, reached…


