What Is Liquidity and Why It Drives Financial Markets
Liquidity — at three layers, from transaction depth to the Fed balance sheet — has shown the most stable correlation with market performance over twenty years, and the least integration into the analytical frameworks the public reaches for.

Liquidity — the volume of reserves available in the financial system and the ease with which assets can be traded without losing value — is the variable whose correlation with market performance has been the most stable over the past two decades, and the least integrated into the analytical frameworks the public has access to.
TL;DR
Across two decades, no macro variable has tracked market direction more reliably than liquidity, yet public frameworks still rarely read it.
- Three layers stack: transaction (selling without moving price), financing (leverage and credit conditions) and systemic (central-bank reserves), the systemic layer captured by a net liquidity index equal to the Fed's balance sheet minus the TGA and the RRP.
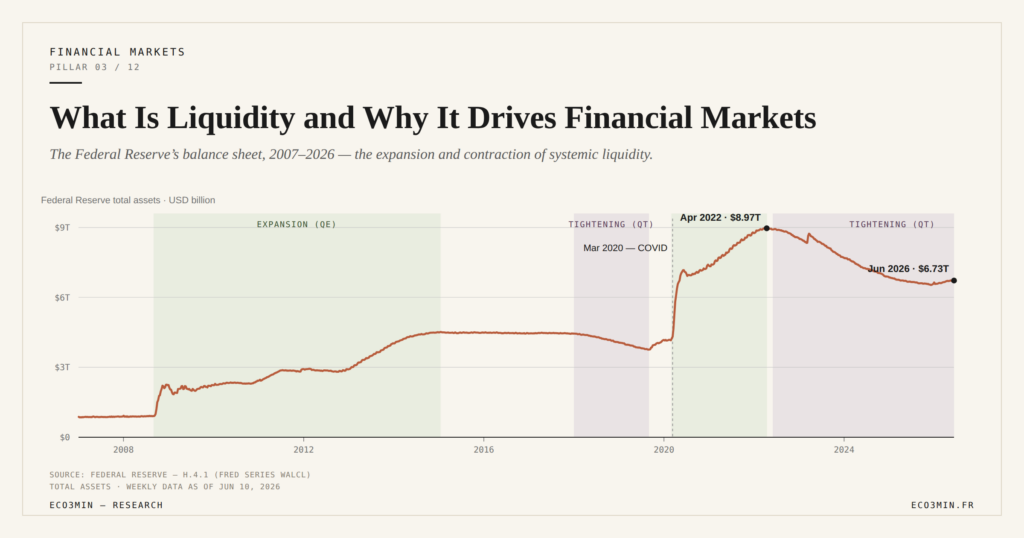
- Fed balance-sheet phases map onto risk assets: the $900bn-to-$4.5tn expansion (2008-14) and the $4.2tn-to-$8.9tn one (2020-22) coincided with rallies, while the 2018 contraction tracked a near-20% S&P 500 drop in three months, reversed in Q1 2019.
- Stress shows up first in credit: high-yield spreads have widened weeks to months before equities decline, and Bitcoin's correlation with the U.S. net liquidity index since 2017 runs even stronger than equities'.
The term covers very different realities. Untangling them gives access to one of the most powerful tools for reading modern financial markets — and the one fundamental analysis tends to ignore until it disappears. Directly related: Our analysis of why rate hikes do not always weigh on markets.
Day-to-day commentary talks about earnings, valuations, geopolitics, and monetary policy. It rarely talks about liquidity — except when liquidity disappears. Yet over horizons running from several months to several years, liquidity is the most decisive variable for the direction of financial markets. When global liquidity expands, risky assets rise. When it contracts, they fall. The empirical regularity has held over more than two decades of data, and it remains underused in the analytical frameworks available to the general public. Related question: the rising role of BRICS in financial markets.
The difficulty is that liquidity is a polymorphous concept. It refers to very different realities: how easily an asset can be sold, how much money sits in the banking system, how accommodative the central bank is, and the financing conditions in bond markets. This article separates these layers — from the most intuitive to the most systemic — and shows how they assemble into a readable indicator of market trend.
The ability to sell without losing value: transaction liquidity
The first meaning of liquidity is the most concrete. An asset is liquid when it can be sold quickly, at the quoted price, without the transaction itself moving that price meaningfully. A checking account is perfectly liquid. An apartment is not: between the decision to sell and the cashing of proceeds, several months can pass, and the final price depends on negotiation.
For an investor, the liquidity of an investment is a criterion that is often overlooked in favor of return. Yet a high return on an illiquid asset can be a trap once the seller needs to liquidate at the wrong moment. This is the reality finance textbooks summarize under the term “liquidity premium”: a less liquid asset must, in theory, offer a higher return to compensate for the risk of being unable to exit easily.
On markets, transaction liquidity varies enormously depending on the asset and on market conditions. Large-cap S&P 500 stocks trade in milliseconds with spreads of a few cents. A high-yield corporate bond may take hours, sometimes days, to find a buyer — and the price received can sit well below the last quoted price. ETFs that appear liquid on the screen actually depend on the liquidity of their underlying assets, a distinction whose consequences become painfully concrete during stress episodes.
Financing liquidity: the fuel for leverage
The second meaning concerns financing: the ability of economic actors to borrow in order to invest, speculate, or meet obligations. Financing liquidity is determined by bank lending conditions, interbank rates, and lenders’ willingness to take risk. The phenomenon is documented in the analysis of how markets form expectations and price risk.
When financial conditions tighten — higher rates, stricter lending standards, increased collateral requirements — financing liquidity contracts. Hedge funds reduce leverage. Companies postpone debt issuance. Households borrow less. Overall demand for risky assets falls, not because fundamentals have changed, but because the financial fuel is scarcer.
The link between financing liquidity and asset prices is more direct than market commentary tends to acknowledge. A significant share of equity-market rallies during accommodative monetary regimes does not come from improving fundamentals: it comes from abundant cheap financing pushing investors toward risky assets. The mechanism is the “search for yield”: when the risk-free return is zero or negative, money migrates into equities, high-yield credit, real estate, and crypto-assets — in that order of increasing risk. For the broader picture: The Eco3min study of how currencies price monetary regimes.
Systemic liquidity: the central bank balance sheet
This is the third layer — the most abstract and the most powerful. Systemic liquidity refers to the volume of reserves available in the banking system, which depends directly on central bank operations: asset purchases (QE), refinancing operations, movements in the Treasury account (TGA in the U.S.), and the reverse repo mechanism (RRP).
In the United States, a synthetic indicator — the net liquidity index — captures this dynamic in a single number. It is calculated simply: the Fed’s balance sheet, minus the TGA (the Treasury account at the Fed, which drains reserves when it fills up), minus the RRP (the reverse repo facility, which absorbs excess liquidity). When the index rises, bank reserves expand and risky assets tend to follow. When it falls, the reverse holds.
The correlation between this index and the S&P 500, observable since 2013, is one of the most striking — and most underdiscussed — empirical facts in modern finance. It is not perfect, and it breaks down on very short horizons. But over three- to twelve-month windows, the direction of net liquidity has historically tracked market trend more reliably than most fundamental models. The decades of Fed funds rate decisions provide the policy backdrop against which this index has moved.
It would be imprudent to turn the correlation into mechanical causality. But the underlying chain is identifiable: more bank reserves → more lending and investment capacity → more demand for risky assets → higher prices. The channel is distinct from fundamentals and can run in opposite directions: markets can rise despite a slowdown if liquidity expands, and fall despite strong earnings if liquidity contracts.
The three phases of liquidity since 2008
The history of Fed balance sheet operations since 2008 shows why liquidity has played such a central role.
Between 2008 and 2014, in response to the financial crisis, the Fed quintupled its balance sheet, from $900 billion to $4.5 trillion. The injection pushed investors toward risky assets, since the return on safe assets had collapsed to zero. The market rise between 2009 and 2014 is partly explained by this channel — more than by an economic recovery that, at first, remained fragile.
In 2018–2019, when the Fed began reducing its balance sheet, the market did not react immediately. But by late 2018, the combination of higher rates and balance-sheet reduction triggered a sharp volatility episode — the S&P 500 lost close to 20% in three months. The Fed reversed course in the first quarter of 2019.
Between 2020 and 2022, the response to the Covid crisis was the largest liquidity injection in history: the Fed’s balance sheet went from $4.2 trillion in February 2020 to a peak of $8.965 trillion in April 2022 (Fed H.4.1, FRED series WALCL). The full sequence is mapped in the framework on rate hikes and asset valuations. The subsequent rally, including the surge in crypto-assets, almost exactly matched the expansion. The tightening that began in mid-2022, symmetrically, coincided with the correction.
That contraction cycle is over. On October 29, 2025 the FOMC announced the end of balance-sheet runoff as of December 1, 2025; total assets, down to $6.536 trillion in early December 2025, have since edged higher ($6.725 trillion in June 2026, $6.747 trillion in mid-September 2026, FRED WALCL). The current phase is therefore no longer a tightening but a stabilization with a gradual rebuilding of reserves.
According to data compiled in Eco3min’s U.S. net liquidity index, every phase of Fed balance-sheet expansion since 2008 has coincided with a significant rise in risky assets, and every phase of contraction with a correction or stagnation. The regularity is not an absolute law, but it outlines a reference framework that very few other macroeconomic variables can match over the same period.
When liquidity retreats: warning signals
If liquidity is the fuel of markets, its contraction produces identifiable warning signals before equity prices correct. One of the most reliable is the high-yield credit spread — the yield gap between the riskiest corporate bonds and government bonds.
When liquidity becomes scarce, the first victims are the least liquid and riskiest assets. High-yield credit is one of them. A significant widening of credit spreads has tended to precede — by a few weeks to a few months — declines in equity markets. The pattern is visible in the data across every major stress episode since the late 1990s. Credit breaks before equities.
A second signal lies in the liquidity of the ETFs themselves. Under normal conditions, ETFs trade with tight spreads and high volume. When systemic liquidity contracts, market makers reduce their exposure, spreads widen, and premiums or discounts to net asset value appear. The phenomenon, well documented during the March 2020 crisis, is a reminder that an ETF’s liquidity is never greater than that of its underlying assets.
The weakening of ETF liquidity in high-rate regimes adds a structural dimension. When rates are elevated, the carrying cost of market-making inventory rises, reducing the incentive to maintain tight quotes. The result is a gradual deterioration in liquidity quality — not always visible in trading volumes, but measurable in spreads and order-book depth.
Liquidity and crypto-assets: the last stop in the search for yield
Crypto-assets — Bitcoin first — have proven to be the assets most sensitive to shifts in global liquidity. The correlation between the U.S. net liquidity index and the price of Bitcoin, observable since 2017, is even stronger than the one with equities. This is no coincidence: in the hierarchy of yield-seeking, crypto-assets are the last rung — where excess money lands once all other asset classes are already fully valued. Underlying data: the net-liquidity index series.
The analysis of liquidity cycles and their interaction with crypto-assets shows that every major Bitcoin rally has coincided with a phase of global liquidity expansion, and every major correction with a contraction. The pattern does not exclude other factors — halvings, institutional adoption, regulation — but it establishes a macroeconomic foundation under price moves that purely crypto-specific analysis fails to capture.
Liquidity as a unifying variable
What makes liquidity such a powerful analytical tool is that it unifies seemingly disparate phenomena. The simultaneous rally in equities, real estate, and crypto-assets in 2020–2021 was not a coincidence: it reflected a massive expansion in liquidity. The simultaneous correction across those same asset classes in 2022 was not a coincidence either.
Reading liquidity means reading financial markets as a whole, beyond sector or thematic narratives. It also means understanding why capital flows often determine prices before fundamentals — and why hidden tensions in market microstructure only become visible once liquidity recedes.
Liquidity guarantees nothing. It is not a magic indicator. But among macroeconomic variables, it is the one whose correlation with market performance has been the most stable over the past twenty years. Ignoring liquidity means navigating without a compass in an environment where fundamental noise masks the structural forces that actually determine the direction of prices.
To go further, the framework for adjusting exposure to the cycle through regime positioning integrates liquidity as one of the central signals in its analytical grid.
Last updated — 22 September 2026
Disclaimer – Financial Information: The analyses, commentary, and content published on eco3min.fr are provided for informational and educational purposes only. They do not constitute investment advice or a solicitation to buy or sell financial instruments. Past performance is not indicative of future results. All investment decisions involve risk and are the sole responsibility of the reader.
Read next
Full pillar →Euro Below Parity in 2022: What Parity Means
In September 2022, the euro fell below parity with the dollar, to around 0.95, a low not seen…
Eurozone Fragmentation: Sovereign Spreads and the Euro
The euro is issued by a monetary union without a complete fiscal union: twenty-one sovereign debts coexist under…
The Euro’s Energy Import Bill: the Gas Shock and the Currency
In 2022, the surge in gas prices turned the euro area's historic current-account surplus into a deficit and…