How Interest Rates Transmit Through the Economy: The Chain, Link by Link
Between a central bank decision and its concrete effects on savings, credit, and asset prices, a 12- to 24-month transmission chain runs through the yield curve, real rates, and valuation multiples — a structural lag that markets price long before the data confirm it.

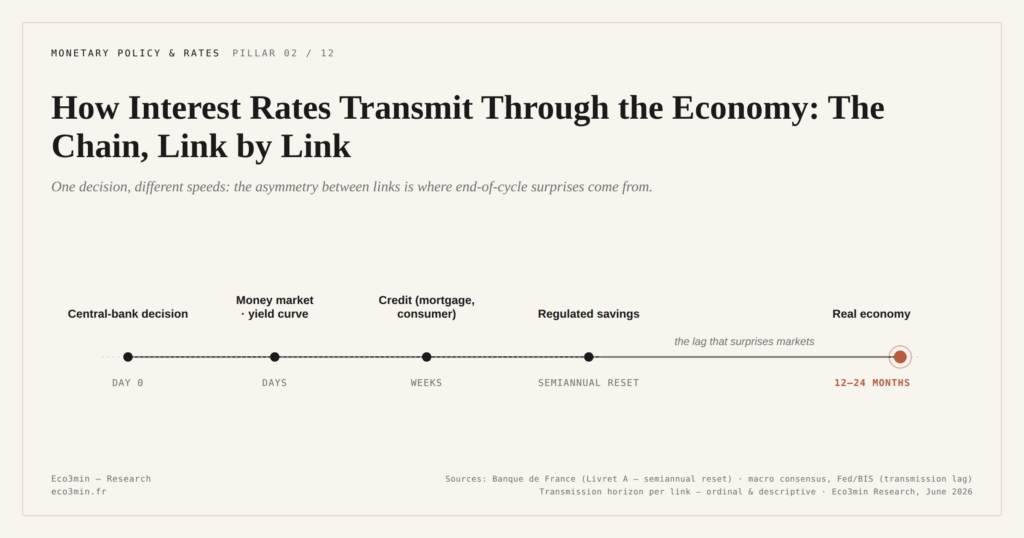
Between a central bank decision to raise or cut its policy rate and its concrete effects on savings, credit, and asset prices, a gradual transmission chain turns an abstract number into measurable economic reality — over twelve to twenty-four months, not in real time.
TL;DR
A rate change propagates as a gradual, asymmetric chain: French mortgage rates tripled from 1.1% to above 4% across 2022–2023, while savings yields lagged by quarters.
- The New York Fed estimates full transmission of a rate change takes 12 to 24 months; the economy reacts to the shock, not the level, so a 4% rate reached from 0% differs from a stable 4%.
- Yield-curve inversions have anticipated almost every U.S. recession since the 1970s, because long rates price the market's expected path for short rates, inflation, and growth.
Interest rates are the most cited economic variable and one of the least understood in terms of how they actually propagate, from the interbank market to the household portfolio.
Rates “go up” or “go down” — and that, for most commentary, is where the analysis stops. The transmission chain that connects a central bank decision to a mortgage rate, a savings yield, or the present value of a discounted cash flow is rarely described as a chain at all. It is described as a single event. Yet the gap between the decision and its real-economy effects is precisely where the most consequential market moves happen.
This article traces that chain link by link. The aim is not to recite the textbook mechanism but to make visible the invisible thread that connects a 25 basis-point move decided in Frankfurt or Washington to the cost of borrowing for a household, the yield on a regulated savings account, and the valuation of an equity index.
The policy rate: an interbank price, not a household one
The chain begins with a single number set by a central bank. In the euro area, the ECB deposit facility rate. In the United States, the Fed Funds target rate. Neither is the rate at which a household borrows. Both are the rates at which commercial banks lend reserves to one another, overnight, on the interbank market.
Why does this matter? Because the policy rate sets a floor for the cost of money throughout the economy. If the ECB pays banks 3% to hold deposits, no bank has an incentive to lend to another counterparty at less than 3%. The policy rate is the anchor from which every other rate is built — money market, government bonds, corporate credit, consumer lending. The case for short rates or long rates traces what separates the two in practice.
Seventy years of Fed Funds Rate data reveal a pattern that monthly commentary misses: the move from 1% to 5.25% between 2004 and 2006 took close to two years to fully transmit into the U.S. real economy. Markets, by contrast, had repriced almost everything before the tightening cycle ended. The same asymmetry has reappeared in every cycle since.
From the policy rate to market rates: the yield curve
The policy rate sets the short end. The economy runs on medium- and long-term rates: government bonds at 2, 5, 10, and 30 years. The full picture is drawn in this analysis of demographic shift asset prices. Together they form the yield curve, the central tool for any investor or analyst trying to read where money is priced beyond overnight horizons.
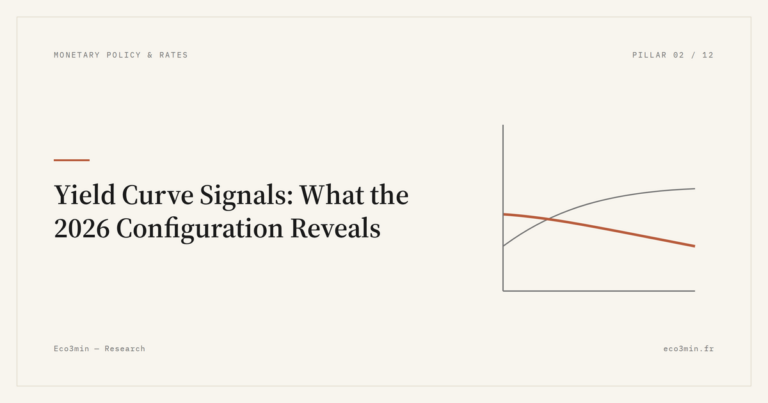
Under normal conditions, long rates sit above short rates: lending for ten years carries more uncertainty than lending overnight, so a term premium is required. But the relationship is not mechanical. Long rates reflect market expectations about the future path of short rates, inflation, and growth. The yield curve is a condensed expression of collective expectations about the economic future — which is why its inversions have anticipated almost every U.S. recession since the 1970s. The credit-channel mechanism that links curve inversion to the real cycle explains why the signal is so robust.
This is where the distinction between policy rates, market rates, and real rates becomes operational. A policy rate can rise while long rates fall, if markets expect the central bank to reverse course. Long rates can rise while the policy rate is unchanged, if inflation expectations climb. The two ends of the curve move on different information, and reading them as a single variable obscures the most important signal markets produce. The broader context is covered in our breakdown of markets climbing through an inversion.
A 4% rate with 3% inflation is not the same instrument as a 4% rate with 1% inflation. Only the real return — nominal rate minus inflation measures what an investment actually earns in purchasing-power terms. Markets price assets on real rates; commentary fixates on nominal ones.
The real rate is the nominal rate minus inflation. It is the only meaningful measure of the true cost of money. A loan at 4% in an environment of 5% inflation is, in real terms, a negative-rate loan — the borrower gains purchasing power on the debt. By contrast, a loan at 2% with 0% inflation is more expensive in real terms than a loan at 5% with 4% inflation. Every cycle turning point in the past fifty years has been visible first in real rates, not nominal ones.
What the policy rate changes for savings and credit
Day-to-day transmission runs through two main channels: savings yields and credit costs. They do not move at the same speed, and the asymmetry is itself a source of macroeconomic stress.
Regulated savings products respond with an institutional lag. The French Livret A rate is set by formula — incorporating inflation and short-term rates — with a semiannual adjustment. When the ECB raises rates, the Livret A eventually follows, with several months of delay, and not always in the same proportion. Euro life-insurance funds respond more slowly still: insurers reinvest their bond portfolios at new rates progressively, a process that takes years.
Credit reacts within weeks. Banque de France data show the average mortgage rate in France rose from 1.1% at the start of 2022 to above 4% by the end of 2023 — a tripling in under two years. That move passes directly into housing purchasing power: at constant income, rates moving from 1% to 4% reduce borrowing capacity by close to 25%.
The asymmetry produces a scissors effect on households: they pay more on new credit within weeks, but they receive higher yields on savings only with quarters of lag. This dynamic is one of the core mechanisms by which monetary policy bites — and one of the reasons tightening cycles produce recessive effects with delay, not on impact.
From rates to bonds and equities: the valuation channel
Beyond savings and credit, the rate variable structures the entire financial-market architecture.
The bond-market mechanism is direct: when rates rise, the price of existing bonds falls. A bond issued at 2% becomes less attractive once new issues offer 4%, and its market price adjusts down to align yields. This inverse relationship is one of the oldest principles in finance, and it produced historic losses in long-duration portfolios during the 2022–2023 tightening — the Silicon Valley Bank failure in March 2023 was the most visible expression of a much broader balance-sheet stress on duration-heavy holdings.
For equities, the transmission runs through two distinct channels. The discount rate: the theoretical value of a stock is the sum of its future cash flows discounted to the present, and a higher discount rate compresses that present value mechanically. The financing channel: higher rates raise the cost of corporate borrowing, weigh on investment, and erode margins. The two effects compound. In the same vein: the mapping of how tightening works through to corporate margins.
The cross-analysis of real rates and valuation ratios — including the Shiller CAPE — shows the structural relationship: very low real rates coincide with high valuations, very high real rates with depressed ones. The mechanism is direct. When money is free, investors accept paying high prices for uncertain future cash flows; when money has a price again, the required return rises and multiples compress.
The concrete consequences of rising rates on financial markets extend beyond equities and bonds. Real estate, commodities, private equity valuations, and currencies all sit downstream of the same rate variable, through channels that differ in speed but converge in direction.
Real rates over the long run: the regime variable
Among the indicators useful to long-horizon investors, few are as robust — and as underused — as long-term real interest rates.
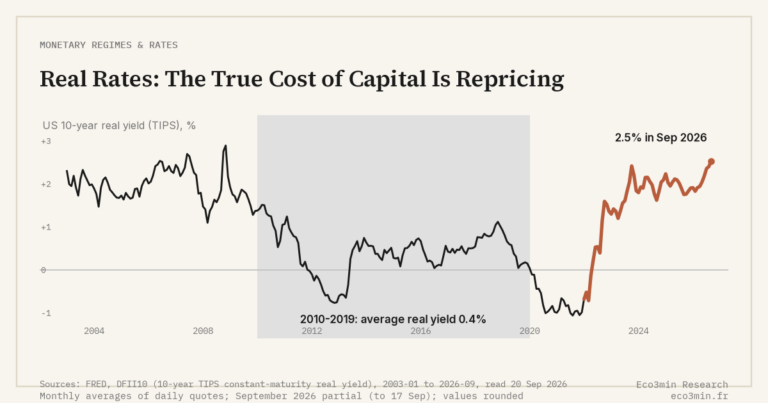
The history of U.S. real rates since the 1960s reveals sharply different regimes. The 1970s ran on negative real rates: inflation exceeded nominal rates, which rewarded borrowers and taxed savers. The 1980s and 1990s reversed the pattern, with high real rates favoring savings and bonds. The 2010–2021 period reconstructed a regime of near-zero or negative real rates, unprecedented in duration in modern monetary history.
The real-rate regime an economy occupies is one of the single most determinant variables for the relative performance of asset classes over five- to ten-year horizons. In negative real-rate regimes, real assets (real estate, commodities, equities) have historically outperformed cash-like instruments. In positive real-rate regimes, bonds have historically reclaimed their structural role in portfolios. This pattern, documented across decades, is mechanical: real rates set the hurdle rate against which every other asset is priced.
According to St. Louis Fed calculations, the annualized S&P 500 performance in negative real-rate regimes has historically differed from that in positive ones — not by accident, but because the discount factor applied to future cash flows is itself a function of real rates. Eco3min’s framework for reading financial markets through macroeconomic regimes places this variable at the center of its analytical grid.
Why transmission is slower — and more powerful — than people think
The dominant reading of interest rates is binary: rates go up, that is bad for markets; rates go down, that is good. The simplification erases the variable that actually drives outcomes — timing.
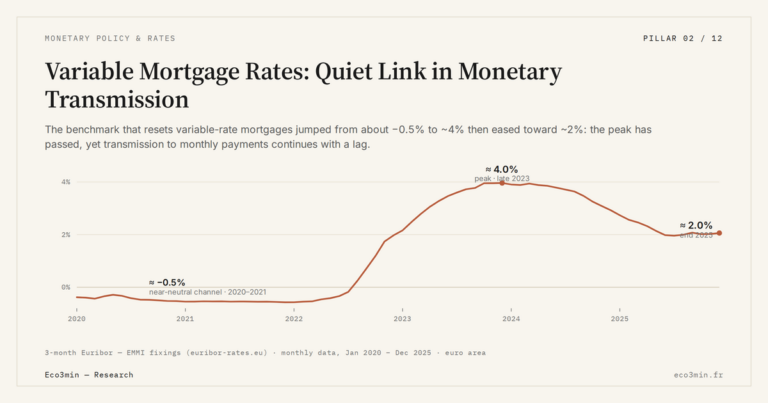
The concrete effects of a rate change on asset valuations do not show up on the day of the decision. They unfold over 6, 12, sometimes 18 months. Mortgage lending slows over several quarters. Firms refinance gradually, not all at once. Households absorb the shock when a variable-rate loan resets, not before. The economy reacts to the cumulative pass-through, not to the headline.
This inertia creates a recurring paradox. By the time a central bank reaches its terminal rate — the peak of the hiking cycle — the economy has only just begun to absorb the earlier increases. Markets, meanwhile, are already pricing the next cut. The gap between monetary action and its real-economy effects is where a large share of cyclical market moves happen — the central theme in the analysis of how economic-cycle phases interact with markets.
The most common analytical error, for investors and commentators alike, is to focus on the level of rates when direction and speed are what matter. A stable 4% rate held for two years does not produce the same effect as a 4% rate reached after a rapid move from 0%. The economy does not react to the level; it reacts to the shock. And the shock takes quarters to fade.
The New York Fed estimates that the full transmission of a policy-rate change into the real economy takes between 12 and 24 months on average. The implication is structural: when a central bank finishes its hiking cycle, the peak economic impact has not yet been reached. This lag explains a significant share of the “macro surprises” that accompany cycle peaks — the data confirm the slowdown after markets have already moved past it.
What the transmission chain means for reading markets
The rate variable is not one indicator among others. It is the foundation on which the valuation of nearly every asset rests. When the foundation moves, everything else adjusts — at different speeds, through different channels, but in a coherent direction. Reading the broader architecture of financial markets through the lens of the transmission chain replaces narrative noise with a structural map.
For investors developing a structural framework, the natural next step is the analysis of how central banks operate through the rate cycle and shape market transmission. And for those discovering the rate-based reading, the question that follows is usually the most consequential one: why do markets and the real economy seem perpetually out of sync? The answer sits largely in the timing gaps this chain mechanically creates.
Last updated — 20 September 2026
Disclaimer – Financial Information: The analyses, commentary, and content published on eco3min.fr are provided for informational and educational purposes only. They do not constitute investment advice or a solicitation to buy or sell financial instruments. Past performance is not indicative of future results. All investment decisions involve risk and are the sole responsibility of the reader.
Read next
Full pillar →Real Rates: The True Cost of Capital Is Repricing
Why real rates are reasserting themselves as markets' anchor and how to recalibrate investment and financing decisions facing…
Real Interest Rates: The Quiet Signal Reshaping Markets
Real interest rates: why their persistence in positive territory in 2026 is reshaping the rules for bonds, equities,…
OAT-Bund Spread: A Quiet Gauge of French Sovereign Risk
OAT-Bund spread: how this yield gap has become a key signal on French sovereign risk, fiscal policy and…