Understanding the Economic Cycle: Phases, Signals, and Market Implications
The economy never moves in a straight line. It fluctuates through recurring phases — expansion, slowdown, recession, recovery — whose early identification determines the relevance of investment decisions and economic policy trade-offs. Financial markets, by nature forward-looking, price in these inflection points long before official statistics confirm them — precisely because financial markets and the real economy do not move in sync. According to NBER data, the S&P 500 anticipates recessions by an average of six to nine months. Knowing how to read leading cycle signals means gaining several months ahead of consensus — and avoiding timing mistakes that prove costly during turning points.
Deciphering the economic cycle is not about waiting for quarterly GDP releases. The objective is to detect, within the continuous flow of data, the inflection points that signal a regime shift — before it becomes obvious to everyone. This requires distinguishing the economic signal from media noise surrounding each statistical release — an exercise that exposes the many pitfalls of economic interpretation.
Anatomy of the cycle: four phases, one single logic
What is the economic cycle?
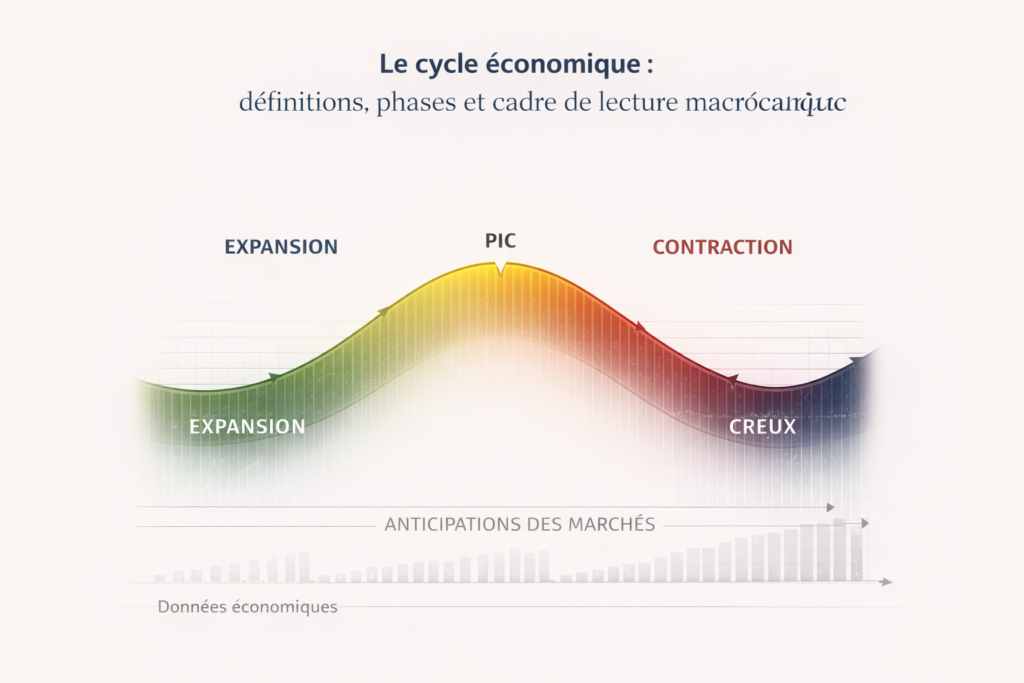
The economic cycle refers to the recurring succession of expansion and contraction phases in economic activity, driven by investment, credit, employment, and economic policy dynamics. It should not be confused with monthly indicator fluctuations or isolated exogenous shocks — even though these may precipitate or amplify an already latent turning point.
Each phase is characterized by a specific configuration of growth, employment, inflation, and financial conditions. Expansion manifests through accelerating activity, improving labor markets, and a gradual rise in inflationary pressures. The peak marks the inflection point where growth reaches its maximum before decelerating.
Contraction — or recession when prolonged — results in declining output, rising unemployment, and easing price pressures. The trough is the floor from which recovery begins. Notably, the NBER, the reference authority for dating U.S. cycles, does not use the simplistic “two consecutive quarters of GDP contraction” rule: it analyzes a set of indicators including employment, industrial production, and real income.
This stylized sequence masks a more complex reality. The post-2010 expansion defied all duration forecasts, stretching over 128 months in the United States — the longest expansion cycle ever recorded by the NBER. The Covid recession, unprecedented in its brutality — U.S. GDP contracted by 31.2% annualized in Q2 2020 according to the Bureau of Economic Analysis — was resolved in just two months. The inflation rebound of 2021–2022, with CPI peaking at 9.1% in June 2022 (Bureau of Labor Statistics), broke with the patterns established over the previous forty years.
Each cycle has its own signature, and the mistake lies in mechanically projecting past patterns onto a new environment. This uniqueness of economic cycles requires contextual analysis rather than mechanical application of historical frameworks. Beyond short-term fluctuations, long-term industrial cycles form broader waves that structure the secular trajectory of economies.
A cumulative dynamic rather than a simple alternation
Reducing the economic cycle to a mechanical succession of expansions and recessions would be an excessive simplification. Behind these four phases lies a single logic: a cumulative dynamic of investment, credit, and expectation adjustments, where decisions made at the beginning of the cycle shape the fragilities of its end.
Expansion does not arise spontaneously. It results from an accommodative financial environment, rising confidence, and capital allocation that gradually accelerates. The investment cycle plays a central role here: the buildup and subsequent pullback in capital expenditures set the pace of major activity phases. In the United States, private nonresidential investment represents around 14% of GDP (BEA, 2024), but its volatility is three to four times higher than consumption — making it the primary cyclical amplifier.
Conversely, a slowdown is not an isolated accident but the outcome of accumulated imbalances — overinvestment, inflationary pressures, monetary tightening, or credit contraction. Consensus narratives often identify a single “trigger”; the reality of the cycle is a gradual accumulation of vulnerabilities that eventually crystallize.
Final demand — household consumption and business investment — is the primary engine of this dynamic: its acceleration fuels expansion, its weakening precedes turning points. Understanding this continuity helps avoid a fragmented reading of economic data and places each indicator within a broader trajectory.
This phase-based reading remains descriptive. To understand
what truly structures the economic cycle,
it is necessary to change time horizon and analytical focus.
The cycle does not form in short-term indicators,
but in investment, productivity,
and capital allocation decisions whose effects unfold over years.
Read the major analysis: the real economic cycle, beyond short-term figures
Leading indicators: reading tomorrow in today’s data
Economic indicators fall into three categories based on their timing relative to the cycle. Lagging indicators — unemployment rate, core inflation — confirm what has already happened. Coincident indicators — industrial production, retail sales — capture the economy’s current state. Leading indicators — confidence surveys, yield curve, durable goods orders — anticipate upcoming inflection points.
This temporal distinction is crucial: macroeconomic indicators lagging the cycle can only confirm after the fact what leading signals had already revealed. Relying exclusively on unemployment or GDP to date the cycle is like driving while looking in the rearview mirror.
Three leading indicators to monitor first
The ISM Manufacturing Index. Published on the first business day of each month by the Institute for Supply Management, it synthesizes responses from more than 400 U.S. purchasing managers on orders, production, and inventories. A reading above 50 signals manufacturing expansion; a drop below this threshold generally points to a broader economic slowdown within three to six months. Its new orders component deserves special attention: it is the most forward-looking segment of the index.
The ISM inventories component also warrants close monitoring: inventory movements amplify the economic cycle, turning a simple demand adjustment into far sharper production swings. When inventory-to-sales ratios rise while new orders weaken, the turning-point signal strengthens considerably.
PMI surveys. Produced across regions and sectors by S&P Global, they provide a near real-time global map of economic conditions. Their main advantage is international comparability: a composite PMI at 48 in the euro area and 54 in the United States instantly reveals a cycle desynchronization between both sides of the Atlantic.
The Conference Board Leading Economic Index (LEI). It aggregates ten components — from building permits to consumer expectations, including industrial hours worked and the yield spread — to produce a composite indicator whose turning points historically precede recessions by six to twelve months. The LEI recorded 24 consecutive months of decline before stabilizing at the end of 2024 (Conference Board, December 2024), illustrating persistent recessionary pressures that the labor market ultimately absorbed without a breakdown.
Confidence surveys hold a special place in this toolkit. Unlike activity data, which measure the past, they capture economic agents’ intentions — and therefore upcoming inflections. Their predictive value nevertheless depends on the ability to distinguish trend movements from erratic fluctuations.
Interpreting a single month of data as a turning-point signal. Leading indicators must be read as trends over three to six months to filter statistical noise. Monthly figures are often misleading: later revisions, calendar effects, and survey volatility — all factors that make moving averages more reliable than raw data.
This reading difficulty fuels recurring economic forecasting errors. The IMF itself acknowledges having correctly anticipated only 5 of the 153 recessions that occurred between 1992 and 2014 in its April forecasts of the preceding year (Loungani, 2017). Economists regularly misjudge turning-point timing precisely because they place too much weight on point data and not enough on underlying cumulative dynamics.
When signals diverge: real economy versus financial markets
One of the major complexities of contemporary macro analysis lies in the growing divergence between signals emitted by the real economy and those coming from financial markets. This disconnect, particularly visible since 2020, challenges the reliability of traditional analytical frameworks and requires a more nuanced interpretation.
Equity markets can reach record highs while manufacturing activity contracts — a configuration observed several times between 2022 and 2024, when the S&P 500 advanced while the ISM manufacturing index remained below the 50 threshold for 26 consecutive months (ISM, March 2024). Credit spreads can compress even as payment defaults accumulate in certain segments of the economy.
This apparent inconsistency can be explained by three structural factors. Massive central bank intervention has durably altered the signaling function of financial prices: the Fed’s balance sheet expanded from $900 billion in 2008 to a peak of $8,965 billion in 2022 (Federal Reserve). The sector concentration of equity indices — the “Magnificent 7” accounted for more than 30% of the S&P 500’s market capitalization at the end of 2024 — masks the more contrasted reality of the productive fabric. Finally, abundant liquidity has created a regime in which financial assets evolve partially disconnected from macroeconomic fundamentals.
Our in-depth analysis of this divergence between financial signals and the real economy deciphers the mechanisms at work and their implications for asset allocation. This gap between the real economy and markets is not a temporary anomaly but a structural feature of the post-2008 regime: financial valuations now embed a permanent liquidity premium that partially disconnects them from underlying profit flows.
Characteristics of the new post-Covid cycle
The economic cycle that opened after the pandemic shock displays unprecedented features that require revising certain analytical frameworks. Three specificities deserve emphasis.
A supply shock disguised as a classic recession
Unlike classic recessions, triggered by excess credit or monetary tightening, the 2020 contraction resulted from a voluntary and simultaneous shutdown of activity across advanced economies. The recovery that followed did not need to purge the usual imbalances — excess inventories, private over-indebtedness, overinvestment — but instead encountered supply bottlenecks of unprecedented magnitude. The New York Fed’s Global Supply Chain Pressure Index reached a record level of 4.3 standard deviations above its historical average in December 2021.
Fiscal and monetary stimulus of historic magnitude
The fiscal stimulus deployed in advanced economies represented between 10% and 25% of GDP depending on the country (IMF, Fiscal Monitor 2021). In the United States, three successive plans — CARES Act, Consolidated Appropriations Act, American Rescue Plan — totaled roughly $5 trillion in injections. This volume of purchasing power fueled excess demand for nearly two years.
This expansionary fiscal policy profoundly altered cycle dynamics, temporarily substituting public impulse for deficient private demand. The resulting configuration — boosted demand, constrained supply — triggered the return of inflation once believed to be permanently under control after four decades of the Great Moderation.
A structurally transformed labor market
The unexpected resilience of employment in the face of the most brutal monetary tightening since 1980 constitutes the third singularity of this cycle. The Fed raised rates by 525 basis points in 16 months between March 2022 and July 2023, yet the U.S. unemployment rate did not exceed 4.3% (BLS, August 2024) — a level incompatible with models that predicted a recession would be necessary to bring inflation back to target.
This configuration suggests structural shifts — demographic aging reducing labor supply, lower post-Covid participation rates, a redefinition of attitudes toward work — whose full scope remains to be measured. Our report dedicated to the new economic cycle explores these transformations in depth. In this context, central banks in 2026 face a particularly delicate balancing act between supporting activity and containing inflation.
This unprecedented configuration has also intensified the desynchronization of economic cycles across regions. The U.S. economy posted 2.8% growth in 2024 while the euro area stagnated around 0.8% (Eurostat, flash estimate Q4 2024). This divergence complicates global interpretation and requires region-specific analysis.
Structural imbalances shaping the cycle
Beyond cyclical fluctuations, long-term structural forces bend the trajectory of the cycle and alter its characteristics. Two major imbalances deserve particular attention, as they condition the policy room available in the event of a downturn.
The U.S. current account deficit: privilege or vulnerability?
The U.S. current account deficit, stabilized around 3% to 4% of GDP since 2022 (Bureau of Economic Analysis), reflects a structural absorption of global resources by the United States — financed through debt issuance and the dollar’s exorbitant privilege. Its sustainability depends on the confidence of foreign investors, who hold around 30% of U.S. federal debt (Treasury International Capital, 2024).
Analysis of the U.S. current account deficit as a structural macroeconomic risk sheds light on the mechanisms through which this imbalance affects markets. Any episode of distrust — confidence crisis, trade war, questioning of the dollar’s status — could turn this steady financing flow into a major source of financial stress.
The productivity slowdown: an invisible ceiling
Productivity, the ultimate driver of living standards growth, has shown anemic progress for around fifteen years in most advanced economies. In the United States, labor productivity growth fell from an average of 2.7% per year between 1995 and 2005 to about 1.4% between 2005 and 2023 (Bureau of Labor Statistics). In the euro area, the slowdown is even more pronounced.
This slowdown, which some attribute to the exhaustion of gains from the digital revolution and others to statistical measurement issues, directly weighs on potential growth and reduces shock-absorption capacity. The gap between actual and potential growth — the output gap — is moreover one of the key indicators used to position the economy within the cycle.
Productivity itself shapes the economic cycle: accelerations support non-inflationary expansion phases, while slowdowns intensify pressure on margins and prices. Our study on the productivity shock as an underestimated macroeconomic risk deciphers the concrete implications for investment and asset valuation.
Macro-financial implications across cycle phases
Cycle positioning directly determines the relative performance of asset classes — a relationship long documented, notably formalized by sector rotation models (Fidelity, “Business Cycle Approach to Sector Investing”). In early expansion phases, cyclical equities — industrials, materials, consumer discretionary — generally outperform. As the cycle matures and inflationary pressures emerge, commodities and real assets take the lead.
Late in the cycle, when monetary tightening produces its effects, defensive sectors and high-quality bonds regain attractiveness. In recession, cash and sovereign bonds become preferred safe havens — provided the downturn is not inflationary in nature, in which case bonds lose their protective role, as illustrated in 2022.
This analytical framework, useful as it is, cannot be applied mechanically. Cycles overlap — the manufacturing cycle may diverge from the services cycle — monetary policies alter usual correlations, and exogenous shocks disrupt expected sequences. The objective is not to predict the cycle’s turning point with certainty, but to calibrate exposures based on probabilities and risk asymmetries specific to each phase.
An additional difficulty lies in distinguishing between slowdown, normalization, and rupture. Not every activity dip signals a recession: it may simply reflect a return to trend after an acceleration phase. The opposite phenomenon also exists: an economic slowdown can occur even when the figures look good, masked by base effects or diverging sector dynamics.
Conversely, talking about recession before the cycle actually turns is a frequent analytical mistake. Markets experienced this in 2022–2023, when consensus anticipated a U.S. recession that never materialized — a reminder that historical models, however robust, do not replace rigorous contextual analysis.
The economic cycle is not read in delayed GDP figures, but in the convergence or divergence of leading indicators — ISM, PMI, yield curve, confidence surveys — which anticipate inflection points several months ahead. The current cycle, born from an unprecedented supply shock and supported by historic stimulus, has broken several established empirical regularities. Its interpretation requires combining macro data, financial conditions, and structural dynamics rather than relying on a single framework.
← Back to pillar page Macroeconomics and geopolitics