Why Financial Markets and the Real Economy Are Out of Sync
Stocks rise as the economy slows; they fall on strong data. The 'disconnect' is not a malfunction — it is the mechanical consequence of comparing a leading indicator (prices) with lagging ones (GDP, employment). Credit, liquidity, and expectations move first.

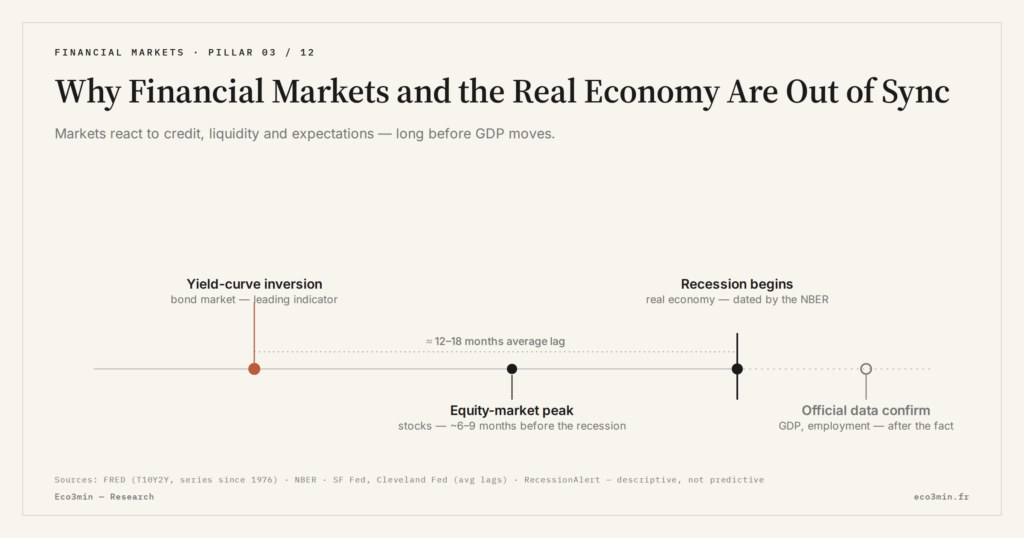
Financial markets react to credit, liquidity, and expectations — three variables that structurally lead conventional economic indicators (GDP, employment, output). The gap is not an anomaly: it is the normal functioning of a system in which prices reflect the expected future, not the measured present.
TL;DR
Markets price the expected future while GDP and employment measure the past: a structural, quantifiable lag in which credit and liquidity turn months before the official data.
- The yield curve is the oldest leading signal: its inversion has preceded every U.S. recession since 1976, with recession following 12 to 18 months later and equities typically correcting 6 to 9 months before the recession becomes official.
- Credit and liquidity move in real time while profits lag: in the second half of 2020 markets rebounded violently while the economy was still in recession, because they were reacting to liquidity expansion, not still-falling earnings.
- The lag inverts how indicators read: record-low unemployment is a late-cycle signal and rising unemployment often marks the bottom, which is why pro-cyclical investors buy on good news and sell on bad.
The “disconnect” between the stock market and the real economy is one of the most widespread misreadings in finance. It comes from confusing leading indicators with lagging ones.
One observation puzzles beginner investors and seasoned economists alike: financial markets and the real economy seem to live on different timelines. Stocks rise as the economy slows. They fall when the data are strong. Markets anticipate recessions months before they are officially declared — then rebound while unemployment is still rising.
This is not a bug in the system. It is neither proof that markets are irrational nor that they are manipulated. It is the result of a structural mechanism: markets and the real economy do not react to the same variables, and those variables do not move at the same time. Understanding the lag provides the most fundamental framework for interpreting market moves.
The apparent paradox: markets that are “wrong”
Every economic cycle produces its share of puzzled commentary. “How can the stock market rise when GDP is contracting?” — or, symmetrically, “Why are markets falling when corporate earnings are at record highs?”
The questions rest on an implicit assumption: that markets should reflect the current state of the economy. The assumption is false — not by convention, but by design. A financial market is a mechanism for aggregating expectations. The price of a stock does not reflect today’s earnings; it reflects the discounted sum of future earnings as anticipated, collectively, by investors. If earnings are still strong but investors expect them to deteriorate, the price falls now — not in six months. Companion analysis: the Eco3min study of the cases where tightening spares equities.
The mechanism is well known in theory. Its practical implications rarely are. Comparing “the stock market vs. the real economy” is structurally asymmetric: one is a forward-looking indicator (market prices), the other consists of backward-looking indicators (GDP, employment, industrial production, all measuring what already happened last quarter).
The result is a permanent and predictable lag. Markets turn before the economy — both to the upside and to the downside. The lag is not random: it follows regular patterns that historical yield curve data can quantify with remarkable precision.
First mechanism: credit turns before GDP
Credit is the fuel of the real economy: it finances household consumption, business investment, and housing construction. When credit contracts, activity slows. When it expands, activity picks up. But the link is not immediate: credit leads activity by several quarters.
There is a mechanical explanation for the lag. Banks tighten lending standards when they perceive a deterioration in the outlook — that is, before deterioration appears in GDP figures. A household that can no longer borrow does not cut spending the same day: it first draws down savings, delays plans, and only then adjusts its standard of living. The process takes time. Credit tightening is an event; its consequences for activity are a process.
Financial markets, by contrast, react to credit conditions in real time. This is why high-yield credit spreads are considered a leading indicator for equities: when credit tightens, markets price it immediately, well before GDP slows.
The study of the economic cycle measured in real terms shows that the turning point in activity systematically follows the turning point in credit. It is in that interval — a few months, sometimes a year — that markets seem “disconnected” from the economy. They are not: they are reacting to the cause (credit) while the economy is still showing the effects of the previous cause (expansion).
Second mechanism: liquidity moves before profits
Liquidity — the volume of reserves available in the financial system, controlled by the central bank — affects demand for risky assets before corporate earnings change.
When the central bank injects liquidity (buying bonds, lowering rates, easing refinancing conditions), the effect on markets is almost immediate: investors have more financing capacity and the required risk premium falls. Prices rise. But corporate profits do not change yet: they react to real economic conditions, which have not yet been affected by the policy shift.
The lag between liquidity and profits creates phases in which markets rise “for no fundamental reason.” That is exactly what happened in the second half of 2020: markets rebounded violently while the economy was still in recession. The explanation is not that markets were “right too early” — it is that they were reacting to liquidity (in massive expansion) rather than to profits (still falling). The complete framework appears in the analysis of interest-rate transmission to asset valuations.
The reading of liquidity conditions and their impact on financial conditions provides the structural map for understanding these phases. And the dynamics of market expectations show that investors do not wait for confirmation of the recovery before positioning: they act as soon as the liquidity signal turns favorable.
Third mechanism: leading indicators vs. lagging indicators
Markets do not reflect the current state of the economy. They reflect expectations about its future state. And those expectations are formed on the basis of leading signals — not lagging data.
When an investor buys a stock, they are not buying last quarter’s earnings. They are buying a stream of future cash flows discounted to the present. If current earnings are good but leading signals (orders, PMI surveys, credit conditions, inventories) point to a slowdown, the price falls — logically. If earnings are weak but the same signals point to a rebound, the price rises — just as logically.
The problem is that the most visible indicators — unemployment, quarterly GDP, industrial production — are lagging indicators. They confirm what has happened, not what will happen. The leading indicators in Eco3min’s macro framework — yield curve, durable goods orders, confidence surveys, credit conditions — move first. And that is what markets react to.
A commentator who says “the stock market is disconnected from reality” is really comparing a leading indicator (market prices) with a lagging indicator (GDP). They are not observing an anomaly; they are measuring a structural lag. Far from being a malfunction, this lag is the mechanical consequence of the fact that markets aggregate expectations while economic statistics measure past events.
The yield curve: the oldest leading signal
Among all leading indicators, the yield curve occupies a special place. The inversion of the curve — when short-term rates rise above long-term rates — has preceded every U.S. recession since 1976. No other indicator can claim such a track record.
Why is the curve so reliable? Because it aggregates the bond market’s collective expectations — the deepest and most liquid market in the world — about the future path of short rates, inflation, and growth. When bond investors, in aggregate, accept lending for 10 years at a yield below the 2-year rate, they are expressing a shared conviction: the central bank will have to cut in the foreseeable future because the economy is going to slow.
The average delay between a curve inversion and the start of a recession runs between 12 and 18 months — with significant variance. That delay corresponds to the time required for tighter financial conditions (of which the inversion is a symptom) to work through the real economy. Equity markets, meanwhile, often begin to correct 6 to 9 months before the official start of a recession — after the inversion, before the recession is confirmed.
This sequence — inversion, then stock-market correction, then recession — is the clearest illustration of the structural gap between markets and the economy.
Economic indicators and their timing traps
Understanding the lag also means recognizing that economic indicators can mislead when read outside their temporal context.
A very low unemployment rate, for example, is usually read as a sign of economic health. In cyclical terms, unemployment at a low is often a late-cycle signal — because it means the labor market is tight, wages are accelerating, corporate margins are under pressure, and the central bank will soon have reasons to tighten. Markets, which read these signals in real time, can start correcting while unemployment is at its lows and the headlines remain upbeat.
Symmetrically, rapidly rising unemployment, which reads as catastrophic in the media, is often the signal that the worst is over — from the market’s standpoint. When unemployment rises, the central bank is pushed to ease, credit gradually loosens, and the conditions for recovery are created. Markets begin pricing that recovery long before it shows up in the statistics.
The cross-data on real rates and valuations confirm the pattern: the strongest 10-year equity returns have historically been recorded from moments of maximum pessimism — when lagging indicators were at their worst but financial conditions had already begun to ease.
What the lag means for reading markets
The lag between markets and the economy has profound implications for how financial news should be interpreted.
The first implication is that comparing the stock market to GDP, as such, has no analytical meaning. They measure different objects on different time horizons. The analysis of the divergence between equities and the real economy shows that the divergence is neither new nor abnormal — it is structural.
The second is that narrative explanations trying to account for market moves with the events of the day are almost always too simplistic. Markets do not react to published data; they react to surprise — that is, to the gap between published data and what was expected. A good jobs report in a context where markets were expecting an excellent one is, in reality, a bad signal.
The third concerns the costliest investor mistakes: buying when the news is good (that is, late in the cycle) and selling when the news is bad (that is, when most of the decline is already behind). This pro-cyclical behavior is the direct result of confusing lagging indicators with leading ones.
Cycles as a unified framework
The lag between markets and the economy is the permanent consequence of the cyclical structure of the economy. The phases of the economic cycle — expansion, slowdown, contraction, recovery — do not occur synchronously across all indicators.
Credit turns first. Liquidity and financial conditions follow. Markets anticipate the turning point. Then the real economy adjusts — with months of delay. The sequence, repeated in every cycle, is what creates the persistent impression of a “disconnect.”
For the reader looking to develop a cycle-reading method for adjusting exposure, the sequence is not an academic curiosity: it is a tool. The most useful signals for market direction are not economic data themselves, but their position in the cycle — and that position is read in leading indicators, not lagging ones.
Macroeconomics is not an abstract discipline reserved for central-bank economists. For anyone who takes the time to understand its mechanisms, it is the most robust framework for navigating an environment of markets structurally polluted by short-term narrative noise.
Last updated — 20 September 2026
Disclaimer – Financial Information: The analyses, commentary, and content published on eco3min.fr are provided for informational and educational purposes only. They do not constitute investment advice or a solicitation to buy or sell financial instruments. Past performance is not indicative of future results. All investment decisions involve risk and are the sole responsibility of the reader.
Read next
Full pillar →Euro Below Parity in 2022: What Parity Means
In September 2022, the euro fell below parity with the dollar, to around 0.95, a low not seen…
Eurozone Fragmentation: Sovereign Spreads and the Euro
The euro is issued by a monetary union without a complete fiscal union: nineteen sovereign debts coexist under…
The Euro’s Energy Import Bill: the Gas Shock and the Currency
In 2022, the surge in gas prices turned the euro area's historic current-account surplus into a deficit and…