Financial Tools & Simulators: Test Your Assumptions, Stress Your Decisions
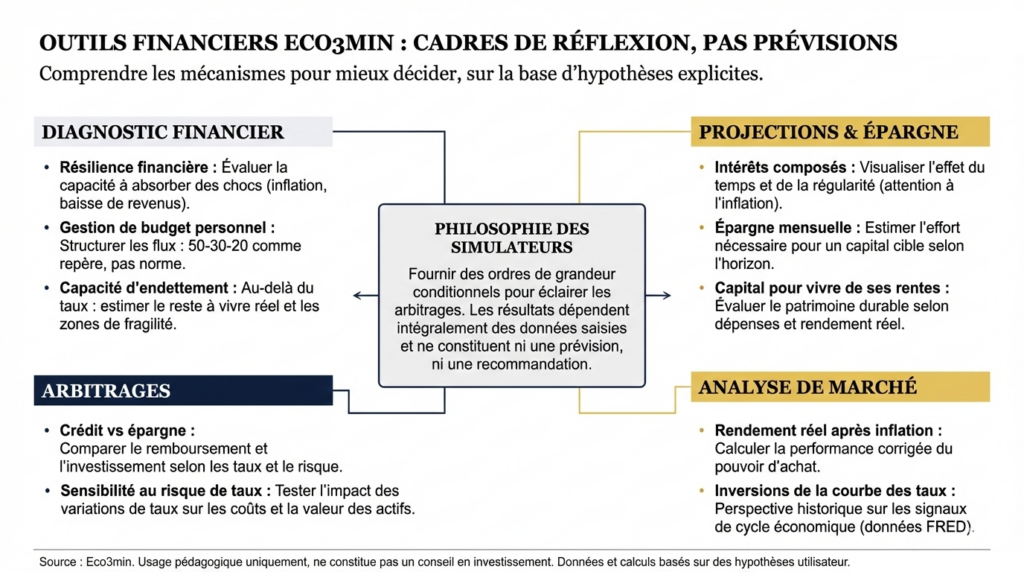
Eco3min simulators do not produce answers — they make the implicit assumptions behind your financial projections visible. Each tool translates a macroeconomic mechanism into concrete orders of magnitude: inflation, real rates, sequence of returns, cost of leverage. Results depend entirely on the assumptions entered — and the value of these tools lies precisely in highlighting the conditions under which your scenario holds or breaks. The financial principles provide the intellectual framework; the tools make it testable.
A simulator does not tell you what will happen — it tells you what happens if your assumptions are correct. The distinction is fundamental. A compound interest calculator showing €76,000 from €10,000 invested over 30 years does not predict you will get €76,000 — it says that if the return is 7% per year every year, without interruption, without inflation, without fees, without forced withdrawals, then the result is €76,000. Each “if” is an assumption the macroeconomic regime can invalidate. Eco3min simulators are designed to make these assumptions visible — not to hide them behind a reassuring figure.
Diagnosis: what is your real margin of safety?
Before any investment or financial commitment, a prior question is essential: how much shock can your situation truly absorb? Job loss, persistent inflation, rising rates, market declines — financial resilience is not measured by returns earned but by flexibility available when favorable assumptions stop holding.
The financial resilience simulator evaluates your situation’s ability to absorb a prolonged economic shock — persistent inflation, income decline, rising rates. It does not seek to optimize returns; it focuses on margins of safety and budget flexibility. This is the first tool to use — before asking about returns.
Personal budget: where does your money really go?
Structure and visualize a budget by separating income, fixed expenses, variable expenses, and flexibility margins. In persistent inflation regimes (5.2% in 2022, 4.9% in 2023, INSEE), constrained expenses (housing, energy, food — food inflation peaked at 15.9%) distort budget structure even when nominal income does not adjust at the same pace. The 50-30-20 rule is a useful reference — not a universal norm. Under persistent inflation, it mechanically shifts toward 55-30-15 or 60-25-15.
→ Access the personal budget tool
Debt capacity: the ratio that doesn’t tell the whole story
The regulatory debt ratio (35% HCSF cap in France) is a ceiling — not a target. This simulator assesses real credit sustainability by going beyond the ratio to analyze disposable income, unavoidable expenses, and fragility zones under rate increases or income declines. A household at 34% debt with €500 disposable income is more fragile than one at 30% with a €2,000 buffer — the ratio alone means nothing without context.
→ Access the debt capacity simulator
Projections: what time does to your savings — and what it doesn’t guarantee
Projection tools make visible the effect of time, consistency, and return on capital growth. Their value lies in comparing scenarios — not producing a precise figure. Every projection is valid only if assumptions hold — and the macroeconomic regime determines whether they do.
Compound interest: the path, not the promise
The compound interest mechanism is real and powerful — but projections derived from it are always conditional. €10,000 at 7% annually for 30 years = €76,000 on a spreadsheet. In practice: the average investor earns 5.5% annually (Dalbar QAIB, -1.5% behavioral underperformance) → ~€50,000. After average 2% inflation → real purchasing power ~€28,000 in constant euros. After fees (1% active fund) → less. The S&P 500 delivered zero real return between 2000 and 2013 — “compound interest” compounded at 0% for 13 years. This calculator shows the full trajectory — making assumptions, fragility points, and the gap between theoretical promise and probable outcome visible. The gap between intuition and reality is a common bias; misleading promises systematically omit the impact of inflation on real returns.
→ Access the compound interest calculator
Monthly savings: how much to set aside — and for how long?
Estimate the savings effort required to reach a target capital based on time horizon and assumed return. The €200/month to €100,000 projection illustrates the power of consistency — provided return and duration assumptions are explicit. Discipline and consistency matter more than initial amount — but the difference between slow accumulation and financial acceleration depends on the market regime.
→ Access the monthly savings calculator
Capital required for income: how much is truly needed?
Estimate the wealth required to generate sustainable income without eroding principal. The result depends on three variables: spending level, expected real return, and withdrawal horizon. The 4% rule (Trinity Study) assumes a 60/40 portfolio in US context 1926–2023 — it is neither universal nor guaranteed. Under high inflation or low real-rate regimes, sustainable withdrawal rates may be significantly lower. Leverage effects and diffuse risk show that overly high withdrawal rates can compromise the entire strategy — especially if early withdrawals coincide with market corrections (sequence risk).
→ Access the retirement capital simulator
Trade-offs: comparing two paths by making assumptions explicit
Debt vs savings: the spread that determines the answer
Should you repay debt early or keep your savings? The answer depends on the spread between the loan rate and the available risk-free return — and that spread changes with the regime. Loan at 1.2% (2021) vs Livret A at 3% (2023) → keeping savings is arithmetically superior. Loan at 4% (2023) vs Livret A at 3% → early repayment becomes rational. This simulator compares both paths and makes the spread visible.
→ Access the debt vs savings simulator
Interest rate risk sensitivity: what does a regime shift cost?
Rate risk simultaneously affects borrowing costs, bond portfolio values, and savings capacity — depending on how interest rates transmit through the economy. A 200 bps increase turns a variable-rate loan from “manageable” to “constraining.” The same rise can reduce long-term bond fund value by 15–20%. This simulator tests multiple rate scenarios to highlight underestimated exposures — a structural vulnerability reading of wealth under monetary regime shifts.
→ Access the rate risk sensitivity simulator
Macro analysis: placing your decisions in economic context
Real return after inflation: what truly remains
The most important financial education filter applied in one calculation. Livret A at 3% when inflation is 5% = -2% purchasing power per year destroyed. Euro fund at 2% when inflation is 5.2% = -3.2% annually. This simulator calculates inflation-adjusted performance — the only figure that shows whether your money is enriching or eroding you. It complements analysis of euro funds and blind spots in financial education.
→ Access the real return after inflation simulator
Yield curve inversions: the cycle’s leading signal
Compilation of all 2Y–10Y spread inversion episodes since 1976 (FRED data), observed lags before each recession (NBER), and associated statistical insights. Yield curve inversion preceded every US recession since 1970 — with an average lag of 12–18 months. It is not infallible (false signals occurred), but it is the most documented leading cycle signal. Downloadable CSV data — an economic cycle reading tool developed in the Economic Cycle sub-pillar.
→ Access historical yield curve inversion analysis
What simulators show — and what they don’t
A simulator deliberately simplifies reality to highlight dominant mechanisms — not to predict outcomes. Simulators assume parameter stability (rates, inflation, contribution regularity) that no real path fully matches. They do not model exogenous shocks, regime shifts (ECB from -0.50% to +4.00% in 18 months), or behavioral constraints (panic selling at market lows). Understanding these limits is what distinguishes useful financial education from tool accumulation without perspective. Eco3min simulators are thinking instruments — descriptive, never prescriptive — complementing analyses developed in investment strategies.
Eco3min tools are designed for educational purposes. They do not constitute investment advice or personalized recommendations. All financial decisions remain an individual responsibility.
← Back to Financial Education