Equity Markets and the Economic Cycle: The Anticipation Mechanism
Equity markets do not wait for economic data — they anticipate it. This structural timing gap — and the misinterpretations it causes — is one of the most decisive and least understood mechanisms of how financial markets operate.
Markets do not reflect the economy — they bet on its trajectory.
Equity markets operate as continuous discounting machines: they incorporate today the expectations about tomorrow’s earnings, rates and financial conditions. This structural timing gap with observable economic data is the main source of divergences between stock indices and macro readings.
Understanding this anticipation mechanism changes how we read markets: it is not the released data that moves prices, but the gap between that data and what was expected. This distinction explains why markets can rise on bad news and fall on good news.
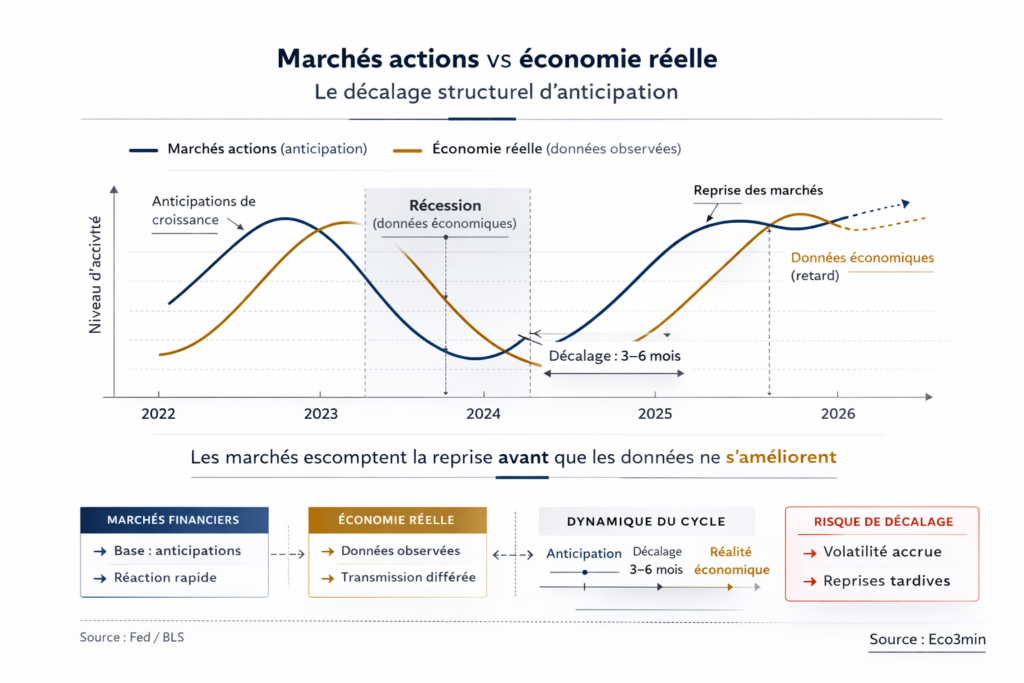
The S&P 500 hit its low in October 2022 — six months before the trough in U.S. manufacturing activity (Fed data, January 2026). This gap is not an anomaly: it is the hallmark of how markets function. In the last five U.S. recessions, the index rebounded on average 4.8 months before the labor-market trough (historical series from the Bureau of Labor Statistics). Markets do not look at today’s economy — they bet on tomorrow’s. And that perpetual bet, grounded in discounting future cash flows, creates the structural divergence between markets and the macro cycle that most market commentary struggles to explain — a mechanism analyzed in detail in why financial markets and the real economy never move at the same time.
This anticipation mechanism connects with the cycle dynamics and market expectations and sits within the broader framework of market anticipation dynamics.
Markets do not reflect the economy — they bet on its trajectory. The equity-market anticipation mechanism rests on continuous discounting of future flows (earnings, rates, financial conditions), producing a structural 4–8 month lead between market inflection points and those of the real economy. This lead is not a malfunction — it is the central price-formation mechanism for equities. The structural divergence between indices and the real economy is amplified by index concentration (the top 10 names represent ~35% of the S&P 500) and by profit globalization. The anticipation mechanism is well established in financial theory; precise calibration within each cycle remains inherently uncertain.
Why equity markets always lead the real economy
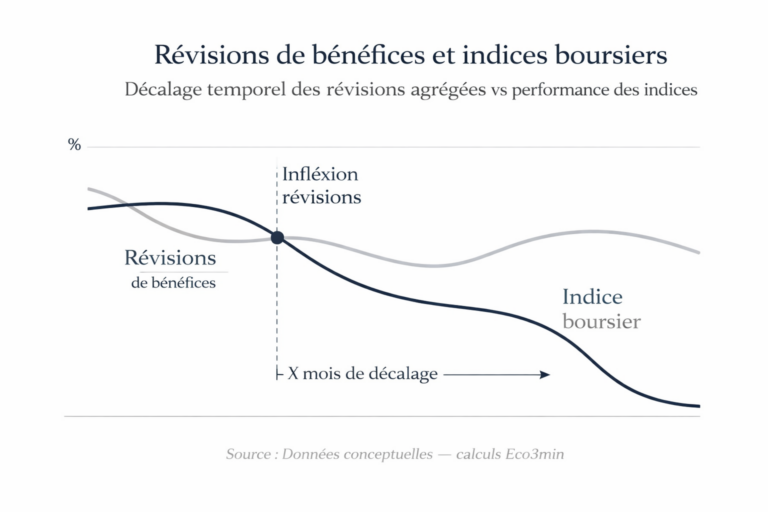
The gap between equity markets and the real economy is not random: it follows an identifiable causal chain whose central mechanism is the discounting of future flows.
Anticipation of the macro trajectory → Revision of discount rates and expected earnings → Valuation adjustments → Price moves → Confirmation (or refutation) by actual data
Markets turn 4–8 months before macro indicators. That is the norm, not the exception.
Trigger: revisions to expectations. The starting point is not the release of an economic number but a change in investors’ expectations about future earnings, interest rates and financial conditions. This process is continuous: at any moment the price of a stock reflects the present value of expected cash flows over an infinite horizon (DCF model). Any information that can alter those expectations — an employment print, a central-bank remark, a corporate result — is incorporated almost instantly. A foundational working paper by Eugene Fama (1970, “Efficient Capital Markets”) formalized this mechanism under the informational efficiency concept, showing that market prices reflect all available information — not the current state of the economy, but the expectations about its future path.
Transmission channel: differential discounting. The way expectations translate into price moves runs through the discount rate. When investors expect a slowdown, two forces act simultaneously: expected earnings are revised down and the discount rate changes (up if risk premia rise, down if monetary easing is anticipated). The interaction of these two sometimes-opposing forces explains the “bad-news paradox”: disappointing data can be received positively if they increase the odds of monetary easing and the discount-rate effect outweighs the earnings downgrade. The Senior Loan Officer Opinion Survey (Fed, January 2026) illustrates this dynamic: credit conditions eased in Q4 2025 even while activity indicators moderated — the market had already priced in the central bank’s anticipated response.
Amplifier: index concentration and profit globalization. Two structural features of modern indices amplify the gap between markets and the real economy. First, concentration: in Q4 2025, the top 10 names accounted for nearly 35% of the S&P 500’s weight — an unprecedented concentration meaning “the health of the market” often reflects a handful of mega-cap tech companies rather than the domestic economy. Second, profit globalization: a U.S. multinational can thrive on sales in Asia while U.S. consumers struggle. BEA data (2025) estimate that over 40% of S&P 500 companies’ revenues come from abroad — a structural decoupling between equity indices and national GDP documented in the analysis of equity/real-economy divergence.
Consequence: a systematic, bidirectional timing gap. Together these mechanisms create a lead that operates both ways through the cycle. On the downside, markets anticipate slowdowns and correct before data worsen — market peaks precede activity peaks by on average 6–12 months. On the upside, markets anticipate recoveries and rally before data improve — market troughs precede activity troughs by 4–8 months. A BIS working paper (Claessens, Kose & Terrones, 2012) analyzing 44 countries over 50 years confirms that equity markets consistently lead real-activity indicators.
- 4.8 months: average lead of the S&P 500 trough vs. the labor-market trough in the last five U.S. recessions. Source: BLS, FRED.
- 6–12 months: average lead of market peaks over macro activity peaks. Source: BIS, Claessens et al., 2012.
- 35%: weight of the top 10 stocks in the S&P 500 (Q4 2025) — historically unprecedented concentration. Source: S&P Dow Jones Indices.
- +40%: share of S&P 500 revenues generated abroad. Source: Bureau of Economic Analysis, 2025.
- Low correlation: the relationship between GDP growth and stock returns is historically weak and can even be negative. Source: BIS, long-term equity return studies.
What the consensus incorporates — and the framing error it perpetuates
The dominant interpretation of market moves, propagated by much financial commentary and media, rests on a persistent framing error: equating market moves with a (faithful or distorted) reflection of the state of the economy. This frame generates two symmetric mistakes: concluding “the economy is strong” because stocks rise, or declaring “markets are disconnected from reality” when stocks rise despite weak data.
The mistake is not with the data but with the temporal frame. Markets do not reflect today’s economy — they bet on tomorrow’s. When the S&P 500 rises while the manufacturing PMI falls, it is not evidence of “irrational disconnection”: it signals that investors anticipate a future improvement (monetary easing, profit recovery, normalization of financial conditions) that current data do not yet show.
The consensus is right to note the gap — but it systematically interprets it backward. The relationship between GDP growth and stock performance illustrates the trap: the historical correlation is weak or sometimes negative because expected growth is already priced in. It is not growth that determines returns — it is the surprise relative to expectations. A country with low growth can outperform if expectations were overly pessimistic; a high-growth country can underperform if the optimism was already priced. The BIS documents this phenomenon across decades and markets.
Interpreting a stock-market rally as proof of a healthy economy, or a market decline as a signal of imminent recession. Markets price expectations, not the current state. The divergence between indices and macro is normal — it is the price-formation mechanism. Betting on countries with higher expected growth in hopes of better stock returns ignores that that growth is already reflected in valuations. Only surprises — positive or negative — generate outperformance.
| View: “markets reflect the economy” | View: anticipation mechanism | |
|---|---|---|
| Time frame | Markets react to published data | Markets anticipate future data (4–8 months lead) |
| Market/economy divergence | Signal of a bubble or disconnection | Normal price-formation mechanism |
| Bad news + market rise | Market irrationality | Anticipation of monetary easing |
| GDP and returns | High growth = high returns | Only surprises versus expectations matter |
| Key indicators | GDP, employment, industrial production | Earnings revisions, risk premium, positioning vs. expectations |
The four cycle phases and differentiated equity behaviour
The anticipation mechanism does not operate uniformly across the cycle. Each phase produces specific configurations that change the nature and intensity of the gap between markets and the real economy.
Recovery phase (cycle trough): markets rebound while data remain weak. Earnings recover from depressed levels, valuations are compressed by widespread pessimism, and central banks keep policy accommodative. Historically this phase has been the most profitable — and the hardest to catch psychologically, because media coverage is still dominated by bad news. Cyclicals and small caps outperform. The classic mistake: waiting for confirmation of the macro trough to re-enter — by then markets have often already risen 20–30% (S&P historical data across the last five recessions).
Expansion phase (mid-cycle): earnings grow steadily and multiples normalize; growth becomes entrenched. Returns remain positive but less spectacular. The market tends to extrapolate recent trends without fully pricing gradual margin erosion and slow tightening of financial conditions. The gap between markets and the economy narrows — this is where the “reflection” frame works best, which paradoxically reinforces the framing error.
Overheating phase (late cycle): inflationary pressures emerge, central banks tighten, and valuations reach highs. The market becomes vulnerable to any revision of expectations. The prolonged outperformance of U.S. equities illustrates concentration risks that build at the end of cycles — amplified by passive flows (index ETFs) that mechanically channel capital to the largest weights. The classic mistake: underestimating the duration of required monetary tightening and mistaking market resilience for risk neutralization.
Contraction phase (recession): earnings fall, multiples compress, and risk aversion dominates. Defensive stocks tend to hold up better than cyclicals. But this is also when the anticipation mechanism is most powerful: markets begin to price the future recovery long before data stabilize. The recurring trap: the recession narrative is strongest right when markets prepare their turnaround. The analysis of the bad-news paradox and its equity impact clarifies the conditions in which that reversal happens.
Leading signals: what predicts market turning points
If markets anticipate the economy, are there indicators that anticipate markets? The answer is nuanced: no single signal is reliable, but the convergence of multiple signals has historically offered significant predictive value.
The yield curve is the most documented leading signal. The 2Y–10Y inversion preceded each of the last seven U.S. recessions (FRED, NBER data). The causal mechanism — NIM compression → credit contraction → slowdown — is detailed in the dedicated analysis of the inverted yield curve and its implications. The inversion observed in mid-2022 preceded the 2023–24 slowdown by about 18 months — consistent with historical lags of 6–24 months.
Analyst earnings revisions are a powerful complementary signal. A Fed St. Louis working paper (Gavin & Kliesen, 2002) shows that momentum in earnings revisions (ratio of upward vs. downward revisions) leads market turning points by 2–4 months on average. The CAPE Shiller, OECD composite leading indicators (CLI), and PMI surveys provide supporting signals whose convergence raises the probability of a reversal. Relative sector performance (defensive vs. cyclical), tracked by MSCI data, is also informative: when defensives start to outperform cyclicals, it often signals a shift in expectations toward a late-cycle scenario. The Eco3min macro diagnostic framework helps cross these signals to identify the cycle phase.
Implications for reading the current cycle
If the anticipation framework is valid, it changes how we interpret several ongoing dynamics.
On valuations. The S&P 500 and major global indices remain at elevated levels despite mixed macro indicators. Under the anticipation framework, this means markets are pricing a soft-landing scenario followed by a recovery — a bet whose validation depends on actual earnings and financial-conditions trajectories over the next 6–12 months. A CAPE Shiller above 33 at end-2025 (Robert Shiller, Yale) signals valuations historically associated with compressed future returns — a risk that grows if an expected policy pivot is slower than priced. Analysis of the architecture of financial markets and the central-banks / equities relationship illuminates channels through which revaluation could occur.
On the market/economy divergence. The current divergence — indices near highs while industrial activity is weak (Eurozone PMI 48–49 end-2025, ISM Manufacturing around 50) — is consistent with an anticipation mechanism: markets look past current weakness and price a recovery. The risk is not the divergence per se — which is normal — but that expectations are overly optimistic. The gap between earnings expectations embedded in prices and the actual earnings trajectory is the key variable to monitor.
On asset allocation. The anticipation mechanism implies that timing entry and exit from equities is structurally offset from the economic cycle. Waiting for recession confirmation to reduce equity exposure is invariably too late (markets have already corrected); waiting for confirmation of a recovery to re-enter is also too late (markets have already rebounded). This does not make market timing impossible — it means the relevant indicators are not published macro prints (GDP, employment) but leading signals (yield curve, earnings revisions, positioning, risk premia) that capture expectations before they are reflected in prices.
Invalidation condition. The framework loses relevance under two configurations. A sudden, regime-breaking monetary shock — comparable to Volcker in 1979 — could break the anticipation mechanism by creating a discontinuity that progressive discount models cannot absorb. A major technological disruption massively redistributing sectoral profits (an accelerated AI scenario) could also change expectation structures and render historical cyclical patterns less applicable. The current consensus prices a soft landing — any significant deviation (deeper recession or reaccelerating inflation) would force rapid expectation repricing and amplify the timing gap.
Three horizons to read the markets/economy gap
Short horizon (0–6 months): markets price a gradual policy pivot and earnings resilience. Key signals to watch: earnings-revision momentum (up/down ratio), equity risk premium, implied volatility (VIX), and relative defensive/cyclical performance. Short-term risk: disappointing corporate results or a delayed pivot that forces a recalibration of expectations.
Cycle horizon (1–3 years): the structural question is valuation sustainability in an environment of positive real yields. If the 10-year real rate remains around 2%, historical multiples point to a CAPE Shiller range closer to 20–25 than the current >33 — implying either a significant acceleration in earnings growth or a progressive repricing. Interaction with the real economic cycle and the dynamics of potential growth will determine earnings trajectories over this horizon.
Structural horizon (5+ years): the current cycle raises the question of a regime shift for equity markets. The 2010–2020 decade, marked by negative real rates and the TINA (“There Is No Alternative”) mantra, produced exceptional multiple expansion. If a higher-rate regime persists — a hypothesis supported by the BIS analysis of a long-term rate supercycle (Borio, 2023) — future equity returns will be structurally lower than the past decade, and the anticipation mechanism will operate in an environment where competition between asset classes (equities vs. positively yielding bonds) is more intense than at any time since 2007.
Equity markets do not reflect today’s economy — they bet on tomorrow’s, with a structural 4–8 month lead. This lead is not a malfunction: it is the central price-formation mechanism based on continuous discounting of future flows. The divergence between indices and macro is normal. The relevant market read is not a comparison of prices to published data but an assessment of the gap between expectations embedded in prices and the most likely path for earnings, rates and financial conditions. That gap concentrates most of the risk and opportunity.
Robust: The anticipation mechanism is a core principle of financial theory (Fama, 1970) and is empirically supported across decades (BIS, Claessens et al., 2012). The 4–8 month timing gap between market and economic inflection points is documented across the last five cycles. The weak correlation between GDP growth and equity returns is established across markets and horizons. Index concentration and profit globalization are observable structural facts.
Uncertain: The exact length and magnitude of the gap in any given cycle are inherently unpredictable — they depend on how quickly expectations are revised and on the size of macro surprises. Markets can systematically err (bubbles, prolonged under- or overvaluation). The effect of index concentration (and passive flows) on the quality of the anticipation signal is debated. Calibrating valuations compatible with a new-rate regime remains open.
Regular monitoring via the weekly macro check allows confronting this framework with the freshest data on valuations, earnings revisions and financial conditions. Reading markets through their anticipation mechanism — rather than by direct comparison to published macro data — offers a more robust way to understand divergences and identify potential turning points.
- Equity markets do not reflect today’s economy — they bet on tomorrow’s. A structural 4–8 month lead between market and real-economy inflection points is the norm, not the exception.
- The central mechanism is discounting future flows: prices move not because of the published data but because of the gap between that data and prior expectations. “Bad news” that lifts stocks is not a paradox — it is the anticipation mechanism at work.
- Correlation between GDP growth and equity returns is weak: only surprises relative to expectations create outperformance.
- Structural divergence is amplified by index concentration (top-10 = ~35% of the S&P 500) and profit globalization (40%+ of revenues abroad).
- This framework is invalidated if a regime shock (monetary or technological) produces a discontinuity that progressive discounting cannot absorb.
Mis à jour : 31 March 2026
This article provides economic and financial analysis for informational purposes only. It does not constitute investment advice or a personalized recommendation. Any investment decision remains the sole responsibility of the reader.