
Where U.S. electricity demand grew, and where household bills rose
TL;DR
Between January-May 2020 and January-May 2026, the average residential electricity price in the United States rose 39.6% in current dollars. Consumer prices rose 28.1% over the same window, so the increase in real terms is 8.9%. Across the 51 states and D.C. the median state is at 3.5% in real terms, 35 states are above inflation and 16 are below it. The states where commercial electricity sales grew fastest are, on the whole, not the states where household prices rose fastest: the two changes are weakly negatively related, with a correlation of -0.25.
Residential electricity has become one of the most discussed components of the American cost of living. The framing that circulates most widely pairs two facts: electricity bills are rising, and the buildout of large computing facilities is adding load to the grid. This page does not test whether that connection exists. It documents what the state-level record actually shows over the six years to May 2026, using a single primary source for demand and price and a single deflator for inflation. Demand and price are the two variables through which the physical constraints that energy places on the economy reach a household.
Two results stand out and they point in different directions. The first is that the widely quoted increase in electricity prices is largely, though not entirely, the general increase in prices. The second is that the geography of demand growth and the geography of price increases do not match.
The headline number is mostly inflation
The figure most often cited for American electricity prices is a rise of roughly 40% over five to six years. That figure is correct in current dollars. Aggregating residential revenue and residential sales across all 51 juridictions, the average price paid by households went from 12.98 cents per kilowatt-hour in the first five months of 2020 to 18.11 cents in the first five months of 2026, an increase of 39.6%.
Over the same window the Consumer Price Index for All Urban Consumers rose 28.1%. Expressed in constant 2026 cents, the residential price went from 16.63 to 18.11, an increase of 8.9%. The difference between 39.6% and 8.9% is not a matter of interpretation. It is the difference between measuring a price against itself and measuring it against everything else households buy.
The BLS publishes its own electricity price index, built from a survey of urban consumers rather than from utility revenue. Over the same window it rose 41.9% in current dollars and 10.7% after deflation. The two methods are constructed differently and do not have to agree, and the fact that they land within two percentage points of each other in real terms is a check on the calculation rather than a coincidence. The distinction matters for how the number is read. An 8.9% real increase over six years is a real increase: households are giving up more of their purchasing power for the same kilowatt-hour than they were in 2020. It is also an increase of a different order from the one implied by the 40% figure. For comparison, over the same January-May 2020 to January-May 2026 window and after the same deflation, the shelter component of the CPI rose 2.2% in real terms and food at home rose 0.7%. Electricity has risen faster in real terms than either.
The national average conceals a wide spread
The national figure is an average of 51 very different trajectories. In real terms the median state is at 3.5%. The distribution around that median is wide enough that the median is a poor description of any individual state.
At one end, the District of Columbia records a real increase of 51.4%, with the nominal price going from 12.66 to 24.57 cents per kilowatt-hour. Maine follows at 37.8%, New York at 29.4%, California at 27.6% and Maryland at 23.7%. At the other end, 16 juridictions saw the real price fall, meaning the nominal price rose more slowly than the general price level. Iowa is the lowest at -13.0%, followed by Kansas at -9.1%, Nevada at -7.0%, Alaska at -6.3% and New Mexico at -5.8%.
The gap between the highest and the lowest is 64.4 percentage points. Two households in the same country, buying the same commodity from a regulated or restructured utility, have seen their real cost per kilowatt-hour move in opposite directions over the same six years. Dispersion of that size is a reminder that electricity, unlike the commodities that commodity regimes, from physical constraints to the energy transition are built around, reaches households through a local grid rather than a world market.
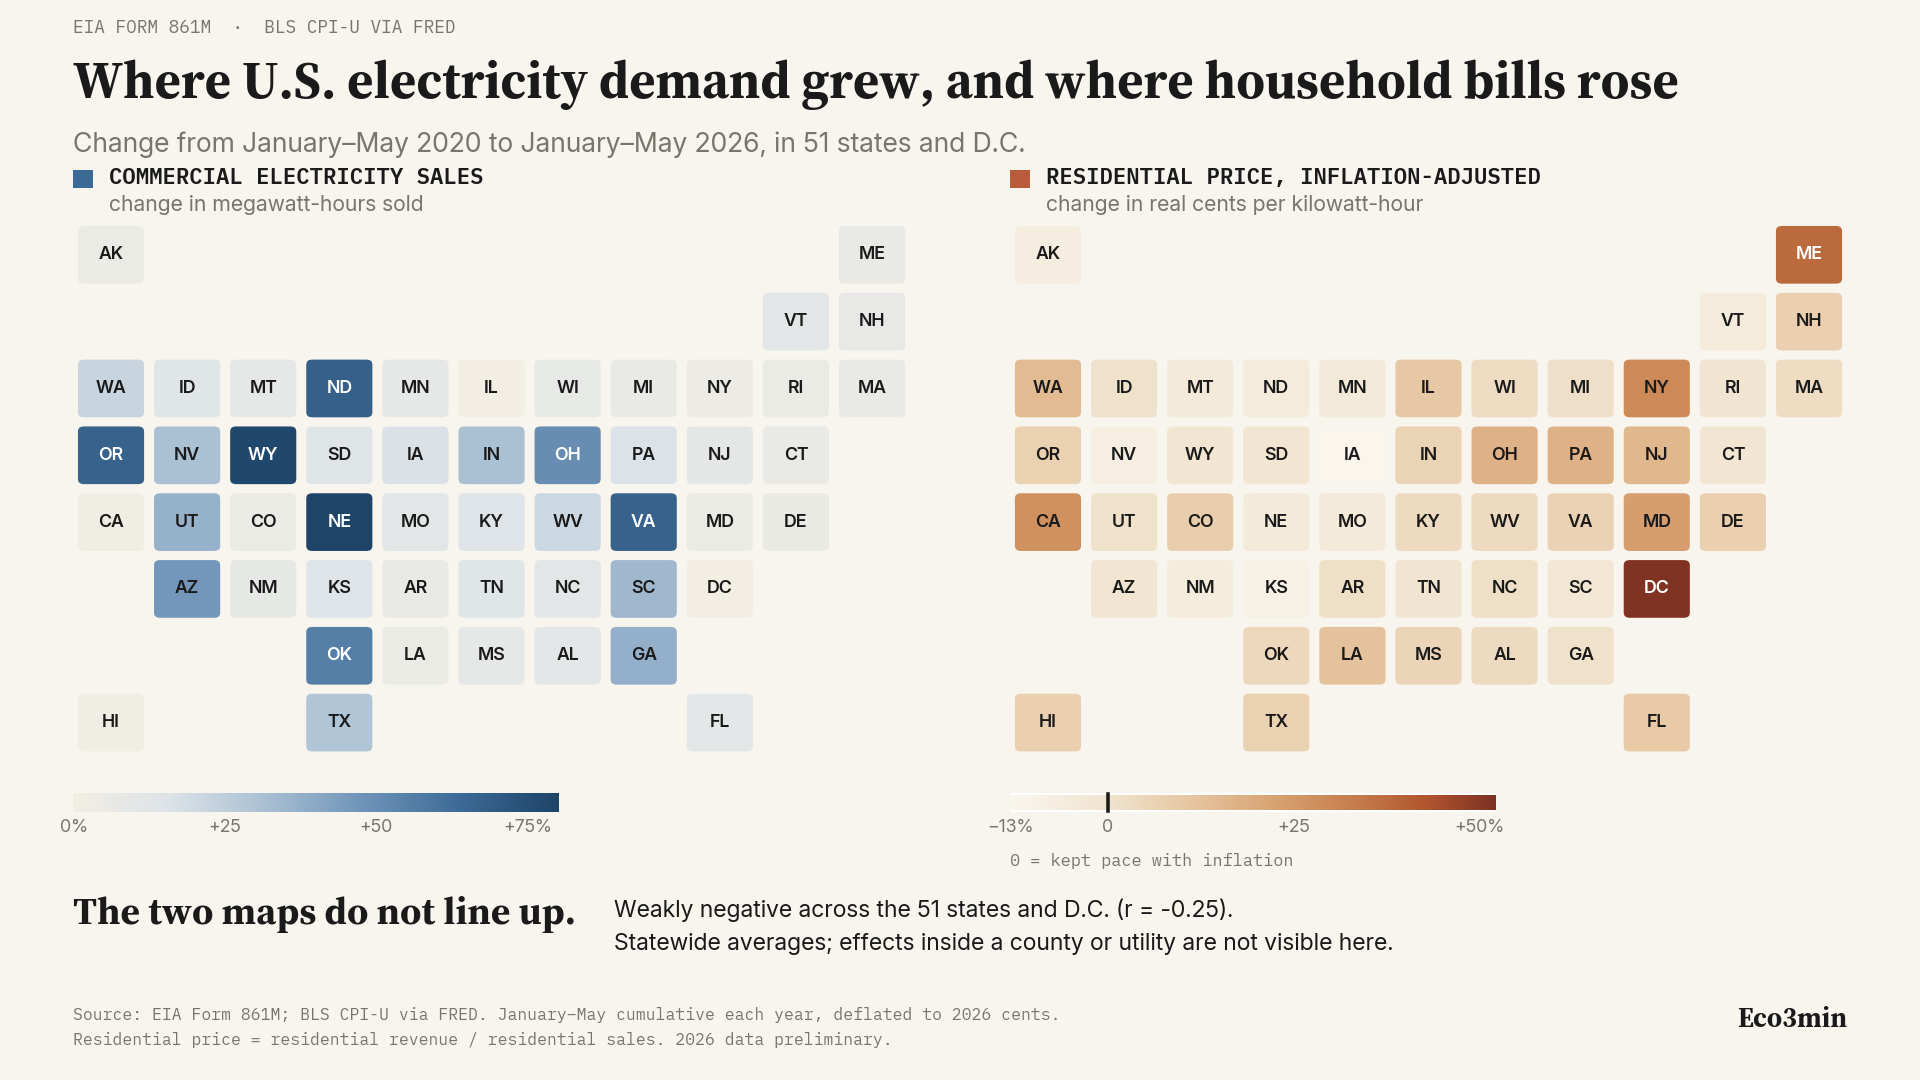
Where demand grew is not where prices rose
Commercial electricity sales are the closest series in the EIA monthly filing to the growth of large non-residential load. They are an imperfect proxy: the EIA defines the commercial sector as the service-providing facilities of businesses, of federal, state and local government, and of other private and public organisations, and does not break the category down further in this dataset. With that limitation stated, the comparison is informative because the two series come from the same filing, for the same states, over the same months.
Nebraska records the largest increase in commercial sales, at 91.2%. Wyoming follows at 78.4%, North Dakota at 68.0%, Virginia at 67.3% and Oregon at 67.2%. In real terms the residential price in those five states moved by -4.1%, -0.7%, -4.7%, 6.8% and 7.2% respectively. All five are at or below the national real increase of 8.9%, and three of them are below zero.
The pattern at the other end of the demand distribution is the mirror image. The District of Columbia records the smallest change in commercial sales, at -0.5%, and the largest real price increase at 51.4%. Illinois is at 0.5% and 10.6%, Hawaii at 1.4% and 7.8%, California at 1.5% and 27.6%.
Grouping the states makes the relationship easier to state. Taking the ten states with the fastest growth in commercial sales, their average real residential price increase is 2.9%. Taking the ten with the slowest growth, the average is 16.5%. Across all 51 observations the correlation coefficient between the two changes is -0.25.
What a correlation of -0.25 is, and is not
A coefficient of -0.25 across 51 observations describes a weak, negative, linear association. It means that knowing how fast commercial sales grew in a state tells you very little about how its residential price moved, and that the little it does tell you points the opposite way from the common framing. It does not establish that commercial load growth reduces residential prices, and it does not rule out an effect operating at a smaller geographic scale than the state.
Two readings of the same data
The figures above support more than one interpretation, and the choice between them does not follow from the data alone.
One reading holds that the absence of a positive state-level association is evidence against the proposition that large new industrial loads are what drives household bills. On this view, the states absorbing the fastest load growth are largely states with abundant generation, low population density and regulated cost-of-service utilities, and they have absorbed that growth without passing an unusual increase to households. The rises concentrated in the Northeast, the mid-Atlantic and California would then be attributed to factors that pre-date the current buildout: transmission and distribution investment, storm hardening, wildfire liability, state policy costs and the capacity market structures specific to those regions.
The other reading holds that a state average is the wrong unit of observation. Load growth concentrated in a handful of counties can raise costs for the ratepayers in those counties, and for the customers of the specific utility serving them, without moving a statewide figure that pools them with millions of other customers. On this view the state-level correlation is uninformative about the mechanism in question, and the relevant test would be conducted at the utility or county level, on rate cases and interconnection costs rather than on average revenue per kilowatt-hour.
Both readings are consistent with the figures on this page. The dataset published below permits the first to be checked and does not permit the second to be tested, because the EIA monthly filing does not disaggregate below the state.
What this page does not establish
Five limitations bear on how far the figures can be taken.
The unit of observation is the state. An association measured across state averages says nothing about associations inside a state. Northern Virginia and the rest of Virginia are one observation here. This is the ecological inference problem, and it is the single most important constraint on the comparison.
Commercial sales are a proxy, not a measurement. The EIA monthly series reports three sectors: residential, commercial and industrial. Data centres appear in the commercial category alongside every other non-industrial business customer, and in some states large facilities are classified as industrial. A state with fast commercial growth has not necessarily built data centres, and a state that has built them may record the load elsewhere.
Part of the growth in commercial sales is reclassification, not new load. The EIA states in the Electric Power Annual that from 2023 onward, many of the changes in commercial and industrial retail sales result from improved reporting practices for data centres and cryptocurrency operations. Utilities may classify a customer as commercial or industrial on the basis of NAICS code or of demand thresholds, and a facility moved from one category to the other appears as growth in one and contraction in the other. Some of the increases recorded here are therefore a change in accounting rather than a change in consumption, and the effect cannot be separated in this dataset.
Price per kilowatt-hour is not a bill. The figures here are average revenue divided by average sales, which is a unit price. A household bill is that price multiplied by consumption, and consumption has changed over the period for reasons ranging from weather to appliance efficiency to remote work. A state can show a falling real price and rising bills.
The 2026 data are preliminary. The EIA marks the current year as preliminary until the annual revision, so the January-May 2026 figures may change.
Methodology
Source. U.S. Energy Information Administration, Form EIA-861M, retail sales and revenue by state and sector, monthly. Sheet “Monthly-States”. Inflation from the Bureau of Labor Statistics Consumer Price Index for All Urban Consumers, series CPIAUCSL, retrieved through FRED.
Period. January to May of each year, cumulated. Comparing the same five months across years removes the seasonality of both electricity consumption and price. May 2026 is the most recent month published at the time of writing.
Price construction. The residential price for a state and year is total residential revenue divided by total residential sales over the five months, converted to cents per kilowatt-hour. This is the EIA’s own definition of average price and reproduces the published monthly figures exactly. It is a revenue-weighted average across all residential customers in the state and does not distinguish between rate classes or between utilities.
Deflation. Each year’s price is multiplied by the ratio of the January-May 2026 average CPI to the January-May average CPI of that year, giving a price in constant 2026 cents. The CPI-U rose 28.13% between the two windows.
Correlation. The Pearson coefficient between the percentage change in commercial sales and the percentage change in the real residential price, across the 51 juridictions, unweighted. Weighting the observations by residential sales does not change the sign.
Coverage. The 50 states and the District of Columbia. U.S. territories are not included in the EIA state file used here.
Reproducibility. The full dataset is available below in CSV, with the nominal and real price for 2020 and 2026, the commercial sales for both years, and the three percentage changes, for every juridiction.
Frequently asked questions
Why compare January-May rather than full years?
Because 2026 is incomplete. Comparing a partial 2026 to a full 2020 would mix a period weighted toward winter and spring with a period that includes the summer cooling peak, and electricity prices differ across seasons. Cumulating the same five months in every year keeps the comparison on the same footing. The trade-off is that the figures are not the full-year averages published in the EIA annual tables.
Why is the real increase so much smaller than the number in the news?
Because most published figures are in current dollars. Both figures describe the same series. The current-dollar figure answers the question of how much more a household pays; the inflation-adjusted figure answers the question of how much more electricity costs relative to everything else. The gap between them, 39.6% against 8.9%, is the general increase in consumer prices over the same six years.
Does this mean data centres have no effect on household bills?
No. The data on this page cannot answer that question. They show that at the level of state averages, faster growth in commercial electricity sales has not coincided with faster growth in real residential prices. An effect concentrated in specific service territories would not be visible in a statewide average, and the commercial category is not a clean measure of data centre load. A test of the proposition would need utility-level or county-level data and would need to control for the many other determinants of retail rates.
Why do some states show a falling real price?
A real decline means the nominal price rose more slowly than the Consumer Price Index. In Iowa the nominal price went from 11.94 to 13.31 cents per kilowatt-hour, an increase of 11.5%, against general inflation of 28.1%. This page does not attribute that outcome to any particular cause. Generation mix, fuel costs, transmission investment and the rate cases filed over the period all differ across these states, and separating their contributions is beyond what this dataset supports.
Is Washington D.C. comparable to a state?
It is a single dense urban distribution territory rather than a mix of urban and rural service areas, which makes its average less diversified than that of any state. It is reported separately in the EIA file and is included here for completeness. Excluding it moves the correlation from -0.25 to -0.21 and does not change the direction of the result.
Download the dataset
51 juridictions. Nominal and inflation-adjusted residential price for 2020 and 2026, commercial sales for both years, and the three percentage changes.
Download CSV
Source: EIA Form 861M; BLS CPI-U via FRED. Free to use with attribution.
Conclusion
Two things are true at once in this dataset. Households are paying more for electricity in real terms than they were in 2020, by 8.9% at the national level, and the increase is very unevenly distributed, from a real decline of 13.0% in Iowa to a real increase of 51.4% in the District of Columbia. And the states that have absorbed the fastest growth in commercial electricity demand are not, on average, the states where household prices have risen fastest.
The second result is descriptive and it is bounded by the unit of observation. It documents that the simplest version of the connection between commercial load growth and household prices, the one that would show up as a positive association across states, is not present in the state-level record for 2020 to 2026. It leaves open what a finer geography would show.
Which of the two readings set out above the data supports more strongly is a question this page puts to the reader rather than settles. The dataset is published in full so that either can be examined.
The data and analysis on this page are provided for informational and educational purposes only. They do not constitute investment advice or a recommendation to take any specific action.
Last updated — 18 September 2026
Disclaimer – Financial Information: The analyses, commentary, and content published on eco3min.fr are provided for informational and educational purposes only. They do not constitute investment advice or a solicitation to buy or sell financial instruments. Past performance is not indicative of future results. All investment decisions involve risk and are the sole responsibility of the reader.