
Macro Watch — Topical Research from Eco3min
Macro Watch
Topical macro-financial research from Eco3min. Each study takes a current market or policy event and places it in its longer historical context — sourced from primary data, written for analysts and journalists. One new study per week.
All studies linked here remain freely available, with downloadable datasets and reproducible methodology. For evergreen frameworks (yield curve, real rates, inflation, liquidity), see the main data hub. For a monthly reading of the current macro regime, see the Eco3min macro barometer.
Latest studies
Most recent first. Each study covers a single topic in depth: data, structural framework, counter-arguments, and downloadable dataset.
12 studies · Updated every Tuesday
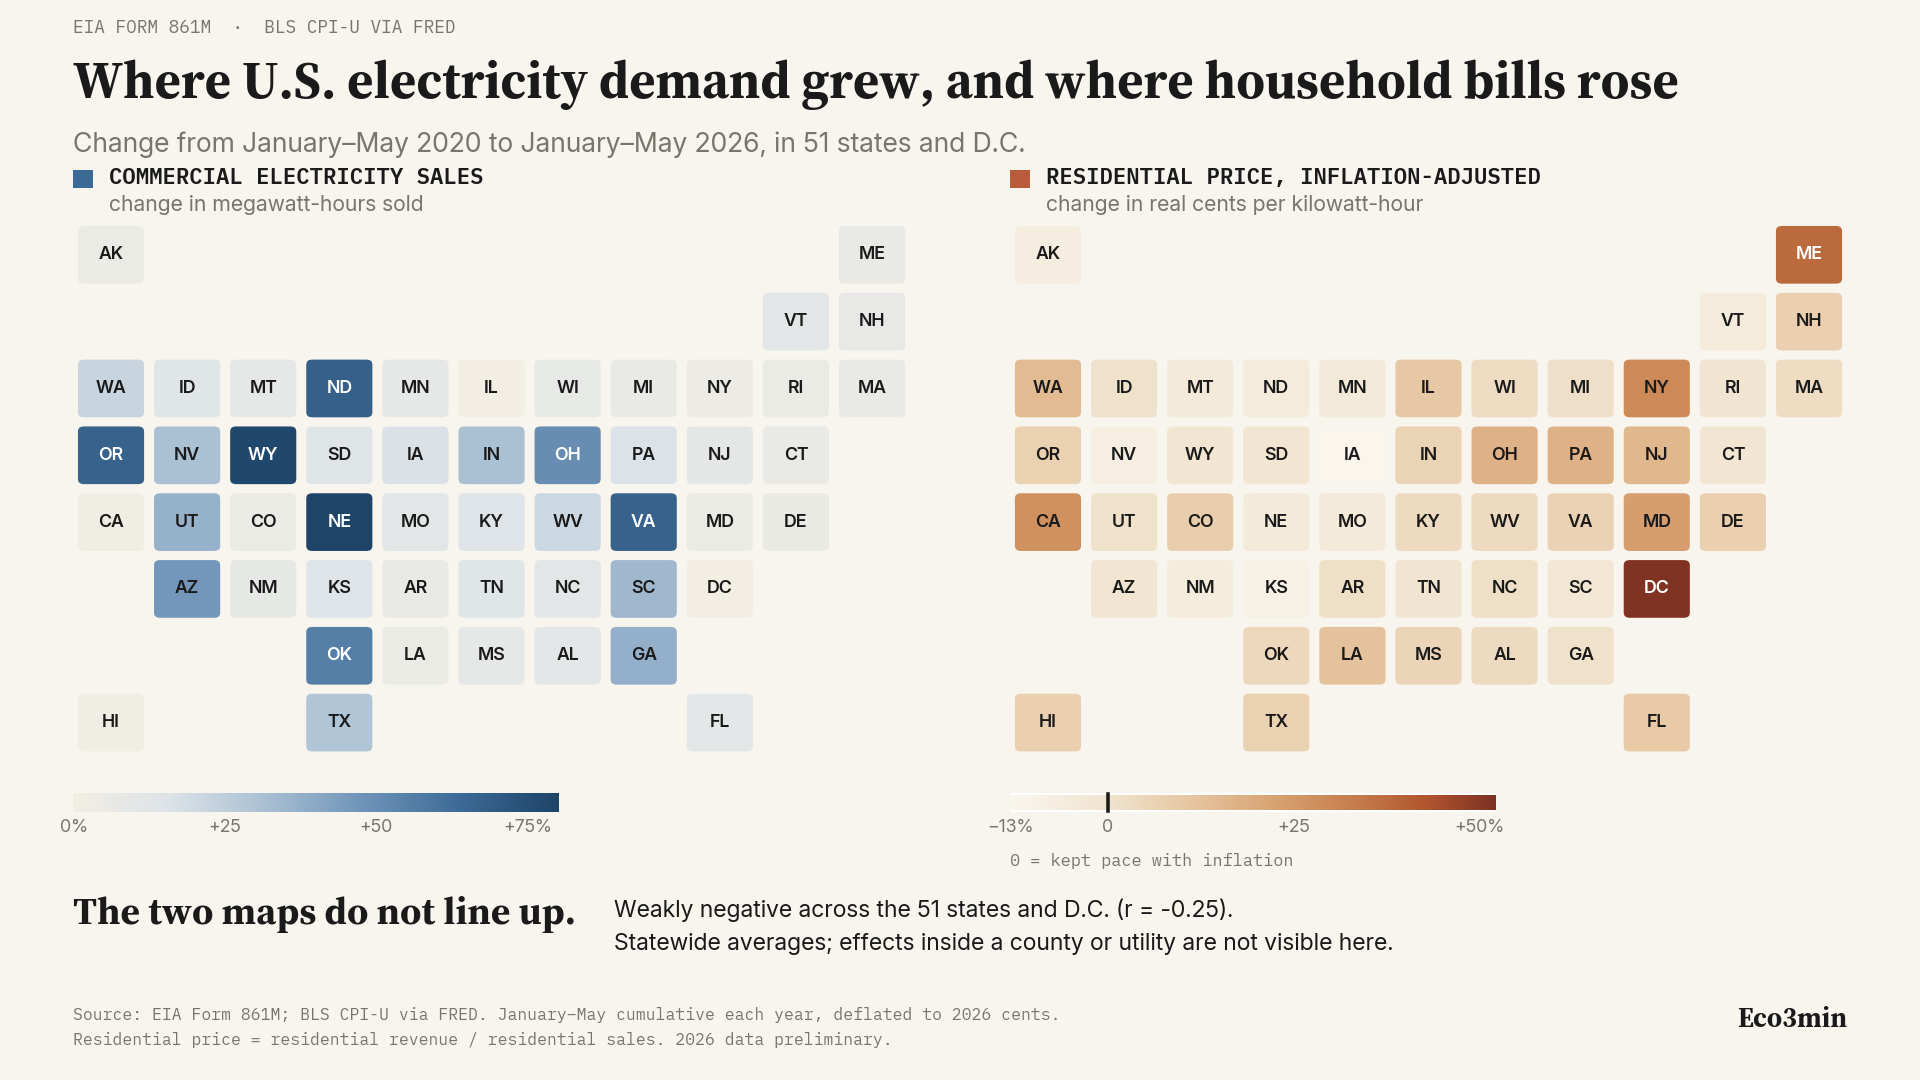
CHART OF THE WEEK · 28 JULY 2026
Where U.S. electricity demand grew, and where household bills rose
US residential electricity is up 39.6% since 2020 in current dollars and 8.9% after inflation. Across the 51 states and D.C., the places where commercial demand grew fastest are not the places where household prices rose fastest.
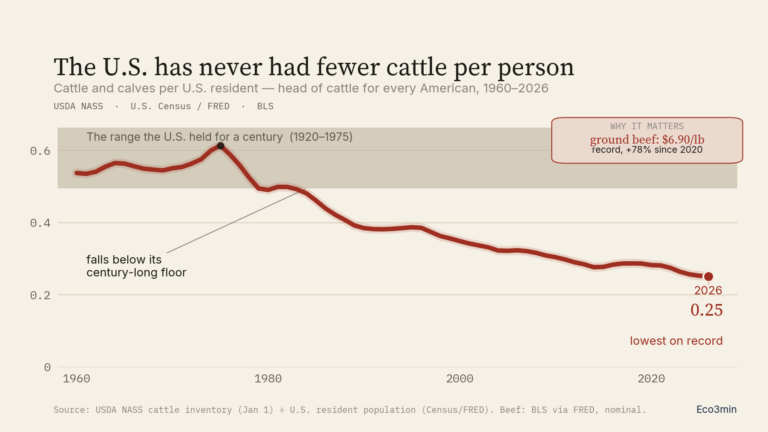
The U.S. cattle herd hits a 75-year low — the fewest cattle per person on record (1920–2026)
The U.S. cattle herd fell to 86.2 million head on January 1, 2026 — the smallest since 1951, when the country had roughly 190 million fewer people. Per resident that is about 0.25 head of cattle, one for every four Americans, the fewest on record and down from ~0.61 at the 1975 peak of 132 million. Over the same period retail ground beef reached a record $6.90/lb in nominal terms, about 78% above its January 2020 level. The study places the 2026 inventory in its long historical context, tracks it per capita, documents the parallel move in beef prices, and lays out the competing cyclical and structural readings without resolving them.
Sources: USDA NASS · U.S. Census/FRED · BLS · Free CSV download
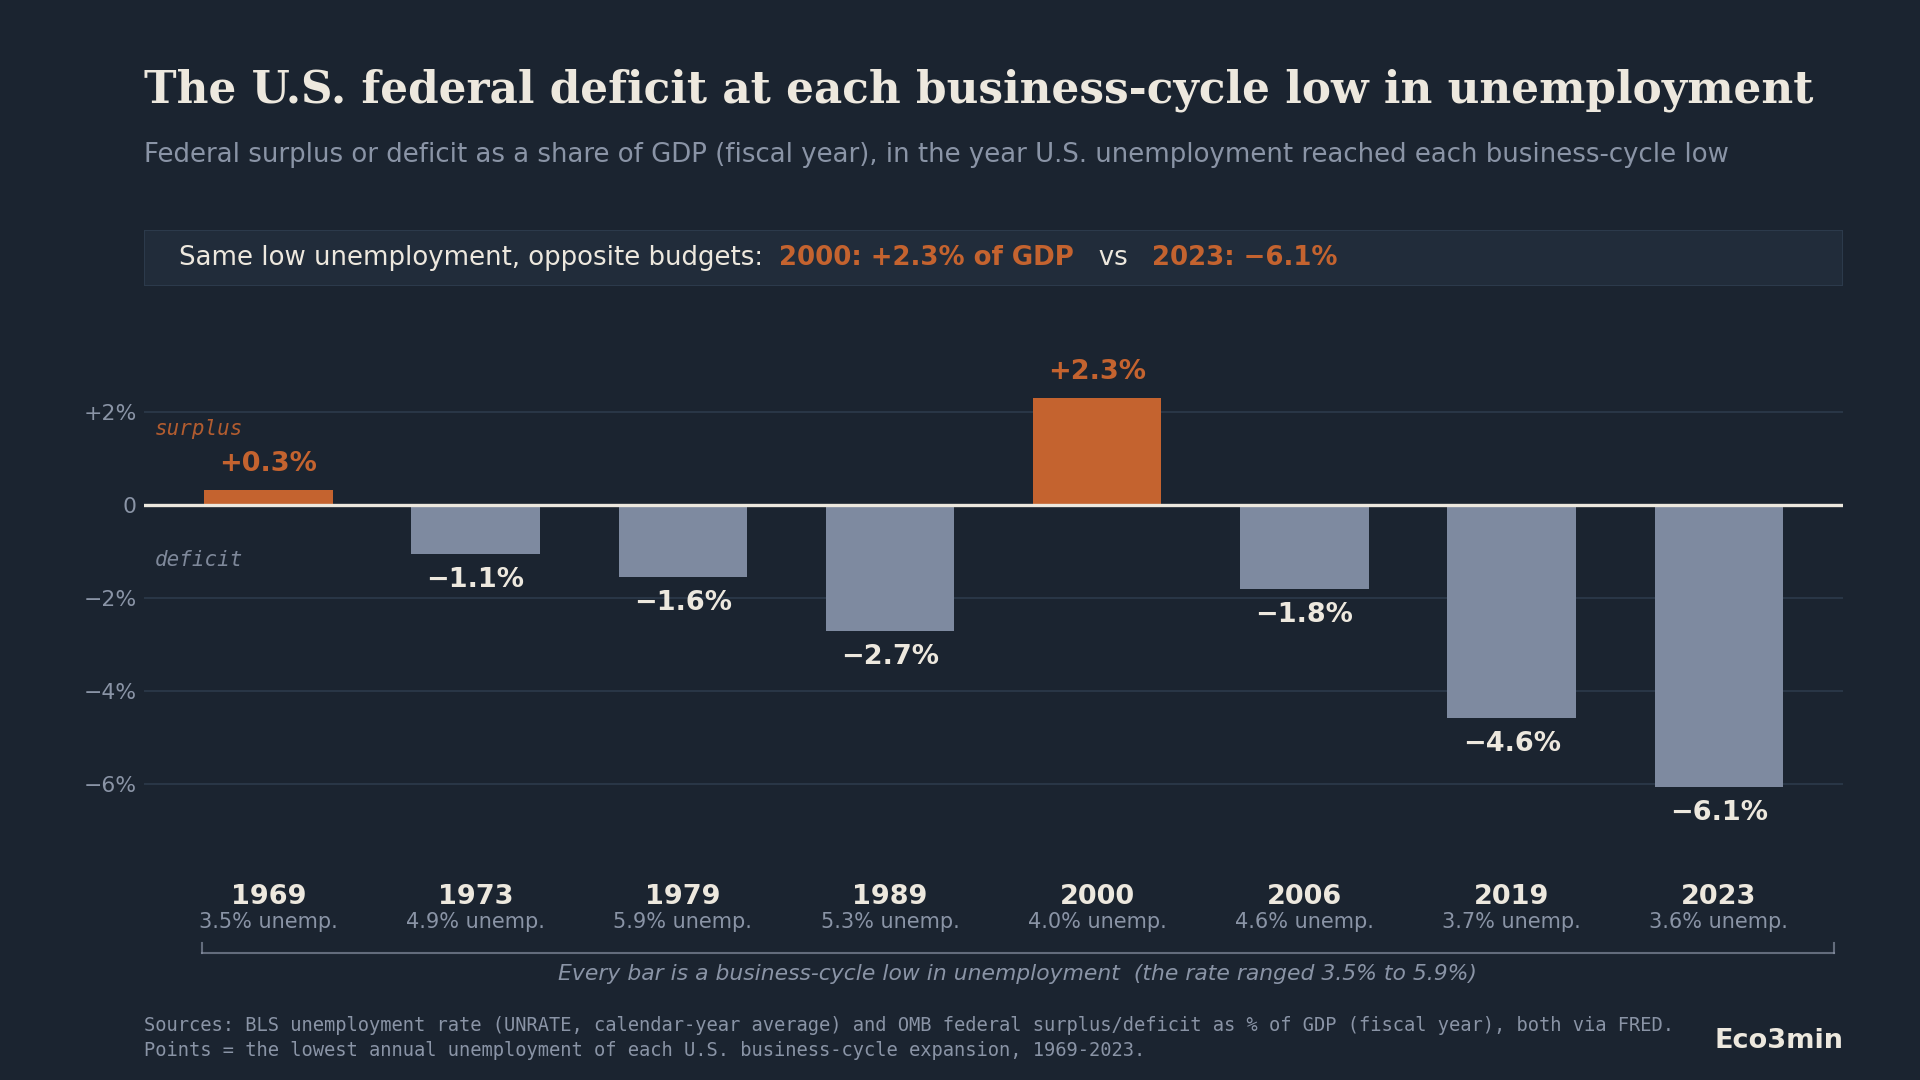
The U.S. federal deficit at each business-cycle low in unemployment
In 1969 and 2000 the U.S. ran a budget surplus at full employment; in 2023, at similar low unemployment, a deficit near 6% of GDP.
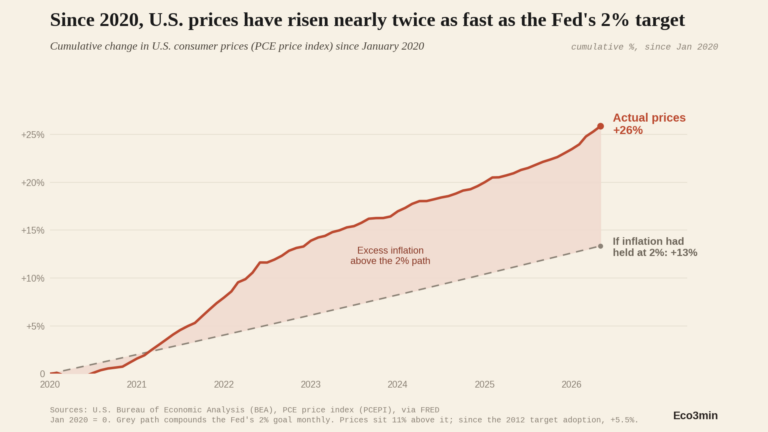
U.S. Consumer Prices vs the Fed’s 2% Target, Since 2020
Through 2024 and 2025, U.S. headline inflation cooled back toward the Fed’s 2% goal, a statement about the rate prices rise. This study separates the rate from the level. Using the PCE price index, the measure the Fed targets, it tracks the cumulative level of consumer prices against the path a steady 2% rate would have produced since January 2020. By May 2026 the level sits about 11% above that path: prices are up 25.9% versus the 13.4% a 2% path implies. The gap is not a base artifact, holding from 2012 (+5.5%), 2015 (+8.7%) and 2018 (+10.2%), and core PCE shows the same (+24.5%, 9.8% above). Headline inflation has stayed above 2% for 63 consecutive months.
Sources: BEA PCE price index (PCEPI), via FRED · Cumulative level vs a continuous 2% path · Free CSV download
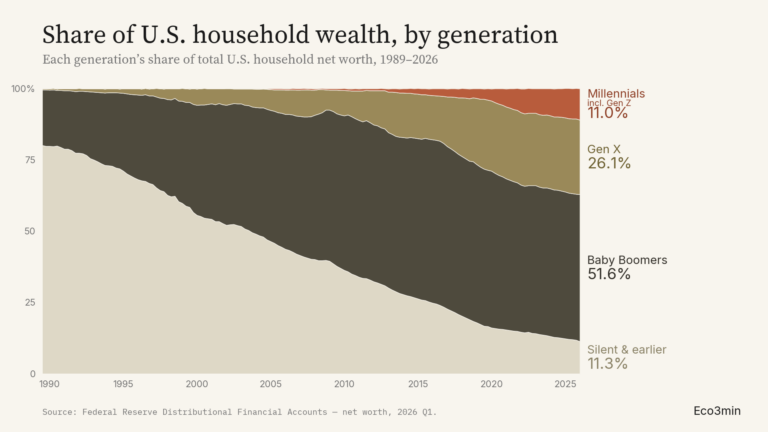
US Wealth by Generation, 1989–2026: Boomers Hold 51.6%, Under-40 Households 6.6%
Federal Reserve data shows U.S. household wealth heavily concentrated in older cohorts: Baby Boomers held 51.6% of total net worth in 2026 Q1, Gen X 26.1%, the Silent generation and earlier 11.3%, and Millennials — the Fed's open-ended category that includes Gen Z — 11.0%. Read across a fixed age band instead of by birth cohort, households under 40 held 6.6% of national wealth, down from 12.0% in 1989. The cohort figures are partly the wealth lifecycle; the age-controlled figure is not, since the bracket is held constant. Full quarterly series, the under-40 age-band view, dollar levels, two readings (lifecycle vs structural), and counter-arguments.
Sources: Federal Reserve Distributional Financial Accounts (net worth) · 147 quarterly observations 1989–2026 · Interactive chart & Free CSV download
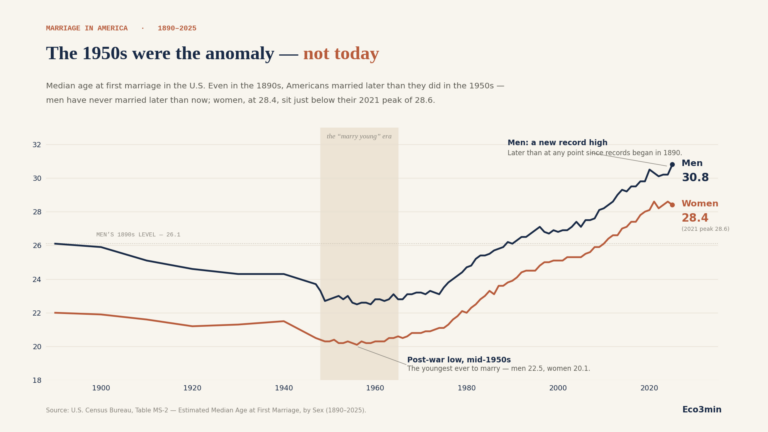
US Age at First Marriage, 1890–2025: The Mid-1950s, Not Today, Were the Low
The US median age at first marriage reached 30.8 years for men in 2025, a record in a series that begins in 1890; women stood at 28.4, just below their 2021–2024 peak of 28.6. The striking feature of the record is its U-shape: ages were higher in the 1890s (men 26.1, women 22.0), fell to an all-time low in the mid-1950s (men 22.5, women 20.1), and have climbed since. The post-war “marry young” decade, not the present, is the historical exception — Americans even married later in the 1890s than in the 1950s. The men–women gap narrowed from 4.1 years in 1890 to 2.4 in 2025. A similar shift appears in the mean age at first birth (21.4 in 1970 to 27.5 in 2023). Full series, two readings (economic vs cultural), and counter-arguments.
Sources: U.S. Census Bureau, Table MS-2 (median age at first marriage, by sex) · 85 observations 1890–2025 (decennial to 1940, annual from 1947) · CDC/NCHS (mean age at first birth) · Free CSV download
🇫🇷 Version française disponible →
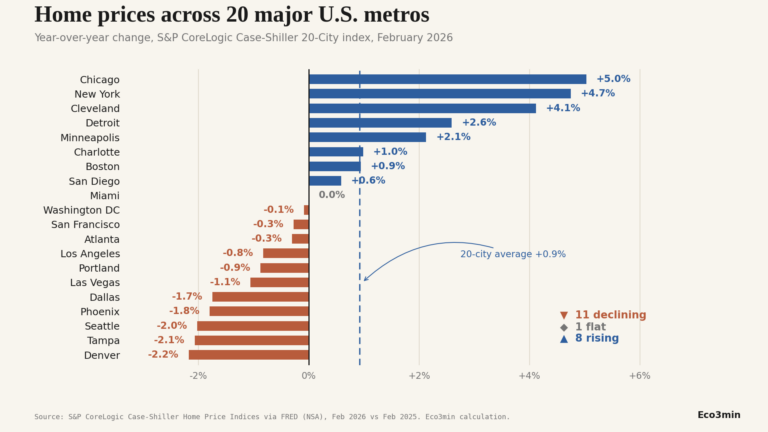
US Metro Home Prices: 11 of 20 Largest Cities Now Cheaper Than a Year Ago
Data from the S&P CoreLogic Case-Shiller index through February 2026 reveals a divergent landscape in the 20 largest U.S. metropolitan areas. While the composite 20-city average sits at +0.92% year-over-year, 11 individual metros are now cheaper than a year ago, led by Denver (−2.18%) and Tampa (−2.07%). Conversely, Midwest and Northeast metros like Chicago (+5.03%) and New York (+4.75%) continue to appreciate. Despite the recent 1-year divergence, the 5-year cumulative view shows every tracked metro remains substantially above its 2021 levels, with cumulative gains ranging from 19.4% (San Francisco) to 59.8% (Miami).
Sources: S&P CoreLogic Case-Shiller Home Price Index via FRED (NSA) · 20 metros · Interactive chart & Free CSV download
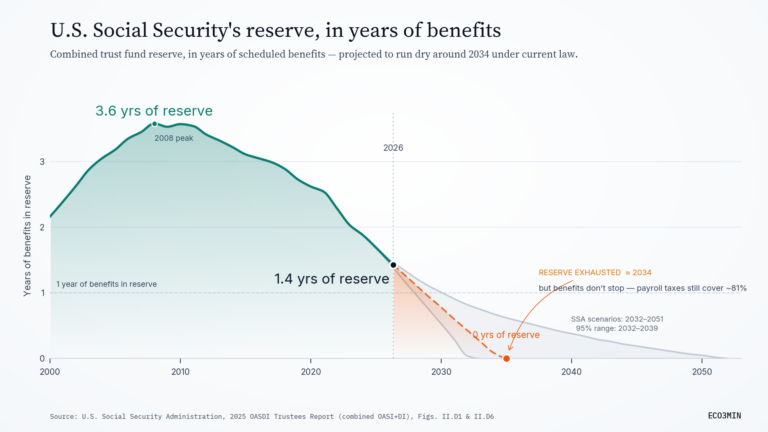
US Social Security Trust Fund, 1990–2034: Full Benefits Through 2034, Then 81%
On the 2025 Trustees Report projections, Social Security’s combined trust fund can pay full scheduled benefits through 2034. After that, continuing payroll taxes still cover 81% of benefits under current law — a 19% shortfall, not zero. The reserve, which peaked at 3.6 years of benefits in 2008, holds roughly 1.4 years as of May 2026 and is drawn down across the three official Trustees scenarios (depletion between 2032 and 2051, best estimate 2034; the stochastic model places 95% of outcomes in 2032–2039). The retirement fund alone (OASI) reaches depletion a year earlier, in 2033, at 77% payable. Full documentation of the reserve trajectory, the “reserve runs dry, benefits don’t stop” distinction, the 75-year actuarial deficit (3.82% of taxable payroll), and counter-arguments.
Sources: Social Security Administration, 2025 OASDI Trustees Report (combined OASI+DI) · Figures II.D1, II.D6 & II.D8 · Congressional Research Service · 99 data points 1990–2099 · Free CSV download
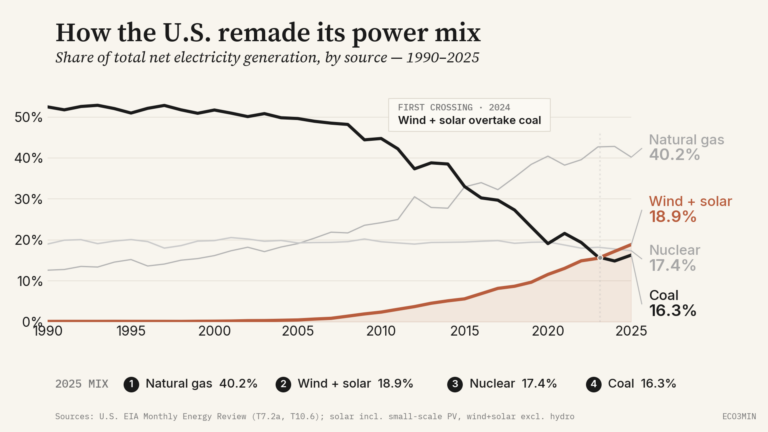
Wind and Solar vs Coal, 1990–2025: The 2024 Crossing in the US Electricity Mix
In 2024, wind and solar combined supplied 17.2% of US net electricity generation against coal’s 14.8% — the first full calendar year on record in which renewables out-generated coal. The crossing held in 2025 on preliminary data (18.9% versus 16.3%), with wind+solar also edging past nuclear into second place behind natural gas (40.2%). The milestone marks a shift in the generation mix, not in which source dominates it: over 1990–2025, natural gas absorbed far more of coal’s lost share (+28 points) than wind and solar did (+19 points), and coal’s share rose again in 2025 as gas prices firmed and total demand grew — the crossing held because renewables rose faster, not because coal kept falling. Documentation of the crossing, the full 35-year trajectory, the share-versus-volume distinction, and counter-arguments.
Sources: U.S. Energy Information Administration, Monthly Energy Review (Tables 7.2a & 10.6) · net generation shares, all sectors, 1990–2025 · small-scale solar PV included · Free CSV download

US Purchasing Power 1985 vs 2025: What One Hour of Median Work Bought
Between 1985 and 2025, US average hourly earnings rose from $8.73 to $31.34 — a 3.59× nominal multiple. Six everyday items track that wage growth in markedly different ways. A median single-family home, a year of in-state public college tuition, and a month of rent now require more hours of median work to buy. A gallon of gas, a Big Mac, and a mid-range new family TV require fewer. The Big Mac, having tracked wages almost exactly since the index was launched in 1986, sits at the structural pivot of the dichotomy. A year of public college tuition now costs the wage-time of nearly 40 mid-range TVs; in 1985, it cost the wage-time of just 3.3. Full documentation per item, with primary sources, methodology, hedonic-adjustment considerations, and counter-arguments.
Sources: BLS AHE production & nonsupervisory (FRED AHETPI) · US Census & HUD (existing-home prices, rent of primary residence) · NCES + College Board (in-state public 4-yr tuition + fees) · BLS APU000074714 (gasoline) · The Economist Big Mac Index · Statistical Abstract of the US + 2025 retail (TV) · Free CSV download
🇫🇷 Version française disponible →

US CPI Re-Acceleration Episodes Since 1948: When Disinflation Didn’t Stick
Since 1948, US headline CPI has fallen below 3% year-over-year and then re-accelerated meaningfully on four occasions: post-war / Korean War (1948–51), first oil shock (1970–74), second oil shock (1976–80), and the China-driven commodities cycle (2000–05). The 2024–2026 episode now in progress meets the same entry conditions — April 2025 trough at 2.33%, with March 2026 printing 3.29%, the highest year-over-year reading since April 2024. Heatmap alignment of all five cycles on their respective troughs, full documentation of mechanisms (war, oil shocks, commodities super-cycle, current US–Iran energy pass-through), and counter-arguments including the post-2011 fracking offset documented by the Yale Budget Lab. Each prior episode ended with a meaningful overshoot relative to its trough and, in three of four cases, a subsequent recession.
Sources: BLS CPI-U via FRED (CPIAUCSL, 267 monthly observations) · WTI crude oil (DCOILWTICO) · Yale Budget Lab · FOMC statements · Free CSV download
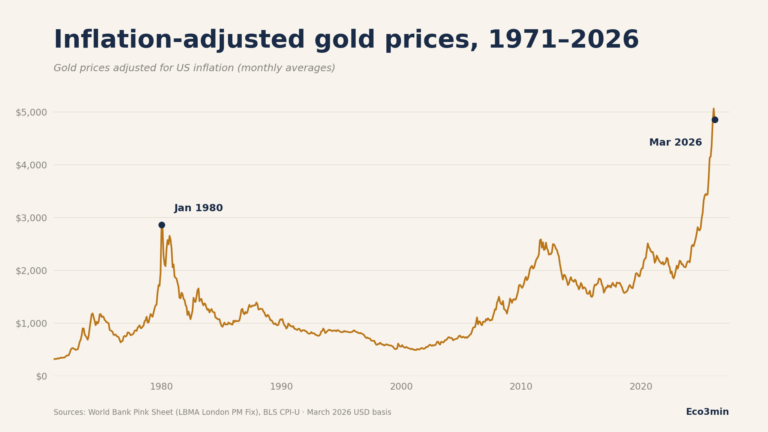
Real Gold Prices, 1971–2026: The January 1980 Monthly Peak Has Been Exceeded
The inflation-adjusted price of gold has decisively exceeded the January 1980 monthly average peak that stood as the all-time real high for forty-five years. In March 2026, the average London PM Fix gold price was $4,856 per troy ounce — approximately 70% above the 1980 monthly peak in March 2026 USD (~$2,860 real). The breach first occurred in February 2025 and has widened since, distinguishing the current episode from the 2011 and 2020 near-misses. Documentation of the breach, post-peak trajectories from prior episodes (1980, 2011), and the structural factors specific to the 2024–2026 advance — including central-bank reserve accumulation above 1,000 tonnes/year in 2022–2024.
Sources: World Bank Pink Sheet (LBMA London PM Fix monthly averages) · BLS CPI-U via FRED · World Gold Council central-bank reserve data · 663 monthly observations 1971–2026 · Free CSV download
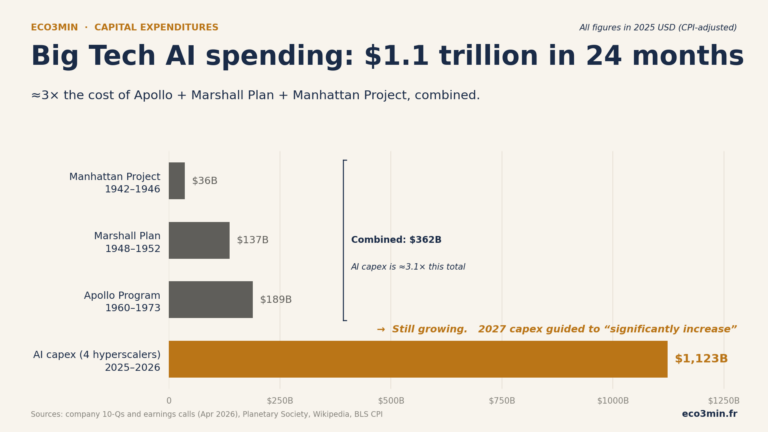
Big Tech AI Capex 2025–2026: $1.1 Trillion in 24 Months vs Apollo, Marshall, and Manhattan Combined
The four largest US tech companies will spend approximately $1.12 trillion on AI capex across calendar 2025 and 2026 — roughly 3× the combined inflation-adjusted cost of the Apollo Program, Marshall Plan, and Manhattan Project in 2025 USD. Placement against the small cluster of historic US mega-investments and post-buildout trajectory analysis using the closest private-sector analogue (1996–2000 telecom buildout).
Sources: Company 10-Qs and Q1 2026 earnings calls (Apr 29–30, 2026), Planetary Society, Wikipedia, BLS CPI
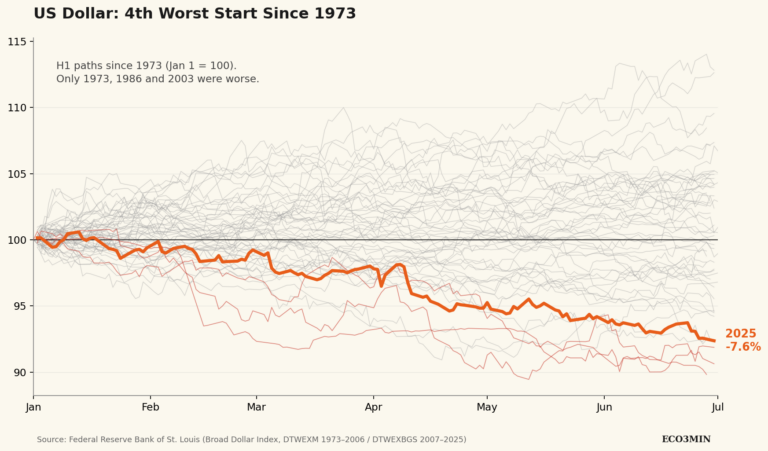
The US Dollar’s Worst First Halves (1973–2025)
H1 2025 ranked 4th worst on record for the broad US Dollar Index since the end of Bretton Woods, at −7.6%. The three deeper episodes — 1973, 1986, 2003 — each coincided with a structural shift in the international monetary or trade order. Statistical placement of H1 2025 against the full distribution of 53 first-half observations and analysis of post-H1 trajectories.
Sources: Federal Reserve Bank of St. Louis (FRED series DTWEXM, DTWEXBGS) · 53 H1 observations · Free CSV/XLSX download
Editorial standards
Each Macro Watch study follows the same standards applied to the evergreen research on the main hub:
Observatoire macro (version française) →
Frequently asked questions
How is Macro Watch different from the main research hub and the barometer?
Eco3min publishes three complementary layers. The main hub is the permanent reference layer: 79 datasets that update automatically, plus 17 evergreen studies on the foundational macro-financial frameworks (yield curve, inflation, real rates, liquidity, credit spreads). The macro barometer is the continuous framing layer: a synthetic monthly reading of the current regime. Macro Watch is the topical layer: one new study per week, anchored to a current event, with a longer historical perspective. The three layers are designed to work together — Macro Watch studies frequently cite and build on the main hub’s datasets and the barometer’s framing.
Can I republish or cite Macro Watch studies?
Yes. All studies and datasets are released under CC BY 4.0 — free to use with attribution. A suggested citation format is provided at the bottom of each study page. Direct quotes are welcome; please link back to the original study URL.
How are study topics chosen?
Each Macro Watch study is anchored to a specific current event: a quarterly earnings cycle, a half-year currency move, a major macro release, a policy shift. Topics are selected based on (1) availability of primary-source data, (2) capacity for non-trivial placement against historical context, and (3) value to the readership of analysts, journalists, and macro researchers. Topical relevance, not viral potential, drives selection.
Are the datasets behind each study downloadable?
Yes. Every Macro Watch study includes a CSV and XLSX download with the exact figures used in the analysis, source identifiers per data point, and methodology notes. The Python or R code is also published when the dataset is non-trivial to reproduce.
Are studies available in French?
Yes. Every Macro Watch study is published bilingually. The French version is accessible via the Observatoire macro hub, or via the 🇫🇷 cross-link on each card above. Both versions share the same methodology, the same data, and the same editorial standard. The English publication typically precedes the French one by 1–2 days.
Cite Macro Watch
If you reference a Macro Watch study in your research, articles, or analyses, please cite as follows:
Licensed under CC BY 4.0 — free to use with attribution. Each individual study page provides its own complete citation.
Last updated — 24 July 2026
Disclaimer – Financial Information: The analyses, commentary, and content published on eco3min.fr are provided for informational and educational purposes only. They do not constitute investment advice or a solicitation to buy or sell financial instruments. Past performance is not indicative of future results. All investment decisions involve risk and are the sole responsibility of the reader.