
How U.S. jobs data changes after revisions, January 2024 to June 2026
TL;DR
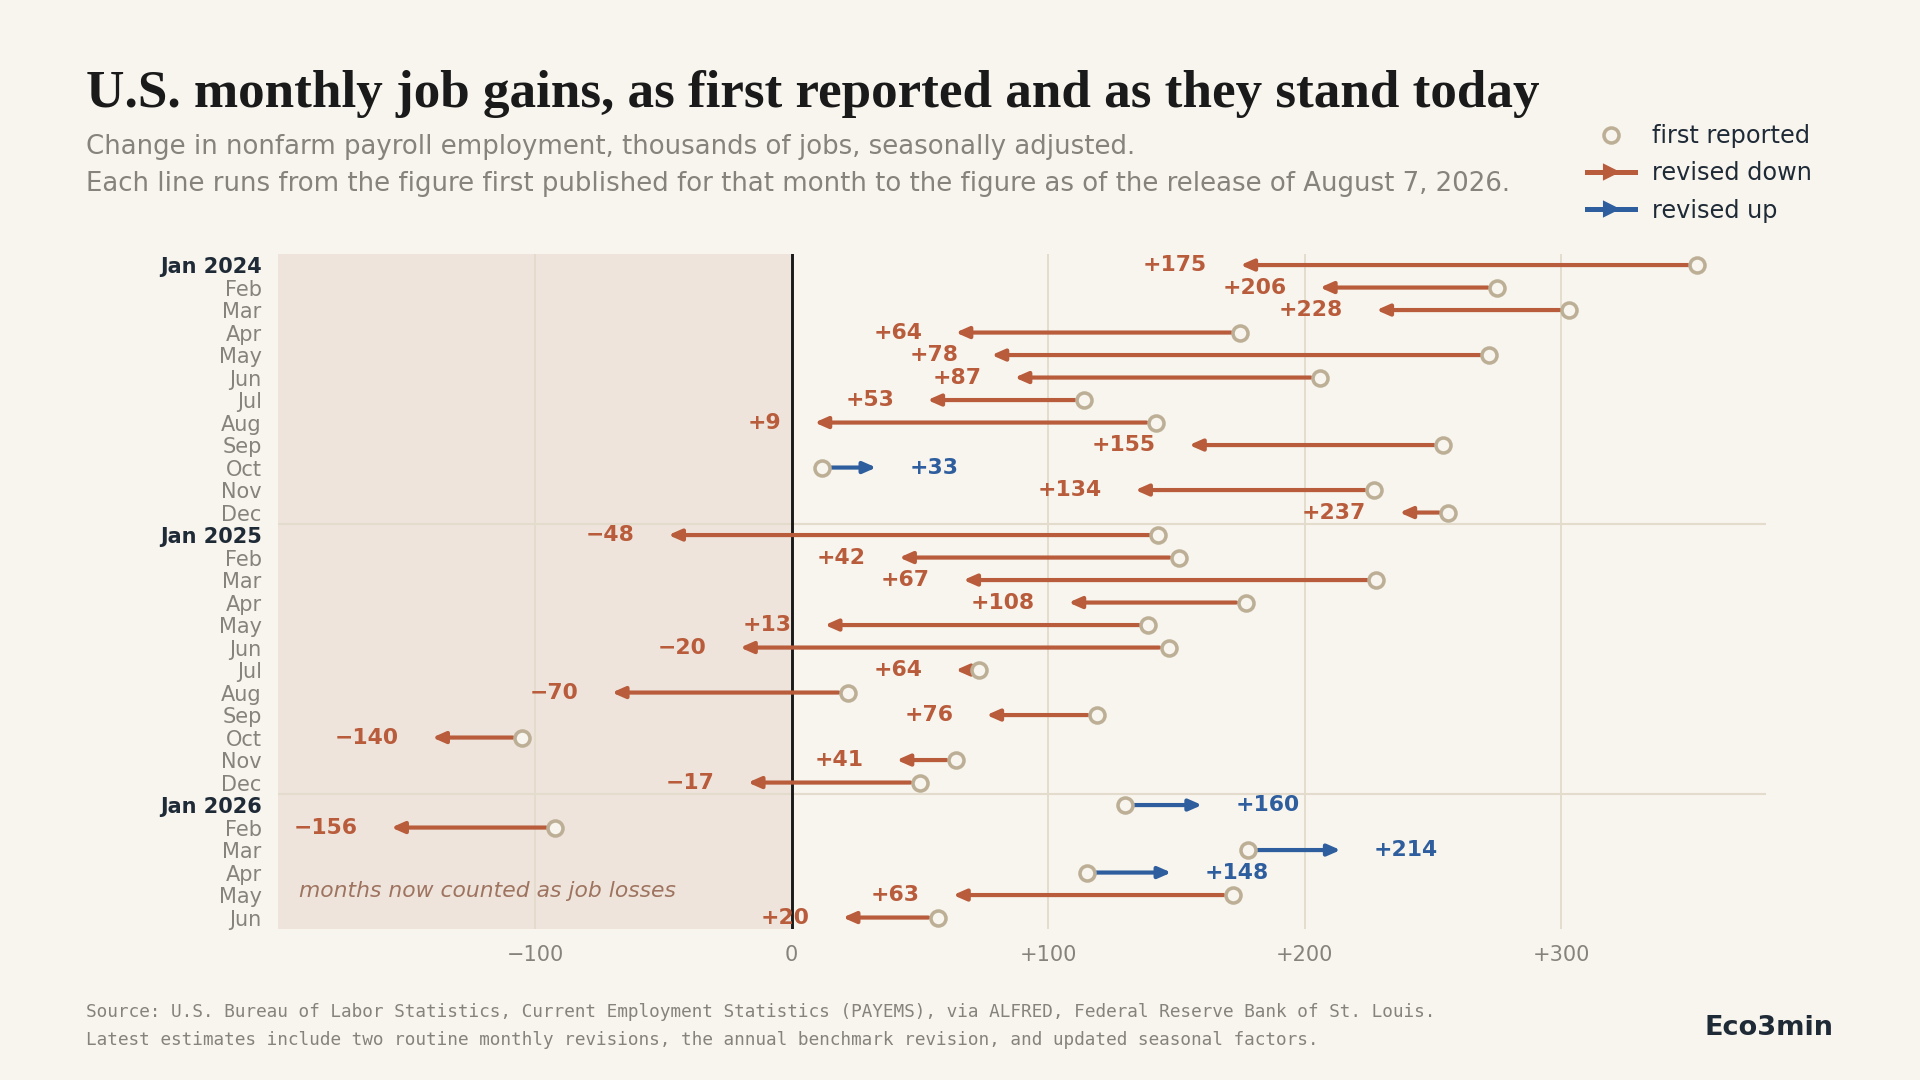
Between January 2024 and June 2026, 26 of the 30 monthly U.S. payroll figures were revised down after first publication. Taken together, those months were first reported as 4.36 million jobs added. They now stand at 2.02 million.
The concentration is in 2025. Every one of its twelve months was revised down. As first reported, 2025 added 1.21 million jobs. As the data stands today, it added 116,000.
Revisions are a designed feature of the statistic, not an anomaly. What is unusual is the direction. On a like-for-like basis, the average revision across 2015 to 2019 was slightly positive. Across 2024 and 2025 it was heavily negative.
Every month, the U.S. Bureau of Labor Statistics publishes an estimate of how many jobs the American economy added or lost. That number moves markets, frames political argument, and enters the Federal Reserve’s deliberations within minutes of its release at 8:30 a.m. Eastern Time. It is also, by design, provisional. Each month is published once, revised twice as late survey responses arrive, and then revised again the following February when the survey is reconciled against near universal employer tax records. A figure that enters the Fed’s deliberations within minutes is also one of the raw inputs of the macro-financial regimes running from the Great Moderation to the structural break.
This page tracks what happened to each of those first estimates. For every month from January 2024 to June 2026, it compares the figure the country was given on release day with the figure that stands today, after the release of August 7, 2026. The underlying dataset is available for download.
Key findings
Period covered: January 2024 to June 2026, 30 monthly observations
Months revised down: 26 of 30
Months revised up: 4 (October 2024, and January, March and April 2026)
Sum as first reported: +4,357,000 jobs
Sum as it stands today: +2,024,000 jobs
Difference: 2,333,000 jobs
2025 alone, as first reported: +1,208,000 jobs, an average of 100,700 per month
2025 alone, as it stands today: +116,000 jobs, an average of 9,700 per month
Months first reported as gains that are now losses: 4 (January, June, August and December 2025)
Largest single downward revision: May 2024, from +272,000 to +78,000
Largest single upward revision: March 2026, from +178,000 to +214,000
2026 so far: three months revised down, three revised up, net difference of 111,000
Revision is how the statistic is built
The monthly payroll figure comes from the Current Employment Statistics survey, which asks a large sample of employers how many people were on their payroll during the pay period including the twelfth of the month. To publish within three weeks of that reference period, the Bureau of Labor Statistics has to close the books before every employer has answered. The first estimate is therefore produced from a partial sample, and the establishments that report late are added in later.
That produces two scheduled revisions. The figure for a given month appears in three consecutive Employment Situation releases: as a first estimate, then a second, then a third. A firm that files three weeks after the deadline is counted in the second estimate but not the first.
A fourth adjustment follows each February. The survey is reconciled against the Quarterly Census of Employment and Wages, which is compiled from the state unemployment insurance tax records that nearly all employers are legally required to file. That census covers close to the entire universe of employment rather than a sample, so it functions as the ground truth against which the survey is corrected. The correction is called the annual benchmark revision, and it rewrites the level of employment across the preceding year.
Neither of these mechanisms is a defect. Both are published, scheduled, and documented in advance. The Bureau of Labor Statistics states in its own release notes that the absolute average benchmark revision for total nonfarm employment over the prior ten years is 0.2 percent. The next preliminary benchmark estimate is scheduled for August 28, 2026, with the final version applied in February 2027.
What the revisions did to the last thirty months
Applying that framework to January 2024 through June 2026 produces a distribution that is not symmetric. Twenty six of the thirty months moved down. Four moved up. The aggregate difference is 2.33 million jobs, which is the gap between the 4.36 million the country was told about in real time and the 2.02 million that survives in the current data.
The imbalance is concentrated in a single year. In 2025, all twelve months were revised down, without exception. January 2025 was first published as a gain of 143,000 and now stands at a loss of 48,000. June 2025 went from a gain of 147,000 to a loss of 20,000. August 2025 went from a gain of 22,000 to a loss of 70,000. December 2025 went from a gain of 50,000 to a loss of 17,000. Six months in the full window are currently recorded as net job losses. Four of them were first reported as gains.
2024 is directionally similar but less uniform: eleven of twelve months down, one up, and a cumulative difference of 1.13 million. The largest single move in the window belongs to that year, when May 2024 fell from 272,000 to 78,000.
2026 does not follow the pattern. Three of its six revised months moved down and three moved up, for a net difference of 111,000. On the evidence available as of August 2026, the one directional episode documented here is 2024 and 2025, not the current year.
Compared with a period when nothing unusual was happening
A pattern of downward revisions is only informative against a baseline. Revisions have always existed, and in any given stretch some will be negative. The question is whether the recent ones sit inside the historical distribution or outside it.
Comparing a 2024 figure to today is not directly comparable to doing the same for a 2015 figure, because the older month has absorbed several more years of benchmark corrections. To hold that constant, each month here is measured the same way: the first published estimate against the estimate fourteen months later, which is the point at which two monthly revisions and one annual benchmark have been applied and no more.
On that basis, the sixty months from 2015 to 2019 revised by an average of positive 7,900 jobs, with a median of positive 10,000. Twenty five moved down and thirty five moved up. The distribution was close to balanced with a mild upward tilt.
The twenty one months from 2024 and 2025 that have reached the same fourteen month point revised by an average of negative 78,800 jobs, with a median of negative 69,000. Nineteen moved down and two moved up.
The annual benchmark corrections tell the same story at the aggregate level, and here the Bureau of Labor Statistics publishes the figures itself. The benchmark applied in February 2025 lowered the March 2024 level by 598,000, or 0.4 percent. The benchmark applied in February 2026 lowered the March 2025 level by 861,000, or 0.5 percent. The agency states that over the prior ten years the annual benchmark revision has averaged 0.2 percent in absolute terms, within an absolute range of less than 0.05 percent to 0.4 percent. On that published table, which runs from March 2015 to March 2025, the 2025 revision is the largest of the eleven and the 2024 revision is the second largest.
Two ways to read this
The data above is descriptive. What it means is contested, and the two readings that follow are both internally consistent with it.
The first reading treats this as a measurement story. Revisions are the visible output of a survey doing its job. A one sided run of revisions is what you would expect if the model that estimates employment at establishments too new or too small to survey was calibrated on a hiring environment that then changed. In this reading, the corrections are evidence that the reconciliation against tax records works, the size of the gap reflects a turning point in the labor market rather than a failure of the statistic, and the fact that 2026 revisions run in both directions suggests the model has re-anchored.
The second reading treats this as a decision making story. Monetary policy, fiscal argument and market pricing all run on the first estimate, because the first estimate is the only one that exists when the decisions are made. If 2025 was experienced in real time as a year adding roughly 100,000 jobs a month and turns out to have added roughly 10,000, then a year of decisions was taken against a picture of the economy that no longer exists. In this reading the accuracy of the final number is beside the point, because nothing is decided on the final number.
The data on this page cannot arbitrate between them. It establishes what changed and by how much. It does not establish why, and it does not establish what should follow.
What the documented mechanisms can and cannot explain
Several factors are documented in the public record and are worth stating precisely, because they are often collapsed into each other.
Survey participation has fallen. The Congressional Research Service reports that the share of sampled employers agreeing to participate in the Current Employment Statistics survey declined from roughly 58 percent before 2020 to 43 percent in 2024, and that the proportion responding in time for the first estimate has been falling since 2015.
That decline does not mechanically explain the monthly revisions. The same Congressional Research Service analysis is explicit on this point: because monthly revisions exist precisely to incorporate data from later responders, a lower first round response rate does not by itself produce revisions in a particular direction. Its assessment is that the effect is more likely to matter for benchmark revisions than for the two monthly ones.
Government employment carried an unusually large share in at least one episode. The Congressional Research Service notes that nearly half of the outsized revisions to May and June 2025 came from government employment, largely in local and state government education.
Three months in this window were published late. The first estimates for September, October and November 2025 were delayed by the 2025 lapse in appropriations, with September appearing in November and October and November appearing together in December. Their revisions are among the smallest in the 2025 block, which is consistent with a longer collection window before first publication, though a three month sample cannot establish that.
Counter-arguments and limitations
First, the comparison mixes several kinds of revision. The difference between the first and current figure for any month here includes the two routine monthly revisions, the annual benchmark, and updated seasonal factors. These are different processes with different causes. The page reports the combined effect because that is what a reader of the original headline actually experienced, but it should not be read as a statement about any one of the three.
Second, thirty months is a short window and the recent months are incomplete. The months from mid 2025 onward have not yet passed through a full benchmark cycle. Their current values will move again, in either direction, when the benchmark is applied in February 2027. Every figure on this page is a snapshot as of August 7, 2026.
Third, the historical control is a single comparison period. The 2015 to 2019 window was chosen because it is recent, complete, and contains no pandemic distortion. A different window would produce a different baseline, and the 2020 to 2022 period in particular contains revisions far larger than anything shown here for reasons no one disputes.
Fourth, cumulating revisions across months overstates their independence. The 2.33 million figure sums thirty monthly differences, but a single benchmark revision moves many months at once. The sum is a useful measure of how much the reported picture changed. It is not thirty independent errors.
Common misinterpretations
Reading the revisions as jobs that were lost. They are jobs that were never counted correctly in the first place, not jobs that existed and then disappeared. The employment level today is what it is. The revisions changed the recorded path to it, not the destination.
Reading a downward revision as a correction of an error. A first estimate produced from an incomplete sample is not wrong in the sense that a miscalculation is wrong. It is an estimate published under a deadline, with the revision built into the schedule.
Treating 2.33 million as the size of a single mistake. The largest single monthly revision in the window is 194,000. The aggregate is the accumulation of thirty separate adjustments plus two benchmark corrections that touch many months simultaneously.
Extending the 2025 pattern to 2026. Every month of 2025 moved down. Half the revised months of 2026 moved up. Whatever produced the 2025 run is not visible in the 2026 data available so far.
Methodology and sources
Series. Total nonfarm payroll employment, seasonally adjusted, series PAYEMS, produced by the Bureau of Labor Statistics Current Employment Statistics program.
First reported value. For each reference month, the monthly change is computed from the vintage of the series as it existed after the Employment Situation release that first covered that month and before the next one. Vintages are retrieved from ALFRED, the archival real time database maintained by the Federal Reserve Bank of St. Louis. For September, October and November 2025, the vintages used are those of the delayed releases in November and December 2025.
Current value. The monthly change computed from the vintage of August 12, 2026, which incorporates the Employment Situation release of August 7, 2026.
Monthly change. Level of the reference month minus level of the preceding month, within the same vintage. Computing the change within a single vintage rather than across vintages is what makes the two figures comparable, since the benchmark revision shifts the entire level of the series.
Historical control. To compare periods at the same stage of the revision cycle, each month is measured as the first published change against the change computed from the vintage fourteen months after the reference month. Fourteen months is the point at which two monthly revisions and one annual benchmark have been applied. The 2024 to 2025 sample contains twenty one months rather than twenty four because the most recent months have not yet reached that point.
Validation. The pipeline reproduces the figures published in the Employment Situation release of August 7, 2026 exactly: July 2026 at a loss of 23,000, June 2026 revised to a gain of 20,000, and May 2026 revised to a gain of 63,000. It also reproduces, month for month, the eleven revised 2025 values published by the Bureau of Labor Statistics in its own benchmark article of February 11, 2026, from January at a loss of 48,000 through November at a gain of 41,000. December 2025 is the one 2025 month that has moved since that article, from a gain of 48,000 to a loss of 17,000.
Sources. U.S. Bureau of Labor Statistics, Employment Situation news releases and Current Employment Statistics technical documentation. Federal Reserve Bank of St. Louis, ALFRED archival database, series PAYEMS. Congressional Research Service, In Focus IF13084 on Current Employment Statistics revisions. Eco3min calculation.
Frequently asked questions
Are downward revisions unusual?
Downward revisions individually are not. A sustained run of them is. Measured at the same point in the revision cycle, the sixty months from 2015 to 2019 revised by an average of positive 7,900 jobs, split twenty five down and thirty five up. The twenty one comparable months from 2024 and 2025 revised by an average of negative 78,800, split nineteen down and two up.
Does this mean the jobs data is unreliable?
It means the first estimate is provisional, which the Bureau of Labor Statistics states explicitly and schedules for in advance. The reconciliation against unemployment insurance tax records is what produced the corrections documented here, so the same process that revealed the gap is the one that closes it. Whether a provisional number that later moves by this much remains fit for the decisions taken on release day is a separate question, and the data on this page does not answer it. It is, though, the question that reading the economic cycle from its phases and signals runs into on the first Friday of every month.
Why do you compare against fourteen months rather than against today?
Because comparing a 2015 month to today would put a decade of additional annual benchmark revisions behind it that a 2025 month has not had. Fourteen months puts every month at the same stage: two monthly revisions plus one annual benchmark. The headline chart uses the current value because that is the figure a reader would find today, and the control uses the fourteen month value because that is what makes periods comparable.
Will these numbers change again?
Yes. The Bureau of Labor Statistics is scheduled to publish the preliminary estimate of the next annual benchmark revision on August 28, 2026, alongside first quarter 2026 data from the Quarterly Census of Employment and Wages. Official estimates are not updated on the preliminary figure. The final benchmark is applied with the January 2027 Employment Situation release in February 2027, and it will move the months from 2025 and 2026 again.
What happened to September, October and November 2025?
Their first publication was delayed by the 2025 lapse in appropriations. September 2025 first appeared in November 2025, and October and November 2025 appeared together in December 2025. The dataset flags these three months, and the vintages used for them are the delayed ones rather than the usual schedule.
I have seen a source saying October 2025 was revised up. Which is right?
Both, against different baselines. In its benchmark article the Bureau of Labor Statistics compares each month with the figure published immediately before the February 2026 benchmark, and on that basis October 2025 moved up by 33,000, the only month of 2025 to do so. This page compares each month with its very first published figure instead. October 2025 was first published as a loss of 105,000, was revised to a loss of 173,000 in January 2026, then recovered to a loss of 140,000 at the benchmark. Against the first estimate it is down 35,000, like the other eleven months of the year. The choice of baseline is the whole difference, and both baselines are stated in the dataset.
Does the household survey show the same thing?
The unemployment rate comes from a separate survey of households, which is not benchmarked in the same way and is not covered here. This page is about the establishment survey only, which is the source of the monthly payroll figure.
Download the dataset
Thirty months of U.S. payroll figures as first reported and as they stand today, with the revision, the vintage date used for each first estimate, and flags for the months that crossed into job losses.
Source: U.S. Bureau of Labor Statistics via ALFRED, Federal Reserve Bank of St. Louis. Compiled by Eco3min. Free to use with attribution.
Conclusion
Across the thirty months from January 2024 to June 2026, twenty six U.S. monthly payroll figures were revised down and four were revised up. The months in that window were first reported as 4.36 million jobs added and now stand at 2.02 million. The concentration is 2025, where all twelve months moved down and the year fell from a reported 1.21 million to 116,000.
Revision is not an anomaly in this statistic. It is the mechanism by which a survey published under a three week deadline is reconciled with employer tax records that arrive months later. What distinguishes this window is the one sidedness. Measured at the same stage of the revision cycle, the 2015 to 2019 baseline revised marginally upward on average. The 2024 to 2025 months revised by an average of nearly 79,000 downward.
The open question is which reading the pattern supports. Is a run of one sided corrections evidence that the statistical system caught a turning point that a real time survey could not see, or evidence that a year of decisions was taken against a picture that has since been withdrawn? The next data point on that question arrives on August 28, 2026, when the preliminary estimate of the following benchmark revision is published.
This page is published for informational and educational purposes. It presents public statistical data and the methodology used to compile it. It does not constitute investment advice or a recommendation to take any specific action.
Last updated — 18 September 2026
Disclaimer – Financial Information: The analyses, commentary, and content published on eco3min.fr are provided for informational and educational purposes only. They do not constitute investment advice or a solicitation to buy or sell financial instruments. Past performance is not indicative of future results. All investment decisions involve risk and are the sole responsibility of the reader.