The 2008 Financial Crisis: a regime shift read through the indicators
How, in 2008, the United States shifted into a disinflationary slowdown regime: reading the crisis through the Eco3min indicators.
The 2008 crisis did not arrive without warning: the yield curve inverted as early as 2006 and housing turned down before credit seized up. The U.S. regime then shifted from the ordinary cycle into a disinflationary slowdown under extreme financial stress.
In 2008, the Eco3min classifier places the United States in a Slowdown (negative growth, neutral core inflation: G− I=), within the disinflationary meta-regime, under an overlay of acute financial stress and Dollar Shortage. Triggered by the collapse of subprime credit and then the bankruptcy of Lehman Brothers (15 September 2008), the crisis differs from 1929 in its rapid monetary and fiscal response: the lasting deflation of that era did not recur, as core inflation never moved into I−.
Timeline of the shift
Five milestones capture the move from a localized market strain to a systemic global crisis. Each step narrowed the distance between an isolated problem in subprime mortgages and a freeze of the entire short-term funding system.
- June 2007 — Two Bear Stearns funds exposed to subprime collapse: the first public warning on mortgage securitization.
- 9 August 2007 — BNP Paribas freezes three funds, unable to value their subprime-backed assets; the following week the NFCI crosses into tightening territory (17 August, FRED data).
- 16 March 2008 — Bear Stearns, short of funding, is acquired by JPMorgan with Federal Reserve support (a loan through the Maiden Lane vehicle).
- 15 September 2008 — Lehman Brothers files for bankruptcy; interbank funding and commercial paper seize up.
- October–December 2008 — The $700 billion TARP program (3 October), the first wave of quantitative easing announced on 25 November, and the policy rate cut to 0–0.25% on 16 December.
The indicators before the crisis
The value of reading a crisis through its indicators is this: several signals were legible well before the September 2008 shock. Here is what the series were saying twelve to eighteen months out.
Inverted as early as 17 January 2006 (FRED, series T10Y3M), with a trough of −0.64 point on 27 February 2007. The New York Fed treats it as one of its leading recession indicators.
series T10Y3MThe S&P/Case-Shiller national index peaks in July 2006 (FRED, CSUSHPINSA) then declines steadily: the real driver underlying the crisis turns before the credit market does.
Case-Shiller indexStill accommodative in mid-2007, they cross into tightening territory on 17 August 2007 (FRED, NFCI), the day after the BNP Paribas funds were frozen.
NFCI indexAround 314,000 per week in mid-2007 (FRED, ICSA), they rise steadily from late 2007, confirming the deterioration of the labor market.
series ICSAThe yield curve is the most documented signal. Work by Arturo Estrella and Frederic Mishkin for the New York Fed (1996, 1998) establishes that the spread between the 10-year yield and the 3-month Treasury bill precedes U.S. recessions by several quarters. In 2006–2007 the mechanism held: a money market tightened by Fed policy against contained long-term rates. Economically, an inverted curve reflects the market pricing in future rate cuts, hence a slowdown: a signal of expectations, not a direct cause of the recession.
The housing downturn is its counterpart in the real economy. The mid-2006 peak precedes the activity peak dated by the National Bureau of Economic Research (NBER) by eighteen months, and sets off the depreciation of mortgage-backed assets that would transmit to the banking system.
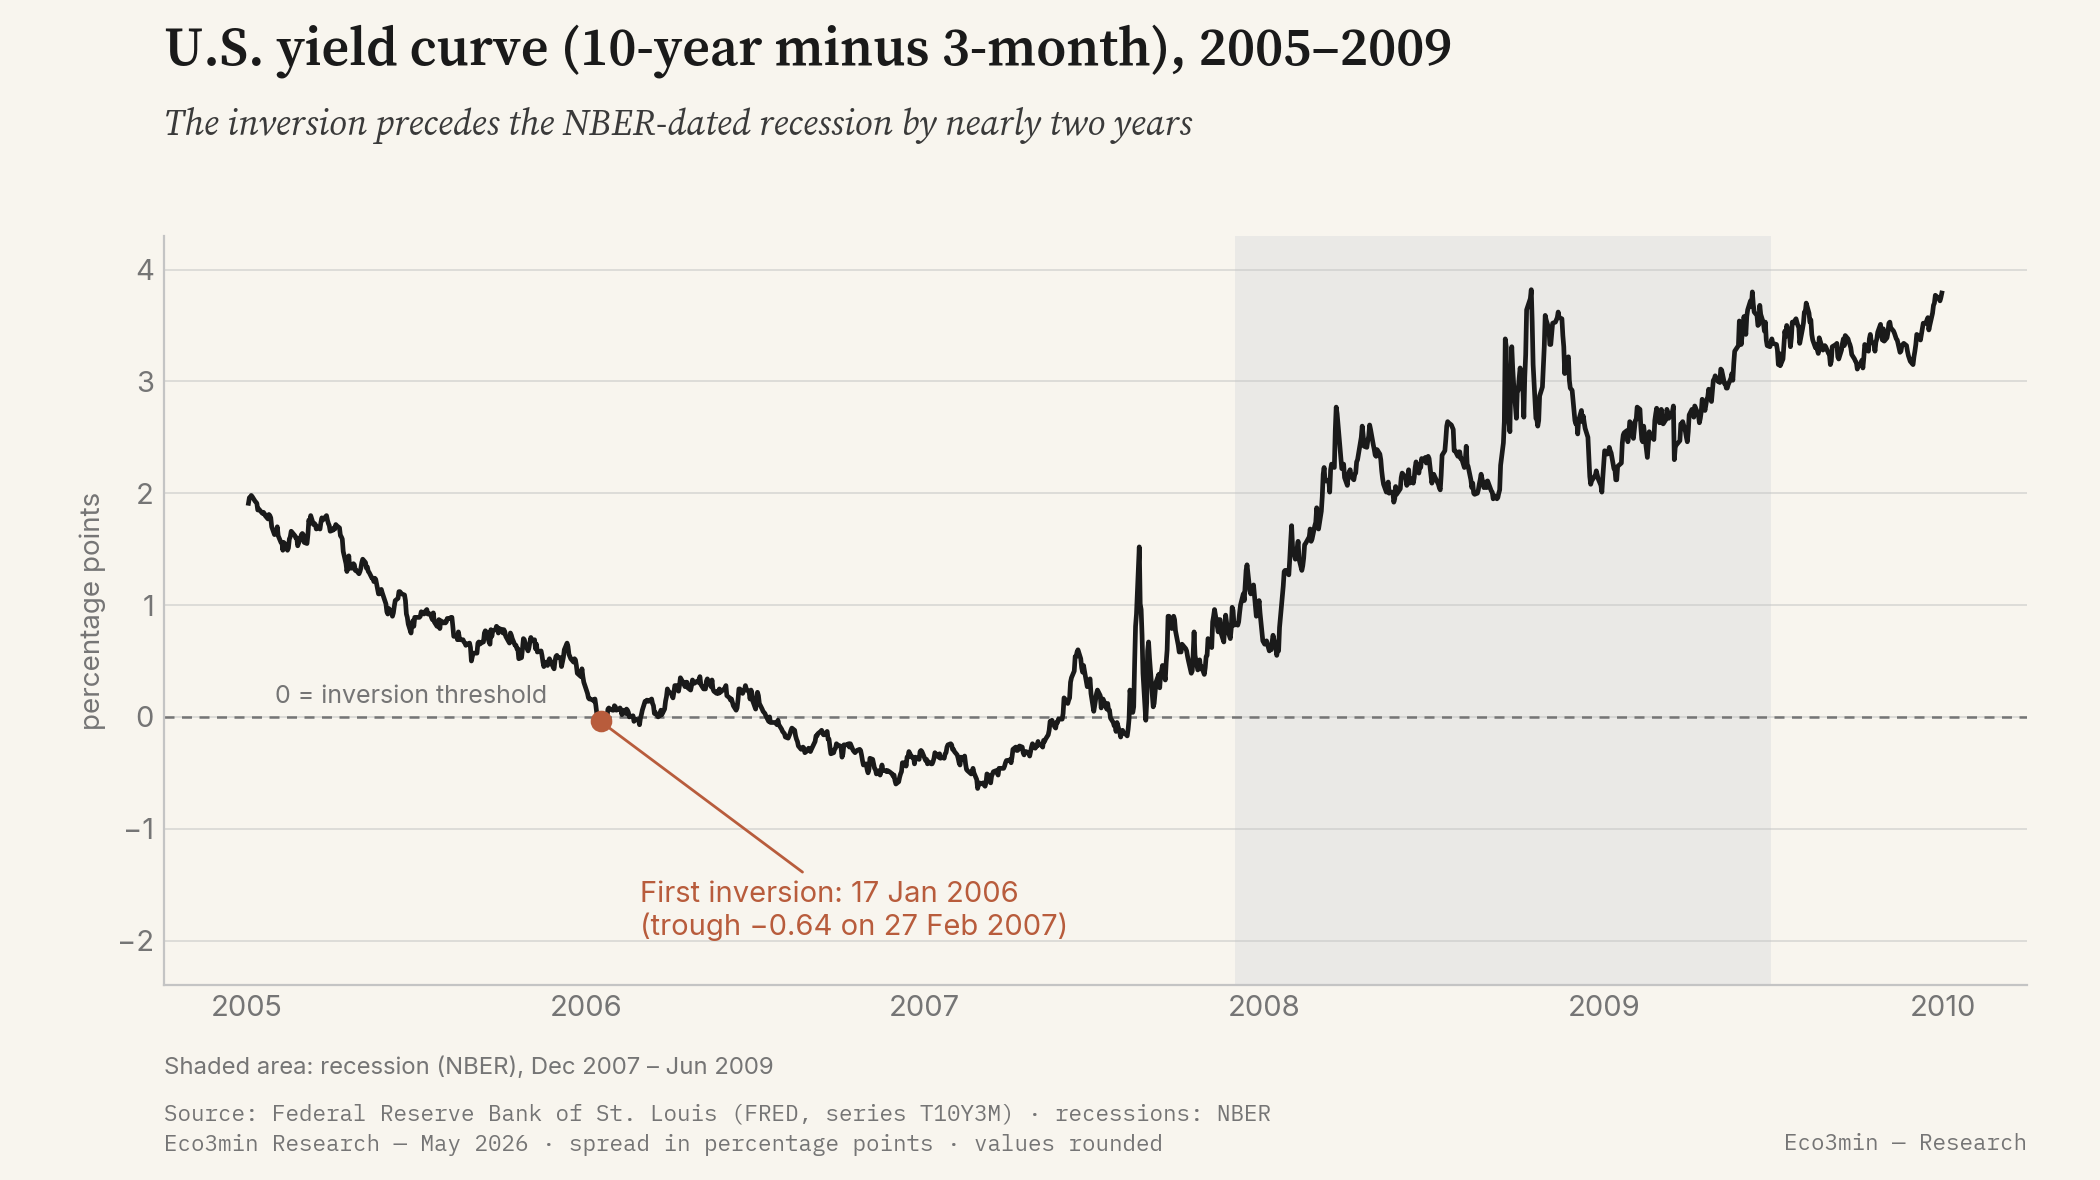
The curve was inverted for 243 trading sessions between January 2006 and August 2007. With the recession dated by the NBER from December 2007, the signal preceded the activity downturn by nearly two years, a legible lead time that the consensus of the day largely discounted. The lead is not uniform across episodes, which is why the curve is read as one indicator among several rather than a precise countdown to the quarter.
The regime shift
The transmission follows an identifiable chain. Defaults on subprime loans depreciate mortgage-backed securities; the losses move up into bank balance sheets and securitization vehicles; short-term funding (repurchase agreements, asset-backed commercial paper) dries up; the interbank market seizes; and forced asset sales spread the decline to other asset classes and to the real economy. Each link tightened the next: as collateral lost value, margin calls forced further sales, and the repricing fed back into the very balance sheets that had been the source of the losses.
The core of the mechanism is wholesale funding. On 16 September 2008, the day after Lehman’s bankruptcy, the Reserve Primary Fund money-market fund saw its net asset value fall below one dollar, a rare event that triggered heavy redemptions from money-market funds and drained the commercial paper financing companies rely on. Shadow finance (securitization vehicles, repo, money-market funds) proved to lack the safety net of deposit banks, and it was there that liquidity contracted most abruptly.
Over this period the Eco3min classifier returns the Slowdown state (G− I=): growth contracts (the CFNAI-MA3 activity gauge moves into negative territory), but core inflation does not collapse. The Dallas Fed’s Trimmed Mean PCE stays above 1.86% and never falls into I−. The destination is therefore not a Disinflationary Contraction (G− I−), but a slowdown within the disinflationary meta-regime. This reading is literal: it follows from the engine’s U.S. inputs (growth, inflation, financial conditions).
In parallel, the layer-2 Dollar Shortage overlay is activated, a measured verdict with global reach. One of its three triggers, an NFCI above +0.30, is crossed as early as the summer of 2007. The second materializes in the second half of 2008: the trade-weighted dollar index (DTWEXBGS) appreciates markedly as banks outside the United States find themselves short of dollar funding, leading the Federal Reserve to reopen and then extend its currency swap lines with the major central banks (December 2007, considerably enlarged in September–October 2008). Credit spreads widened sharply over the same period; because the history of the high-yield spread series is not retained in the Eco3min repository before 2023, it is the NFCI–dollar pair that documents the overlay here.
What makes 2008 a regime shift, rather than a simple deceleration, lies in the conjunction of the two readings: a cyclical state that deteriorates (growth turns G−) and a financial overlay that activates at the same time (acute stress, Dollar Shortage). Taken separately, neither the drop in activity nor the market strain is enough to characterize the episode; it is their superposition, over a window of a few months, that marks the passage from one regime to another.
The cyclical destination of this crisis is thus the disinflationary meta-regime of the Eco3min Atlas (the disinflationary regime), paired with the Dollar Shortage overlay. This page describes the sequence of the shift; the Atlas pages describe the destination states.
The central-bank response
The speed and scale of the response set 2008 apart from most earlier crises. The Federal Reserve lowered its effective policy rate from roughly 4.9% in September 2007 (FRED, series DFF) to a range of 0–0.25% on 16 December 2008. In parallel it deployed a battery of emergency facilities: the Term Auction Facility (TAF), the Primary Dealer Credit Facility (PDCF), the Commercial Paper Funding Facility (CPFF), and currency swap lines with other central banks.
The response was also international. On 8 October 2008, six major central banks, including the Federal Reserve, the European Central Bank and the Bank of England, cut their rates in a coordinated move. One distinction structures the whole apparatus: the provision of liquidity (collateralized loans to institutions judged solvent) falls to the Fed’s facilities; support for solvency (recapitalization) falls instead to the Treasury through TARP. Conflating the two is a recurring source of confusion: a central bank can lend against good collateral without ever putting public capital at risk, which is a different act from a government taking an equity stake in a bank.
On 25 November 2008 the Fed announced its first wave of asset purchases (mortgage-backed securities and agency debt), inaugurating quantitative easing. Its balance sheet (FRED, series WALCL) expanded from roughly $0.9 trillion to $2.25 trillion between the summer and the end of 2008, an expansion without precedent in its speed. By buying mortgage-backed securities, the Fed targeted directly the market at the origin of the crisis, and sought to bear down on long-term rates once the policy rate had reached its floor.
The fiscal response complemented the monetary action. On 3 October 2008 Congress passed the TARP program, endowed with $700 billion to recapitalize the banking system; federal deposit insurance (FDIC) was raised from $100,000 to $250,000 per depositor. It is the combination of lender of last resort, public recapitalization and deposit insurance that characterizes the 2008 apparatus.
Assets and markets
Around the peak of stress, asset trajectories polarized. U.S. equities fell roughly 57% between the S&P 500’s closing high of 9 October 2007 and the trough of 9 March 2009. U.S. Treasuries, a safe haven, appreciated (the 10-year yield fell). The dollar appreciated in the second half of 2008, driven by the flight to liquidity and the shortage of dollar funding. Oil, after a summer high near $147 a barrel, fell back below $40 by year-end.
The trajectories and levels described here are retrospective, for historical analysis. They constitute neither a forecast nor an investment recommendation, and past performance is not a reliable indicator of future performance.
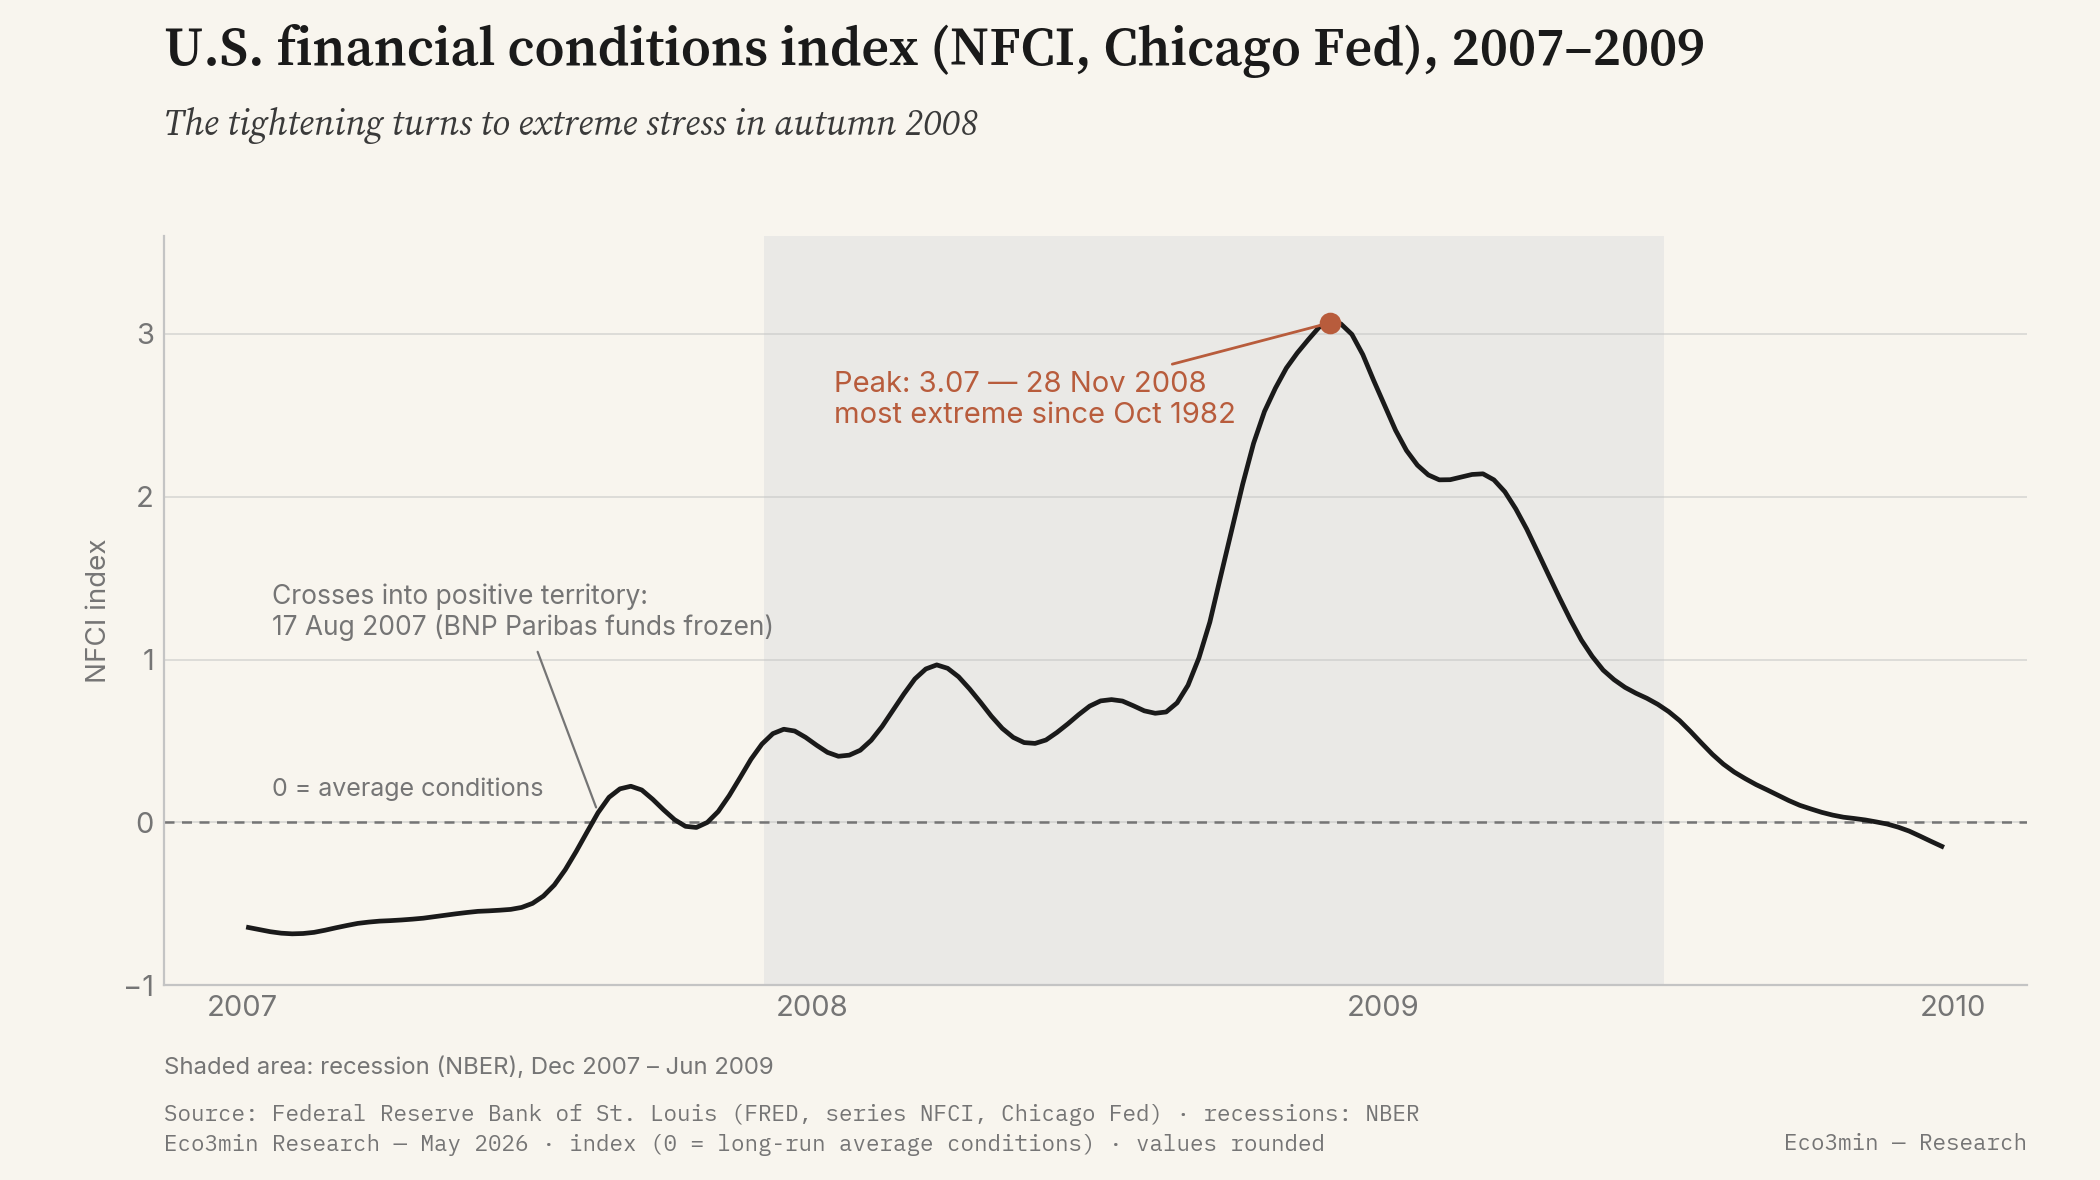
The NFCI summarizes the degree of strain in the financial system. Its peak of 3.07 on 28 November 2008 is the most extreme since October 1982: financial conditions break out of their usual range. It is this level, and not any threshold drawn a priori, that marks the passage into acute financial stress.
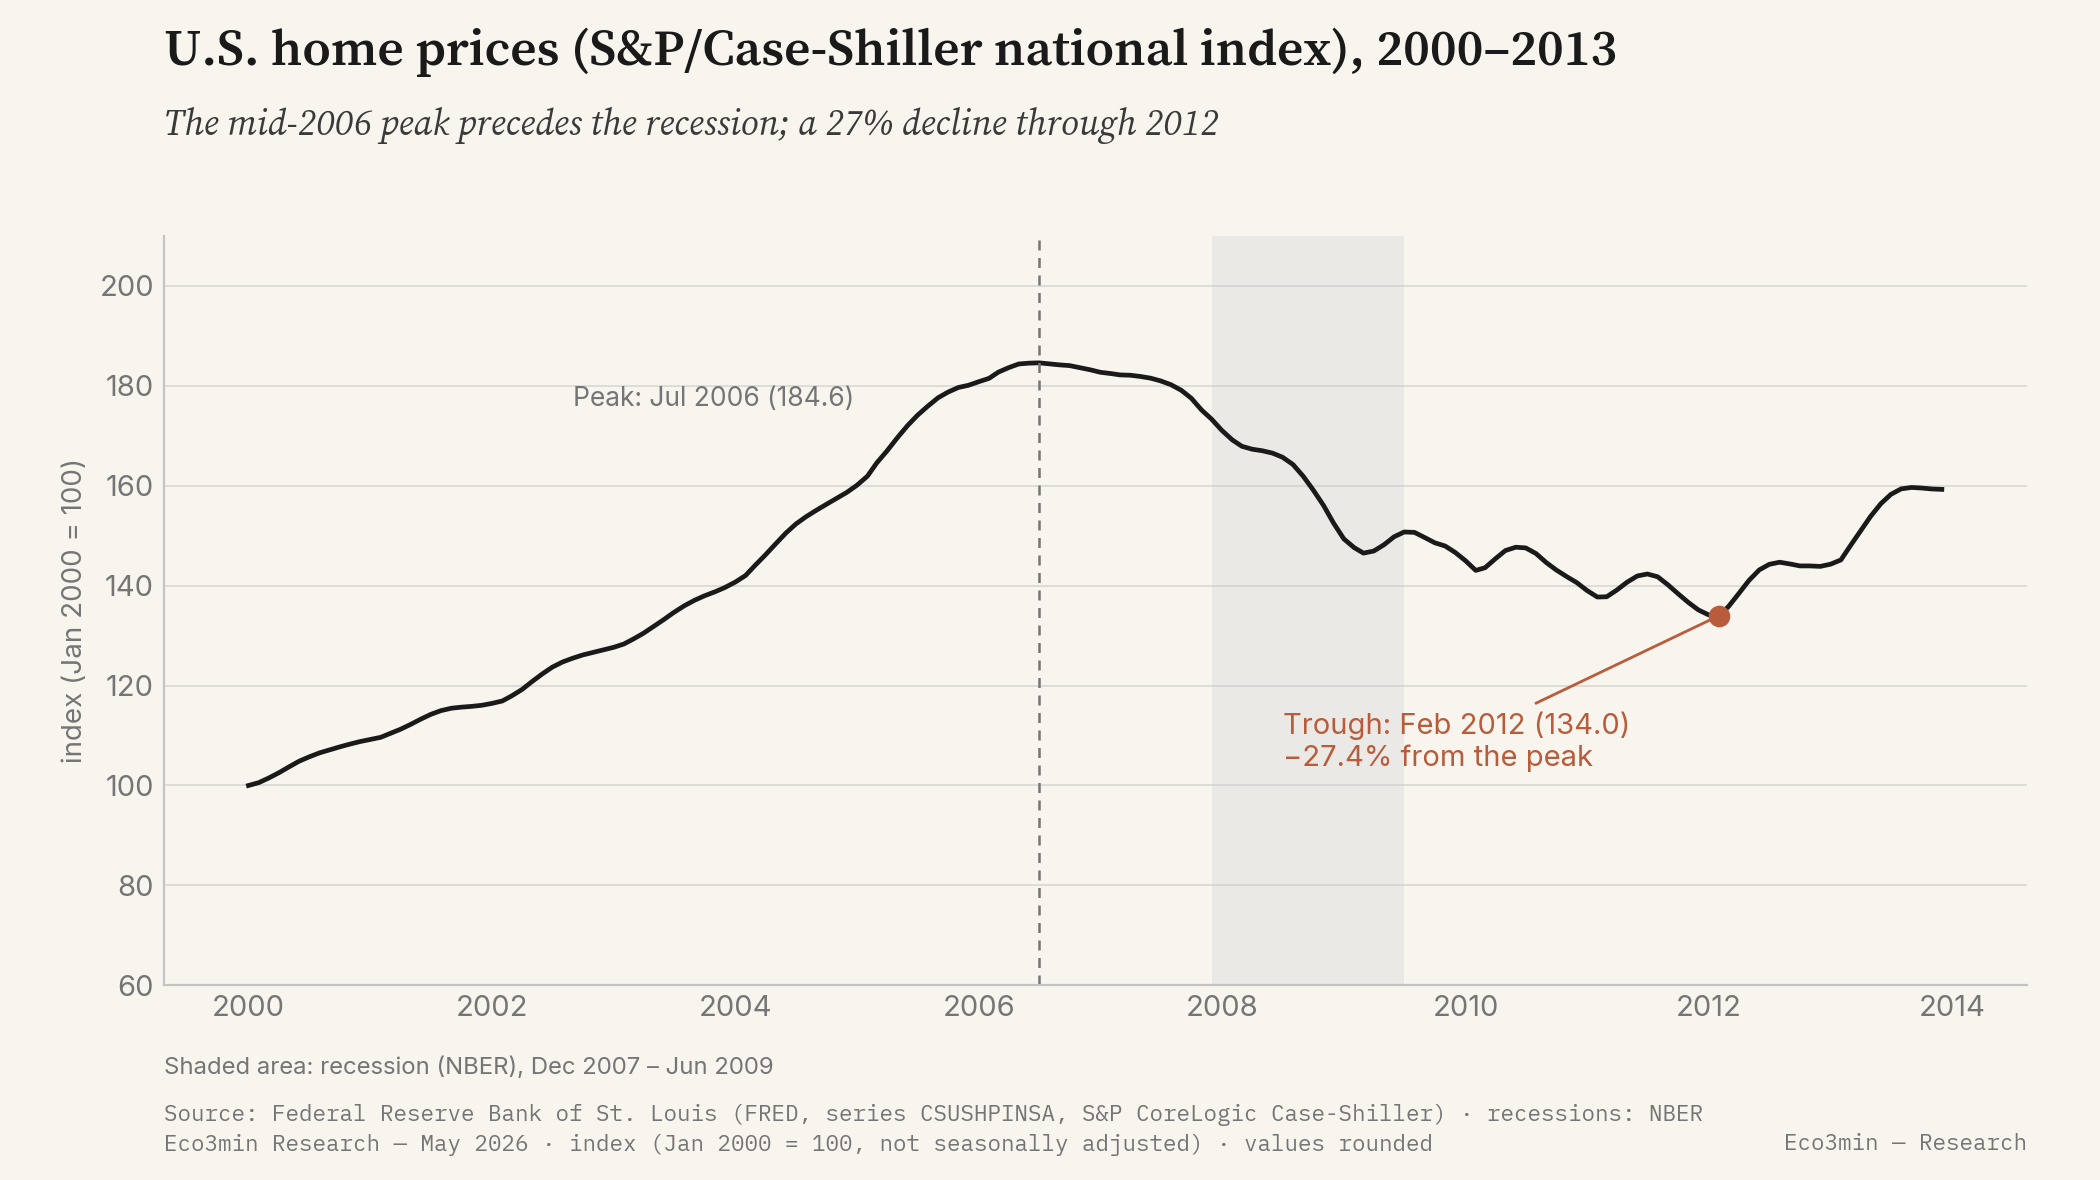
Housing, the epicenter of the crisis, illustrates the asymmetry of cycles: a peak reached as early as mid-2006, then a 27.4% decline that does not touch its trough until February 2012. The recession had been over since 2009 while prices kept falling: household deleveraging extends well beyond the acute phase. A recovery in activity and a recovery in the most damaged asset can run on very different clocks.
In the real economy, weekly initial jobless claims (FRED, series ICSA) peaked at 665,000 in late March 2009, and the unemployment rate would approach 10% in the autumn of 2009 (Bureau of Labor Statistics). The recession dated by the NBER runs from December 2007 to June 2009, nearly two years after the first inversion of the curve. The labor market, as is usual, lagged the financial shock: claims kept climbing well after the panic of September 2008 had passed its peak, and the unemployment rate did not crest until several months after the recession had officially ended.
What was different this time
The comparable of the same disinflationary meta-regime is the crisis of 1929. As in 1929, one observes a deflation of asset prices, banking contagion, cascading bank collapses and a lasting rise in unemployment. The resemblance of the initial mechanisms is real, and it is what fed, from 2008 on, the fear of a new Great Depression.
Three structural factors nonetheless distinguish 2008 from 1929.
- A rapid and coordinated monetary and fiscal intervention. Where the authorities’ response in the early 1930s was late and fragmented, the Fed and the Treasury acted within weeks in 2008: the policy rate cut to its floor, liquidity facilities, TARP recapitalization.
- An active lender of last resort and deposit insurance. Federal insurance (FDIC), raised to $250,000, contained the runs on deposits that had amplified the monetary contraction of 1930–1933.
- International currency swap lines. By supplying dollars to other central banks, the Fed contained the global dollar shortage, a channel absent in 1929, where the gold standard instead transmitted the constraint from one country to another.
What invalidated the analogy is measurable. On one hand, the soft-landing analogy (part of the 2007 consensus expected a resilient economy) was refuted by the indicators themselves: an inverted curve from 2006, rising jobless claims, financial conditions tightened from August 2007. The recession did indeed occur (December 2007 to June 2009). On the other hand, the analogy of the lasting deflation of 1929 did not materialize either: core inflation stayed positive (Trimmed Mean PCE above 1.86%), so that the destination remains a Slowdown and not a Disinflationary Contraction.
A qualification is in order so as not to over-interpret this classification. The cyclical growth × inflation grid does not capture, on its own, the severity of the 2008 financial shock: that is precisely the function of the layer-2 overlay. Read without that overlay, the “Slowdown” label under-describes the episode; read with it, it distinguishes an acute financial shock from a simple cyclical deceleration. It is the articulation of the two layers, and not either one in isolation, that accounts for 2008.
The 2007 consensus expected a soft landing; the yield curve, inverted from 2006, signaled the recession nearly two years ahead, with housing turning down from mid-2006.
Where this crisis leads
The 2008 crisis leads to the disinflationary meta-regime, under the Dollar Shortage overlay. The Atlas pages describe those states; this page documents the sequence of entry into them.
The meta-regime where the majority of post-war U.S. crises land: constrained growth, inflation tilted lower, tightened financial conditions.
Atlas — disinflationary regimeThe layer-2 overlay activated in autumn 2008: shortage of dollar funding, strained financial conditions, reopening of the Fed’s swap lines.
Atlas — Dollar ShortageSources
- Estrella, A. & Mishkin, F. (1996, 1998), Federal Reserve Bank of New York — predictive power of the yield curve for recessions.
- Bernanke, B. (2018), Brookings Papers on Economic Activity — real effects of the 2008 financial panic.
- Federal Reserve — FOMC statements (September 2007 to December 2008), emergency programs (TAF, PDCF, CPFF) and currency swap lines.
- U.S. Department of the Treasury — Emergency Economic Stabilization Act (TARP), October 2008; Federal Deposit Insurance Corporation (FDIC).
- National Bureau of Economic Research (NBER) — business-cycle dating (recession from December 2007 to June 2009).
- Eco3min data: yield curve (T10Y3M), financial conditions (NFCI), home prices (Case-Shiller, CSUSHPINSA), weekly jobless claims (ICSA), policy rate (DFF), Fed balance sheet (WALCL), trade-weighted dollar (DTWEXBGS).
Last updated — 31 May 2026
Disclaimer – Financial Information: The analyses, commentary, and content published on eco3min.fr are provided for informational and educational purposes only. They do not constitute investment advice or a solicitation to buy or sell financial instruments. Past performance is not indicative of future results. All investment decisions involve risk and are the sole responsibility of the reader.