
France Home Price-to-Income Ratio (Friggit Curve) Dataset (1965–2025)
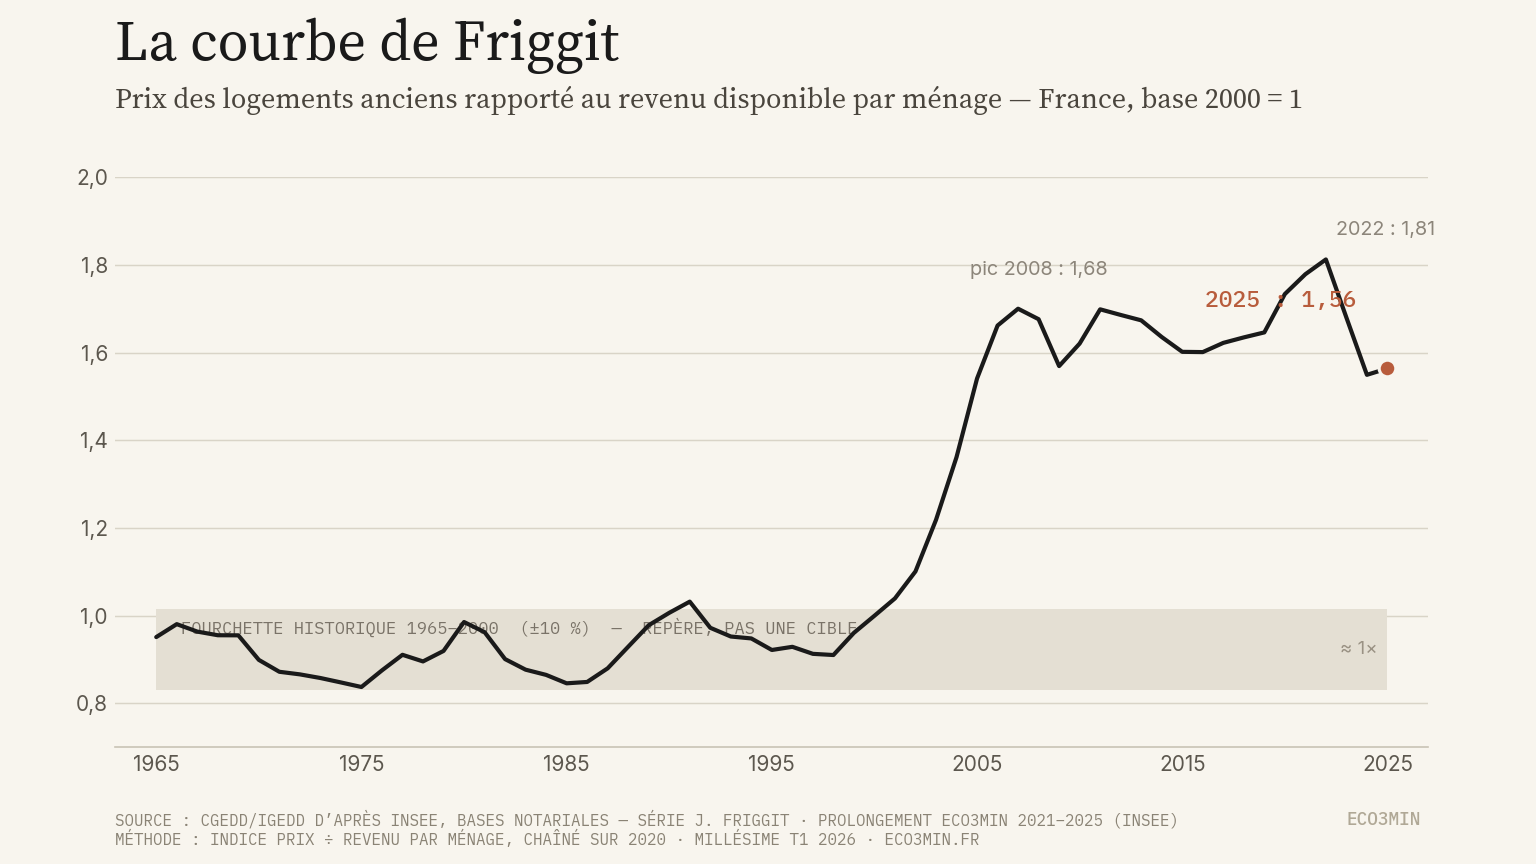
The France home price-to-income ratio — popularised as the Friggit curve — measures the Notaires-INSEE index of existing-dwelling prices divided by disposable income per household, rebased to 2000 = 1. It is the reference series behind the “tunnel of Friggit”, the band inside which French home values tracked household income from 1965 to 2000 before decoupling. This Eco3min dataset compiles that ratio as a clean annual series from 1965 to 2025: values through 2020 are recomputed from the IGEDD long-run workbook (J. Friggit’s components), and 2021–2025 extend the same construction using primary INSEE releases, chained on 2020. The source institution publishes the curve as charts but releases no ready-to-use numeric series — this page fills that gap.
Dataset: France home price-to-income ratio, Friggit curve (1965–2025, base 2000 = 1) · Vintage: Q1 2026 (annual series through 2025)
Key statistics — vintage Q1 2026
| Latest (2025) | 1.56 |
|---|---|
| Peak, annual (2022) | 1.81 |
| 2008 level | 1.68 |
| 1965–2000 average | 0.92 (range 0.84–1.03) |
| 2025 vs 1965–2000 norm | ≈ 1.7× |
| Observations | 61 (annual, 1965–2025) |
Source: CGEDD/IGEDD after INSEE and notarial databases — series by J. Friggit · Eco3min extension 2021–2025 (INSEE)
Macro Takeaway
The Friggit curve isolates the gap between what French housing costs and what households earn. From 1965 to 2000 the ratio oscillated inside a narrow band around its average of 0.92 (base 2000 = 1): home prices and income per household moved together. After 2000 the two decoupled, a shift Friggit attributes to the financial environment — falling long rates and longer mortgage terms lifting the price a given monthly payment can support, a transmission channel detailed in the Eco3min pillar on real estate, credit and rate cycles. The ratio is a level, not a flow: a high reading describes how far prices sit from their historical relationship with income, not where they are headed.
The rate shock illustrates the mechanism. The ratio peaked at 1.81 in 2022 (annual), then fell to a trough of 1.55 in 2024 as the 2022–2023 rise in mortgage rates compressed borrowing capacity, before stabilising slightly higher at 1.56 in 2025. That is roughly 1.7× the 1965–2000 norm — below the 2022 peak, but still far outside the historical band, a durability that has characterised the French and British markets since 2008 (IGEDD, 15 June 2026 update).
Construction & Components
The ratio compares two harmonised series on a common 2000 = 1 basis. It is not a market quote but a reconstruction of the reference indicator maintained by IGEDD, extended by Eco3min through the latest INSEE releases. Its price leg is the Notaires-INSEE index of existing-home prices in France, published quarterly.
Formula:
Ratio = Home price index (France, base 2000)
        / [ (Disposable income / Number of households) rebased to 2000 = 1 ]
Components:
- Home price index, France — 1965–2020: IGEDD long-run workbook (Notaires-INSEE spliced back to 1936); 2021–2025: Notaires-INSEE existing-dwelling price index, France metropolitan, all dwellings, seasonally adjusted (INSEE idbank 010567059), quarterly, annualised. Numerator.
- Household disposable income — 1965–2020: IGEDD workbook; 2021–2025: gross disposable income of households (incl. sole proprietors), current prices, SA-WDA (INSEE idbank 011794746), quarterly, annualised. Denominator, per household.
- Number of households — 1965–2020: IGEDD workbook; 2021–2025: principal residences, EAPL, France excl. Mayotte (INSEE idbank 001791242), annual. Denominator.
Frequency reconciliation: the 1965–2020 segment is native annual. For 2021–2025, the quarterly INSEE price and income series are averaged to annual figures and combined with the annual household count, then chained onto the 2020 value from the IGEDD workbook. An alternative chaining on 2019 reproduces 2020 within 0.2%, confirming robustness to revisions.
Coverage: 1965–2025, 61 annual observations, base 2000 = 1. The series starts in 1965 because that is the reference window for the “tunnel”; the price index itself extends back to 1936 in the workbook but the household-income denominator is most reliable from the mid-1960s.
Dataset Overview
| Indicator | France home price-to-income ratio, Friggit curve (1965–2025) |
|---|---|
| Geography | France (whole country; Paris / regional breakdowns not included in v1) |
| Frequency | Annual |
| Period | 1965–2025 |
| Variables | date, source_segment, home_price_to_income_ratio_base2000 |
| Format | CSV, Excel (XLSX) |
| Sources | CGEDD/IGEDD after INSEE, notarial databases — series by J. Friggit; INSEE (Notaires-INSEE, quarterly national accounts, EAPL) for 2021–2025 |
| Last updated | Vintage Q1 2026 (annual series through 2025) |
Dataset Variables
The CSV and Excel files contain the following columns.
| Column | Type | Description |
|---|---|---|
date | Date (YYYY-MM-DD) | Year of observation, dated 1 January |
source_segment | String | igedd_workbook_2020_vintage (1965–2020) or eco3min_extension_insee_chained_2020 (2021–2025) |
home_price_to_income_ratio_base2000 | Float | Price index ÷ income per household, base 2000 = 1 |
Column names match the CSV headers exactly.
Download the Complete Dataset
The full France home price-to-income ratio dataset is available in CSV and Excel formats.
Download CSV · Download Excel (XLSX)
Direct CSV Access
The complete series is served at a stable Eco3min URL:
https://eco3min.fr/wp-content/uploads/2026/07/friggit-price-income-france.csv
This URL returns the full dataset in CSV format for use in pandas, R, curl, or any data tool. The upstream primary source — the IGEDD long-run housing dossier — is maintained at igedd.developpement-durable.gouv.fr, which publishes the underlying workbook and charts but no ready-to-use numeric series for this ratio.
Using the Dataset in Python
import pandas as pd

url = "https://eco3min.fr/wp-content/uploads/2026/07/friggit-price-income-france.csv"
df = pd.read_csv(url, parse_dates=["date"])

print(df.tail())
print(df["home_price_to_income_ratio_base2000"].describe())
Using the Dataset in R
library(readr)

url <- "https://eco3min.fr/wp-content/uploads/2026/07/friggit-price-income-france.csv"
df <- read_csv(url)

tail(df)
summary(df$home_price_to_income_ratio_base2000)
Both examples load the dataset directly from the URL — no download or API key required.
Methodology
The 1965–2020 segment is recomputed from IGEDD’s long-run workbook (Séries longues de valeurs annuelles de 1800 à 2020), which carries J. Friggit’s home price index, household disposable income and household count. The 2021–2025 segment is produced by an Eco3min routine that pulls the same three variables from primary INSEE releases (Notaires-INSEE price index, quarterly national accounts for income, EAPL for household count), averages the quarterly series to annual figures, and chains the result onto the 2020 value so the two segments join without a level break.
Because no institution diffuses this ratio as a maintained numeric series, the dataset is refreshed manually on a quarterly cadence as INSEE publishes new quarters, and the vintage is dated on the page. The Friggit curve is a level series on base 2000 = 1; it is not deflated further and not seasonally re-adjusted beyond the seasonally adjusted price and income inputs. Deflating that same price leg by the consumer price index instead produces France’s house price index deflated by the national CPI.
Data Quality & Provider Notes
Latency is set by the slowest input. The Notaires-INSEE price index is released with a lag of roughly one quarter, and the annual household count (EAPL) is published once a year, so the most recent annual point can only firm up after all four quarters of a year are available — the series is intentionally annual rather than pretending to a fresher cadence it cannot support.
Revisions propagate. INSEE routinely revises household disposable income two to three quarters back, and the price index is itself seasonally re-estimated; each revision changes the affected years of the ratio, and Eco3min replaces the full extended segment on each refresh rather than patching single points.
No native equivalent exists. IGEDD publishes the curve as charts and the components in a workbook, but not as a ready-to-use ratio series; there is no Bloomberg or FRED ticker for it. That absence is precisely why this dataset exists — and why the footer names the real source, CGEDD/IGEDD after INSEE and notarial databases (series by J. Friggit), never a cleaner-sounding relabel.
What This Series Captures (And What It Doesn’t)
The Friggit curve is a structural affordability indicator, not a valuation verdict or a timing tool.
What it captures:
- How far French home prices sit from their 1965–2000 relationship with household income, on a single consistent basis.
- The 2000–2008 decoupling and the post-2008 plateau, both visible as a sustained departure from the historical band.
- The sensitivity of affordability to financing conditions — the 2022–2024 decline coincided with the rise in mortgage rates.
What it does NOT capture (common misinterpretations):
- The “tunnel” is not a target. The 1965–2000 band is a historical observation, not a level prices are obliged to return to. A ratio above the band is a description of distance from that norm, not a forecast of reversion or an implied “overvaluation of X%”.
- France as a whole hides Paris and the provinces. The national ratio averages markets that have diverged widely; regional curves (Paris, Île-de-France, province) sit at different levels and are not shown in v1.
- Income per household is not income per consumption unit. The denominator uses all households, owners and tenants alike; household size has shrunk over the period, and tenant income has grown more slowly than the average — structural effects the ratio does not adjust for.
- A ratio is not a price. A falling ratio can reflect rising income as much as falling prices; it says nothing on its own about nominal home values.
The series is most useful as a long-horizon regime marker — has the price/income relationship left its historical band, and by how much — not as a signal to act at any point in time. Friggit’s own prospective scenarios are the author’s work and are cited as such, not endorsed here.
Historical Phases
1965–2000 — Inside the tunnel. The ratio oscillated between 0.84 (1975) and 1.03 (1991) around an average of 0.92 (base 2000 = 1). Home prices and income per household moved together; deviations were cyclical, tied to the 1980s credit cycle and the early-1990s downturn, and always reverted inside the band.
2000–2008 — The decoupling. The ratio left the tunnel around 2002 (1.10) and climbed to 1.68 by 2008, an unprecedented departure. Friggit attributes the move to the financial environment — falling long rates and lengthening mortgage terms raising the price a fixed monthly payment could carry (IGEDD).
2008–2021 — The plateau (“lévitation”). Rather than reverting after the global financial crisis, the ratio held above 1.5 for more than a decade — a persistence Friggit describes as specific to France and the UK, sustained by successive declines in mortgage rates. It sat at 1.65 in 2019 and 1.73 in 2020.
2022–2025 — The rate shock. The ratio peaked at 1.81 in 2022 (annual), then fell to a trough of 1.55 in 2024 as mortgage rates rose sharply and borrowing capacity compressed, before stabilising slightly higher at 1.56 in 2025. It remains roughly 1.7× the 1965–2000 norm.
Related Macroeconomic Datasets
- US home prices vs mortgage rates and affordability — the US equivalent, on the same price-vs-financing logic
Related Research
- Interest rates and real-estate purchasing power — how rates set what a fixed payment can buy
- The real-estate credit cycle and price dynamics
Deep analytical framework
- Real estate, credit and rate cycles — the Eco3min pillar this dataset sits under
Macroeconomic Dataset Hub
This dataset is part of the Eco3min macro-financial data repository.
Explore the Eco3min Dataset HubSources
- CGEDD/IGEDD, Le prix de l’immobilier d’habitation sur le long terme — long-run workbook and charts, series by J. Friggit (IGEDD after INSEE and notarial databases). Update of 15 June 2026.
- INSEE — Notaires-INSEE existing-dwelling price index (idbank 010567059), gross disposable income of households (idbank 011794746), estimated housing stock / principal residences (idbank 001791242), for the 2021–2025 extension.
Dataset Reference
Last updated — 21 September 2026
Disclaimer – Financial Information: The analyses, commentary, and content published on eco3min.fr are provided for informational and educational purposes only. They do not constitute investment advice or a solicitation to buy or sell financial instruments. Past performance is not indicative of future results. All investment decisions involve risk and are the sole responsibility of the reader.