
How to Invest $10,000 in 2026: What the Amount Actually Changes
A ten-thousand-dollar stake reaches almost every asset class an individual investor can name, yet it changes what each of those routes costs and delivers. The binding variable is the amount, not the menu.
Most guides answer the ten-thousand-dollar question by listing asset classes and swapping the number in the headline. That treats the sum as neutral. It is not.
At $10,000 the question is not which assets exist but which constraints the sum lifts or keeps in place: costs, entry tickets, real diversification, and stock versus flow.
- Commission-free trading has erased most per-trade fixed costs, but flat fees that remain, such as the roughly $20 to $50 charged on non-transaction-fee mutual funds, still bite hardest on the smallest orders.
- Direct real estate stays out of reach: the median first-time down payment ran 10% of a roughly $415,000 median home in 2025 (NAR), about $41,500, over four times a $10,000 stake, while a REIT needs one share.
- The 2026 IRS caps ($24,500 in a 401(k), $7,500 in an IRA) are not the binding limit at this sum; the tax clock inside the wrapper is.
- Vanguard research finds deploying a lump sum at once has beaten spreading it out around two-thirds of the time historically, an observation about odds, not an instruction.
What $10,000 does not change
Start with what stays fixed. The asset classes available to a retail investor, and the way each behaves across the macro cycle, are identical at one thousand dollars and at one hundred thousand. Equities, bonds, listed real estate, commodities exposure through funds, cash instruments: the menu does not expand because the check is larger. The question of which of those classes suits a given horizon and macro backdrop is a real one, and it is answered elsewhere. Our overview of where different asset classes fit maps that terrain, and the tool tracking how each class has behaved by macro regime puts numbers on it.
That regime behaviour is a property of the asset class, not of the position size. A given class responds to growth, inflation, and rate cycles the same way whether it is held in a small account or a large one. Which classes have tended to hold up across changing conditions is the subject of the wider asset-allocation framework, and it sits deliberately outside this page. The amount cannot alter how an asset behaves; it can only alter the cost and the structure of the route used to hold it.
This page starts one step later. Take the asset-class decision as made, and ask a narrower question: what does the amount itself do to the routes into those assets? The answer runs through four deformations. The amount doesn’t pick the assets; it picks the constraints. It changes the relative weight of costs, it opens or closes entry tickets, it bounds how much genuine diversification is reachable, and it sets the terms of the lump-sum-versus-staggered decision. None of those four is a property of the asset. All four are properties of the sum.
What the amount changes, first: the weight of costs
A cost of a few dollars is trivial on a large order and punishing on a small one. That is arithmetic, not opinion, and it is the clearest way the amount reshapes outcomes. Two kinds of cost sit on any purchase. Proportional costs scale with the amount and leave the percentage untouched: the average asset-weighted expense ratio on an index equity ETF was 0.14% in 2025, according to the Investment Company Institute’s Trends in the Expenses and Fees of Funds released in March 2026, and that 0.14% is the same slice whether the position is worth one thousand dollars or fifty thousand. Fixed costs behave in the opposite way. A flat charge is a rounding error on a big ticket and a wall on a small one.
The US retail context has quietly removed the most familiar fixed cost. Stock and ETF commissions at the large brokers are now zero, so the classic problem of a per-trade fee eating a small order has largely gone. What remains is narrower and easy to miss: transaction fees of roughly $20 to $50 on mutual funds outside a broker’s no-transaction-fee list, wire and account-transfer charges, and the bid-ask spread on anything thinly traded. On a $10,000 purchase a $25 flat fee is 0.25% of the stake. On a $1,000 purchase the same $25 is 2.5%. The fee did not move; the amount underneath it did.
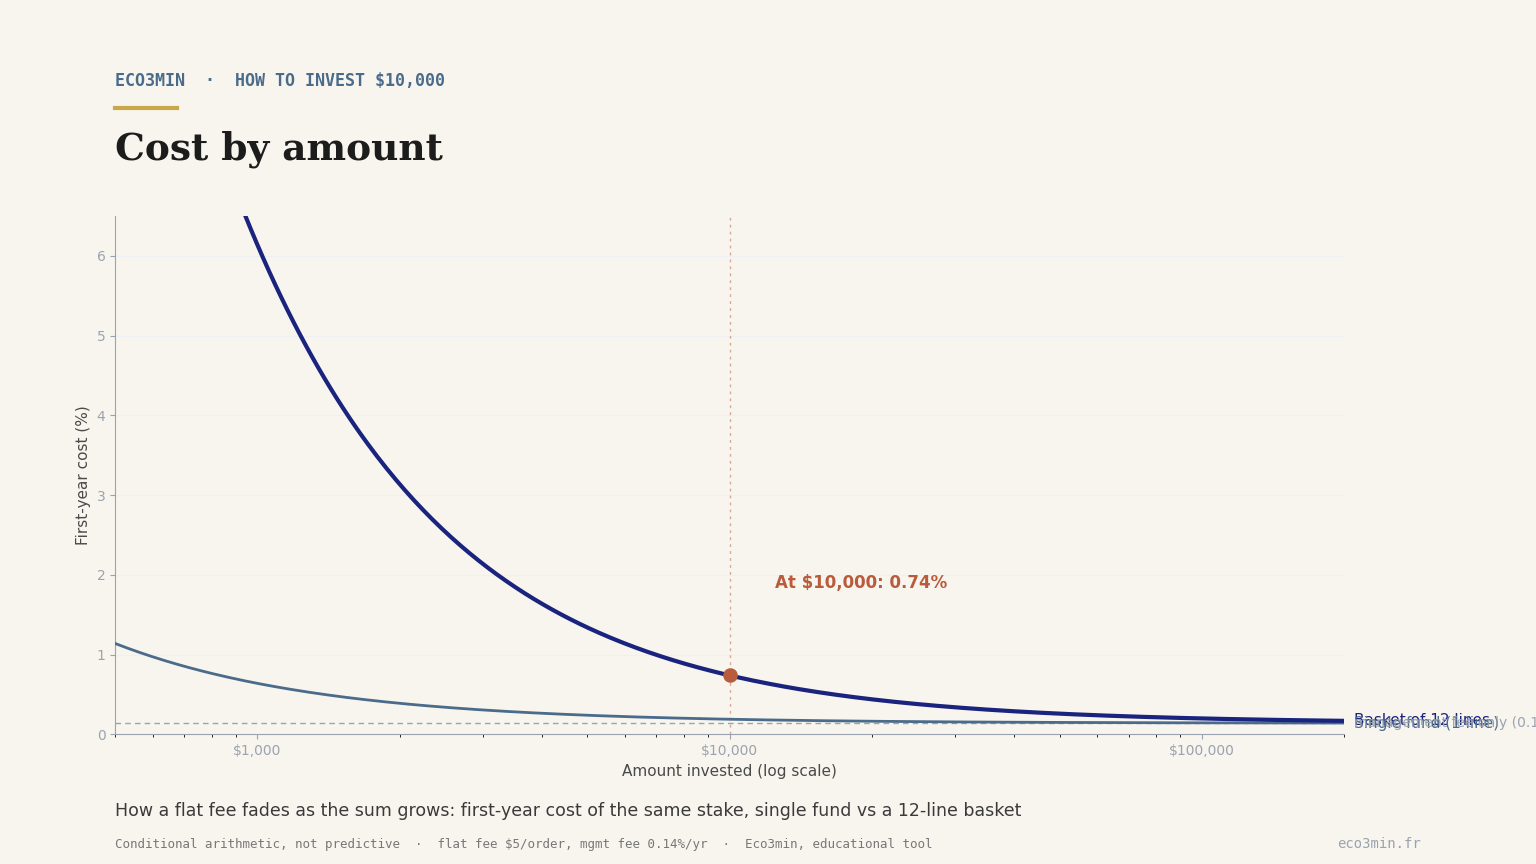
Put the two cost types together and the amount’s role sharpens. Consider two ways of deploying the same $10,000. The first buys a single broad index fund: near-zero commission, one 0.14% proportional slice, no per-line friction, for an all-in first-year cost close to fourteen dollars. The second builds a basket of a dozen positions through funds that each carry a $25 transaction fee, three hundred dollars of flat cost before a single share moves, or 3% of the stake, which dwarfs any expense ratio. Run the same two routes at $50,000 and the flat-fee route’s drag falls to 0.6%; run them at $2,000 and it climbs past 15%. The proportional route barely moves across all three sums. The amount is doing the work.
The point is the threshold, not a target. There is a level of investment above which a given flat cost stops mattering and below which it dominates the return math. That level is a fact about the cost structure a specific route carries, and it is worth measuring before committing rather than after. The tool below lets you set a fixed cost, a proportional rate, and a number of separate positions, and it reads out the all-in first-year cost as a percentage of the amount, for two ways of deploying the same sum.
Cost by amount
How a flat fee fades as the sum grows
Single fund (1 line)
Basket of lines
What the amount changes, second: entry tickets
Some routes carry a minimum size below which the door does not open, and the amount decides which doors those are. Direct real estate is the cleanest example. The median down payment for first-time buyers ran 10% of purchase price in 2025, on a median existing-home price near $415,000, according to the National Association of Realtors 2025 Profile of Home Buyers and Sellers, which works out to roughly $41,500 before closing costs, a bit over four times a $10,000 stake. Across all buyers, first-time and repeat combined, the median down payment was higher still at 19%, near $79,000, since repeat buyers roll forward the equity from a prior sale. Direct property is not an expensive version of the same decision at this amount; it is a different decision that this amount cannot reach.
Listed real estate removes the ticket entirely. A REIT trades like any share, so the same exposure to rental income and property values that a down payment gates behind tens of thousands of dollars is reachable with a single share, or a fraction of one. The ticket, again, is a feature of the route, not of the asset: the underlying is real estate in both cases, but one route demands a multiple of the sum and the other does not. Between those extremes sit vehicles with softer minimums, some mutual funds requiring an initial $1,000 to $3,000, that a $10,000 sum clears comfortably but a smaller one would not.
Reading the tickets as a gradient rather than a single wall is more accurate. At $10,000, listed funds and most brokerage products are fully open, softer fund minimums are cleared, private real estate and certain alternatives carrying five- or six-figure minimums stay shut, and direct property remains the clearest closed door. Moving up the amount scale opens the higher tickets in sequence; moving down closes the softer ones first. The stake sets the position on that gradient, and the position, not the label on the asset, determines what is actually reachable.
What the amount changes, third: effective diversification
Diversification has a cost per line, and at a modest sum that cost sets a ceiling on how many holdings are worth owning directly. Spreading $10,000 across, say, twenty individual stocks means positions of five hundred dollars each, where the spread paid on entry and exit, and the effort of tracking twenty names, weigh heavily against any diversification gained. The same ten thousand dollars in one broad index fund buys hundreds of underlying names at a single 0.14% slice. That is the sense in which a fund compresses diversification into one line: it converts the per-position friction that the amount would otherwise impose into a single small proportional cost.
Two frictions compound at this size. The first is transactional: buying many small positions means paying the bid-ask spread on each, and on funds that carry them a flat fee too, so the cost of assembling breadth rises with the number of lines. The second is structural: the marginal diversification benefit of each additional holding falls quickly once a portfolio already spans a broad market, so the tenth or twentieth individual name adds little variance reduction while adding its full share of friction. Fractional shares soften the first friction but not the second. A broad fund sidesteps both at once, which is why, at a modest sum, the diversification reachable through a basket of names is usually narrower than the diversification a single index line already contains.
This is where the amount and the instrument interact most directly. At a large sum, a portfolio of individual holdings can be diversified without the per-line friction dominating. At $10,000 it usually cannot, which is why the fund route and the direct-holding route are not interchangeable at this size. The trade-off between owning the index and owning the names is set out in our comparison of index funds against direct securities, and the mechanics of picking a fund in our guide to how an index fund is selected.
The sequence commonly cited before any of this
Before a lump sum is deployed at all, personal-finance guidance commonly describes a sequence: hold a cash buffer for emergencies, clear high-interest debt, then invest for the long term. It is worth stating that this is a convention repeatedly described in that literature, not a rule this page issues. The logic behind each step is checkable on its own terms. A cash reserve sits in instruments whose job is stability rather than return, surveyed in our note on where short-term cash is typically held. High-interest debt carries a certain, guaranteed cost that a market return only might exceed, a comparison laid out in the debt-versus-investing trade-off tool. The sequence is descriptive; where a specific situation sits within it is a personal judgment this page does not make.
Stock or flow: deploy at once or spread it out
A $10,000 sum already in hand is a stock of capital, and the decision it raises is different from the one a monthly contribution raises. A recurring contribution sized on a budget is a flow, treated separately in our note on setting a monthly contribution. For a stock, the live question is timing: put it to work at once, or stagger it in over months. Vanguard research comparing the two across US, UK, and Australian markets found that deploying a lump sum immediately outperformed spreading it over twelve months roughly two-thirds of the time, by an average of about two percentage points, because markets rise more often than they fall.
That is a dated statistical observation about historical odds, not a directive: the same research shows staggering wins in the minority of periods when prices fall through the deployment window, and the gap between either approach and holding cash indefinitely dwarfs the gap between the two. The full mechanics, and the behavioural reasons an investor might choose the lower-odds route deliberately, are set out in our piece on deploying a lump sum versus averaging in. The average edge is modest, around two percentage points over the deployment window in the historical record, and it accrues only to capital actually in the market. Its mirror image is the risk it accepts: deploying at once also means bearing a near-term drawdown in full if one arrives, which is the discomfort that staggering is designed to soften. What the amount changes here is only the scale of the decision, not its logic: the stock-versus-flow distinction is identical at every sum.
Where the wrappers fit
The account a $10,000 stake sits in shapes its after-tax outcome more than its size does. The 2026 contribution caps set by the IRS, $24,500 of employee deferral in a 401(k) and $7,500 in an IRA, are far above this sum, so the cap is not the binding constraint at $10,000; the choice between a taxable brokerage account and a tax-advantaged one is. That choice is set out in our comparison of taxable and tax-advantaged accounts. One fact from the funding-order literature is worth flagging as documented rather than advised: where an employer matches 401(k) contributions, that match is a return available on the matched portion before any market return, which is why it appears first in most descriptions of the conventional funding order. The distinction that matters at this sum is between an account taxed each year on income and gains and one where tax is deferred or removed, because over a long horizon it is the compounding of untaxed returns, not the size of the initial stake, that drives the gap. A $10,000 position behaves identically inside either wrapper on day one; the wrappers diverge only as the tax clock runs. The wrapper does not change what the amount can access; it changes what the amount keeps.
What $10,000 clears and what it does not
The four deformations sort cleanly into what this sum lifts and what it leaves in place. The table reads each constraint as a property of the amount, not of the asset behind it.
| Dimension | At $10,000 | Why it is the amount, not the asset |
|---|---|---|
| Per-trade commission | Cleared: $0 on stocks and ETFs at major brokers | The fixed cost that once scaled against small orders has been removed at the route level |
| Flat fund or transfer fees | Bites: a $25 fee is 0.25% here, 2.5% at $1,000 | The same flat charge is trivial on a large ticket and heavy on a small one |
| Direct real estate down payment | Out of reach: roughly $41,500 first-time median (NAR, 2025) | A route with a minimum several times the stake; the REIT route has none |
| Individual holdings | Bounded: per-line friction caps how many are worth owning | A fund compresses the same breadth into one 0.14% line |
| Wrapper contribution caps | Cleared: $24,500 and $7,500 caps sit far above (IRS, 2026) | The binding variable is the tax clock, not the ceiling |
Read by the macro regime
The macro backdrop shapes what each asset class delivers, but it does not change what $10,000 can access, which keeps this section short. As of mid-2026 the reading is a transition with mixed signals: the Federal Reserve held its target range at 3.50% to 3.75% at its June 2026 meeting, underlying inflation sat near trend with the Dallas Fed’s Trimmed Mean PCE at 2.4% over the twelve months to May 2026, while an energy shock tied to the 2026 Middle East conflict lifted headline PCE to 4.1% over the same period, a wide gap between headline and underlying. The live reading and its components are tracked on the current macro regime dashboard.
What that means for a ten-thousand-dollar deployment is indirect. The regime is an input to which asset classes suit the moment, the question our asset-class overview and the framework for choosing investments across regimes address. It is not an input to the four constraints this page covers: fixed costs, entry tickets, diversification per line, and stock versus flow behave the same in every regime. The amount sets those constraints; the regime sets the payoff of the assets the amount then reaches.
- The asset menu is identical at every sum; what the amount changes is the cost, reach, and structure of the routes into it.
- Fixed costs fall as a share of a larger stake while proportional costs hold flat, so the threshold where a flat fee stops mattering is a fact about the route worth checking first.
- Some routes carry a minimum ticket, direct real estate several times this stake, that a $10,000 sum cannot clear even when the underlying asset is reachable another way.
- At this size a fund compresses diversification into one low-cost line that a basket of individual holdings cannot match without per-line friction dominating.
Frequently asked questions
Does a larger sum give access to more asset classes?
Generally no. The classes a retail investor can reach, equities, bonds, listed real estate, fund-based commodity exposure, and cash instruments, are the same across a wide range of amounts. A larger sum changes the cost, the reachable entry tickets, and the achievable diversification within those classes rather than adding new ones. Direct real estate is the main exception, since its down payment gates access by size.
How much of a $10,000 investment typically goes to costs?
It depends on the route. A single broad index equity fund carried an average expense ratio of 0.14% in 2025 (ICI), so proportional costs are small. Fixed costs vary: commission is zero on stocks and ETFs at major brokers, while a flat mutual-fund transaction fee of $20 to $50, if it applies, is a larger percentage on a small stake than a large one. The cost tool on this page lets you compare routes.
What does the evidence show about investing $10,000 at once versus spreading it out?
This is a descriptive question with a documented statistical answer rather than a rule. Vanguard research found that deploying a lump sum at once historically outperformed spreading it over twelve months about two-thirds of the time, because markets rise more often than they fall, while staggering fared better in the minority of falling-market windows. Which pattern a given period follows is unknowable in advance.
Can $10,000 buy into real estate?
Through listed vehicles, yes; through direct ownership, generally not. A REIT trades like a share and needs only the price of one unit, so property exposure is reachable. A direct purchase requires a down payment that ran a median of 10% for first-time buyers in 2025, roughly $41,500 on a median-priced home (NAR), well beyond this sum.
Do the IRS contribution limits restrict a $10,000 investment?
No. The 2026 limits, $24,500 of employee deferral in a 401(k) and $7,500 in an IRA, both sit above $10,000, so the cap is not binding at this amount. The relevant wrapper question is which account type fits, taxable or tax-advantaged, and how the tax treatment inside it works over time.
Where this leaves the ten-thousand-dollar question
The useful reframing is to stop asking what to buy and start asking what the sum lets go of. Ten thousand dollars clears the per-trade fee and the wrapper caps, keeps direct property firmly out of reach, and sits at the size where a fund still out-diversifies a basket of individual names. Read that way, the amount is not a smaller version of a bigger decision; it is its own set of constraints, and naming them is more useful than restating the asset menu one more time.
This article is general information, not investment, tax, or financial advice, and does not account for any individual situation. Figures are sourced and dated in the text and may change. Consider your own circumstances, and where relevant a regulated professional, before acting.
Last updated — 8 July 2026
Disclaimer – Financial Information: The analyses, commentary, and content published on eco3min.fr are provided for informational and educational purposes only. They do not constitute investment advice or a solicitation to buy or sell financial instruments. Past performance is not indicative of future results. All investment decisions involve risk and are the sole responsibility of the reader.