
T10Y3M: 10-Year Treasury Minus 3-Month Bill Yield Spread Daily Data (1982–2026)
T10Y3M tracks the daily 10-year minus 3-month US Treasury yield spread published by the Federal Reserve via FRED. Daily observations since January 1982 — the recession indicator used by the NY Fed in its official probability model.
The T10Y3M series, published daily by the Federal Reserve via FRED, tracks the spread between the 10-year US Treasury constant maturity yield and the 3-month Treasury bill yield since January 1982 — over 11,000 daily observations. T10Y3M is the recession indicator used by the Federal Reserve Bank of New York in its official recession probability model, and academic research has repeatedly found it to outperform the more popular 10Y-2Y spread as a leading indicator across post-1980 US cycles.
Dataset: Yield Curve Spread 10Y–3M (1982–2026) · Updated 2026-09-18
Loading FRED data…
Source: FRED series T10Y3M · Federal Reserve Bank of St. Louis
Macro Takeaway
T10Y3M decomposes mechanically into two components: a long-end rate that reflects growth expectations, inflation expectations, and the term premium, and a short-end rate that closely tracks the current and near-term expected Fed Funds rate. An inversion (T10Y3M < 0) therefore signals that the market expects future short rates — and by extension, the Fed’s policy stance — to be lower than the current one, typically because growth is expected to slow enough to force rate cuts.
Compared to the 10Y–2Y spread, T10Y3M tends to invert later but more reliably ahead of US recessions. The 3-month leg is more tightly anchored to the Federal Funds rate than the 2-year leg, which embeds market expectations of future Fed moves and can therefore steepen prematurely once cuts are priced in.
Since 1968, every US recession has been preceded by an inversion of T10Y3M, with a lead time generally in the 6 to 18-month range. Measured by the FRED T10Y3M series. The 2022–2024 inversion was the deepest since the early 1980s and one of the longest on record; the spread had re-steepened by mid-2024 as the Fed began its cutting cycle.
Dataset Overview
| Indicator | Yield Curve Spread 10Y–3M (1982–2026) |
|---|---|
| Geography | United States |
| Frequency | Daily (business days) |
| Period | 1982–2026 |
| Variables | date, spread_10y_3m |
| Format | CSV, Excel (XLSX) |
| Sources | Federal Reserve Bank of St. Louis — FRED |
| Last updated | — |
Dataset Variables
The CSV and Excel files contain the following columns.
| Column | Type | Description |
|---|---|---|
date | Date (YYYY-MM-DD) | Observation date |
spread_10y_3m | Float | 10-year minus 3-month Treasury spread, in percentage points |
Column names match the CSV headers exactly.
Trading Days Spent Below a Spread Threshold
An inversion is a threshold event, and the threshold everyone uses is zero. This tool lets you set it, zero or any other level, and the window, then counts the trading days at or below it, the contiguous episodes of twenty days or more, the longest of them and the most recent crossing. It describes the record of inversions; it does not forecast the next one.
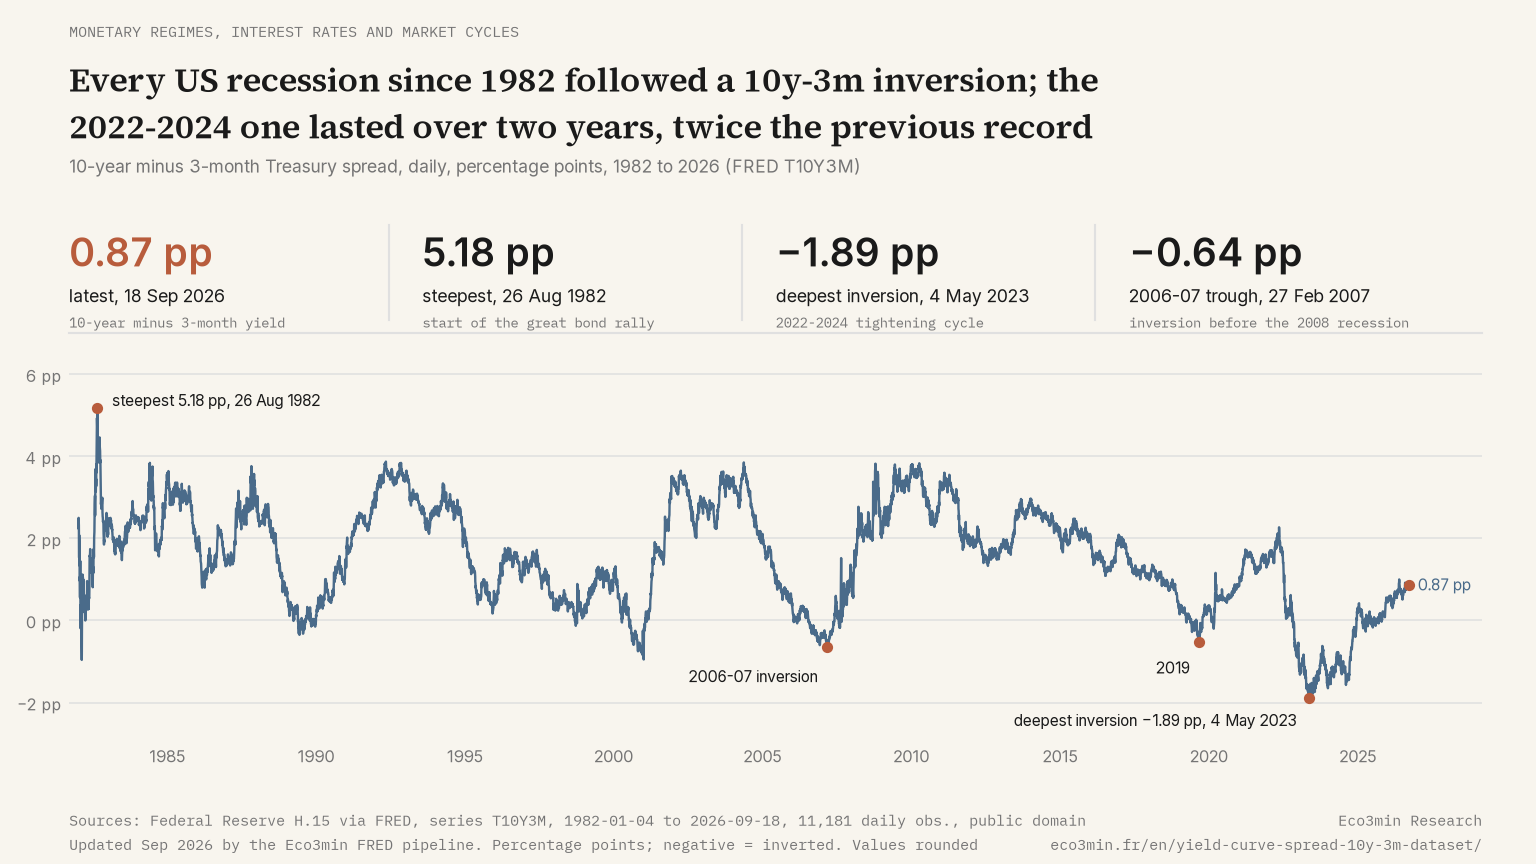
At zero, 1,252 of the 11,181 trading days since January 1982, or 11.2 percent, were inverted, in seven episodes of twenty days or more: two in 1989, one from July 2000 to January 2001 (128 days), one from July 2006 to May 2007 (219 days), two in 2019, and the record of 534 trading days from 25 October 2022 to 12 December 2024. The spread last touched zero on 16 October 2025 and stood at +0.87 percentage point on 18 September 2026.
Download the Complete Dataset
The full dataset is available in CSV and Excel formats.
FRED Direct CSV Access
The underlying data is available from FRED under series code T10Y3M:
https://fred.stlouisfed.org/graph/fredgraph.csv?id=T10Y3M
Direct CSV Access — Eco3min Structured Dataset
https://eco3min.fr/dataset/yield-curve-10y-3m.csv
This URL returns the complete dataset in CSV format. It can be used directly in pandas, R, curl, or any data tool.
Using the Dataset in Python
import pandas as pd

url = "https://eco3min.fr/dataset/yield-curve-10y-3m.csv"
df = pd.read_csv(url, parse_dates=["date"])

print(df.head())
print(df["spread_10y_3m"].describe())
Using the Dataset in R
library(readr)

url <- "https://eco3min.fr/dataset/yield-curve-10y-3m.csv"
df <- read_csv(url)

head(df)
summary(df$spread_10y_3m)
Both examples load the dataset directly from the URL — no download or API key required.
Methodology
T10Y3M is computed by the Federal Reserve as the arithmetic difference between the 10-year US Treasury constant maturity yield (FRED series DGS10) and the 3-month Treasury bill secondary market rate (FRED series DTB3), expressed in percentage points. The constant maturity yields are themselves derived from the Treasury’s daily yield curve, which fits a piecewise model to outstanding Treasury issues; the 3-month bill rate is the market-quoted secondary rate, not the auction rate.
The series is published daily by the Board of Governors of the Federal Reserve System as part of the H.15 statistical release, typically around 4:15 PM Eastern Time on each US business day. Reference release: the Federal Reserve’s H.15 selected interest rates release. The series is not seasonally adjusted, is not revised once published, and contains no observations on weekends or US federal holidays. Eco3min mirrors FRED with an automated pull cadence.
Data Quality & Provider Notes
T10Y3M is among the most reliable and stable series in the FRED catalogue: it is computed mechanically from two daily Treasury reference rates published by the Federal Reserve under the H.15 release, with no judgment, no estimation, and no revision policy. The series is suitable for automated quantitative pipelines without manual reconciliation.
- Release latency. The Federal Reserve publishes the underlying H.15 components around 4:15 PM Eastern Time on each US business day; T10Y3M is typically available on FRED within minutes after the underlying components are released. Eco3min mirrors FRED with a daily automated pull.
- Revisions policy. The series is not revised once published. Both components (DGS10 and DTB3) are market-observed reference rates, so corrections beyond same-day data-feed fixes are extremely rare.
- Alternative sources. Bloomberg, Refinitiv (LSEG) and Haver Analytics distribute the same H.15 components under their own tickers, with intraday refresh rather than the once-daily FRED snapshot. ALFRED (FRED’s vintage archive) provides historical real-time snapshots of T10Y3M for reproducibility of backtests.
- Known gaps. The series contains no observations on weekends or US federal holidays — expect roughly 251 to 253 observations per calendar year. The 3-month bill leg uses the secondary market rate; in episodes of severe bill scarcity (e.g., late 2008, early 2020), the secondary rate can dislocate briefly from the auction rate.
Before running historical regressions on T10Y3M, verify the last observation date on FRED to confirm the most recent business-day update has been pulled into your local copy.
Common Pitfalls When Using T10Y3M
T10Y3M is widely used as a recession indicator but several recurring interpretation errors distort the signal, particularly in tactical or short-horizon analyses.
- Confusing the daily reading with the NY Fed model input. The Federal Reserve Bank of New York’s official recession probability model uses the monthly average of T10Y3M, not the daily reading. The daily series is considerably noisier, and brief intraday or single-day inversions historically have not coincided with the model’s recession signals.
- Treating mild and deep inversions as equivalent. A T10Y3M reading of −0.10pp and one of −1.50pp carry very different historical signal weight. Empirical studies of post-1968 US cycles have documented that both the depth and the persistence of inversion correlate with subsequent recession probability, not just the binary inverted/non-inverted state.
- Reading the inversion as a market timing signal. The lead time between T10Y3M inversion and NBER recession start has historically ranged from approximately 6 to 18 months across post-1968 cycles, with significant variance. Using inversion timing for directional positioning has produced inconsistent results across observers; the signal is about regime change, not timing.
- Forgetting that the spread does not measure recession depth. T10Y3M is a probability signal, not a magnitude signal. The 1980 and 1981 inversions were among the deepest on record but were followed by recessions of very different durations and depths. The series captures the conditional probability of recession occurrence, not its eventual severity.
Historical Regimes
1982–1989 — Post-Volcker normalization. Following the deep inversions of 1980 and 1981 (which preceded the 1980 and 1981–1982 recessions), T10Y3M recovered into positive territory as the Volcker disinflation succeeded. The spread averaged approximately +2 percentage points through the mid-1980s, consistent with a normalizing term structure and falling inflation expectations.
1989–1990 — First post-Volcker inversion. T10Y3M inverted briefly in mid-1989 ahead of the July 1990 NBER recession. The inversion was shallow (−0.3 to −0.5pp) and short-lived, but the recession that followed validated the signal. This episode established the post-1980 pattern of brief inversions preceding US recessions.
2000–2001 — Dot-com inversion. T10Y3M inverted in mid-2000 as the Fed raised rates to slow the equity bubble. The March 2001 recession followed within roughly 9 months. The inversion coincided with the equity peak in March 2000 by a few months, though the relationship between the spread and equity markets is not mechanical.
2006–2007 — Pre-GFC inversion. T10Y3M inverted in mid-2006 and remained inverted for over a year before the December 2007 NBER recession start. This was one of the longest pre-recession inversions on record. The 10-year Treasury yield remained anchored around 4.5–5% while the 3-month bill rose to over 5% under the Bernanke tightening cycle.
2008–2019 — Extended positive regime. Following the GFC and the introduction of zero interest rate policy plus large-scale asset purchases, T10Y3M remained positive for over a decade, often in the +1 to +3pp range. The 3-month leg was pinned near zero by Fed policy while the 10-year yield reflected term premium and growth expectations.
2019 — Brief pre-COVID inversion. T10Y3M inverted briefly in mid-2019, ahead of the February 2020 COVID recession. The signal was noisy and was largely dismissed at the time given the absence of obvious cyclical strain; in hindsight, the inversion preceded the recession by approximately 8 months, in line with the historical range.
2022–2024 — Deepest inversion since 1981. The Fed’s aggressive 2022–2023 hiking cycle drove the 3-month bill above 5% while the 10-year yield lagged, producing a T10Y3M inversion that exceeded −1.5pp at its trough — the deepest reading since 1981. The inversion persisted from late 2022 through mid-2024, longer than any prior post-1980 episode. The relationship between this inversion and subsequent growth dynamics is analysed in the NY Fed recession probability model study, which uses T10Y3M as its central input.
2024–2026 — Post-inversion re-steepening. As the Fed began its rate-cutting cycle in late 2024, T10Y3M re-steepened sharply. Historically, the re-steepening from a deep inversion has often coincided with the onset rather than the avoidance of recession, though the post-2024 sequence is still being analysed and remains an open empirical question.
Related Macroeconomic Datasets
T10Y3M is mechanically constructed from two Treasury reference rates and sits at the heart of a network of related series — its two components, the broader yield curve, and the Fed’s policy rate that drives the short leg.
- US 10-Year Treasury Yield (DGS10) — The long-end component of T10Y3M; reflects growth, inflation expectations, and term premium.
- US 3-Month Treasury Bill (DTB3) — The short-end component; tightly anchored to the current Federal Funds rate.
- 10Y–2Y Treasury Spread — The alternative recession spread; tends to invert earlier but with more false signals than T10Y3M.
- US 2-Year Treasury Yield (DGS2) — Embeds market expectations of future Fed moves; useful for comparing T10Y3M and T10Y2Y signals.
- US 30-Year Treasury Yield (DGS30) — The very long end; extends the term structure analysis beyond the 10-year.
- Federal Funds Rate (FEDFUNDS) — The policy rate that drives the short leg of T10Y3M through bill market arbitrage.
Macroeconomic Dataset Hub
This dataset is part of the Eco3min macro-financial data repository.
Explore the Eco3min Dataset Hub
Sources
- Federal Reserve Bank of St. Louis — FRED database (series T10Y3M, DGS10, DTB3)
- Board of Governors of the Federal Reserve System — H.15 Selected Interest Rates
- Federal Reserve Bank of New York — Yield curve and recession probability research
Dataset Reference
Last updated — 21 September 2026
Disclaimer – Financial Information: The analyses, commentary, and content published on eco3min.fr are provided for informational and educational purposes only. They do not constitute investment advice or a solicitation to buy or sell financial instruments. Past performance is not indicative of future results. All investment decisions involve risk and are the sole responsibility of the reader.
Source terms. This series is produced by the Federal Reserve Bank of St. Louis and retrieved from FRED, where it carries the "Copyrighted: Citation required" status. FRED allows commercial use and display provided attribution is given both to the originating source and to FRED. Eco3min cannot sub-license it under Creative Commons: anyone reusing this file remains bound by the FRED terms, not by CC BY. Full terms.