
Do pump prices rise faster than they fall? A 21-year test on French data
Few beliefs about markets are as widely held as this one: pump prices shoot up like rockets when crude surges, then drift down like feathers when it retreats. Eco3min tested that asymmetry on 1,114 weeks of official French price data, from 2005 to 2026. The verdict is more nuanced than the popular indictment, and more interesting. Transmission lags of this kind are part of what the commodity regimes shaped by physical constraints and the energy transition look like from the consumer’s end.
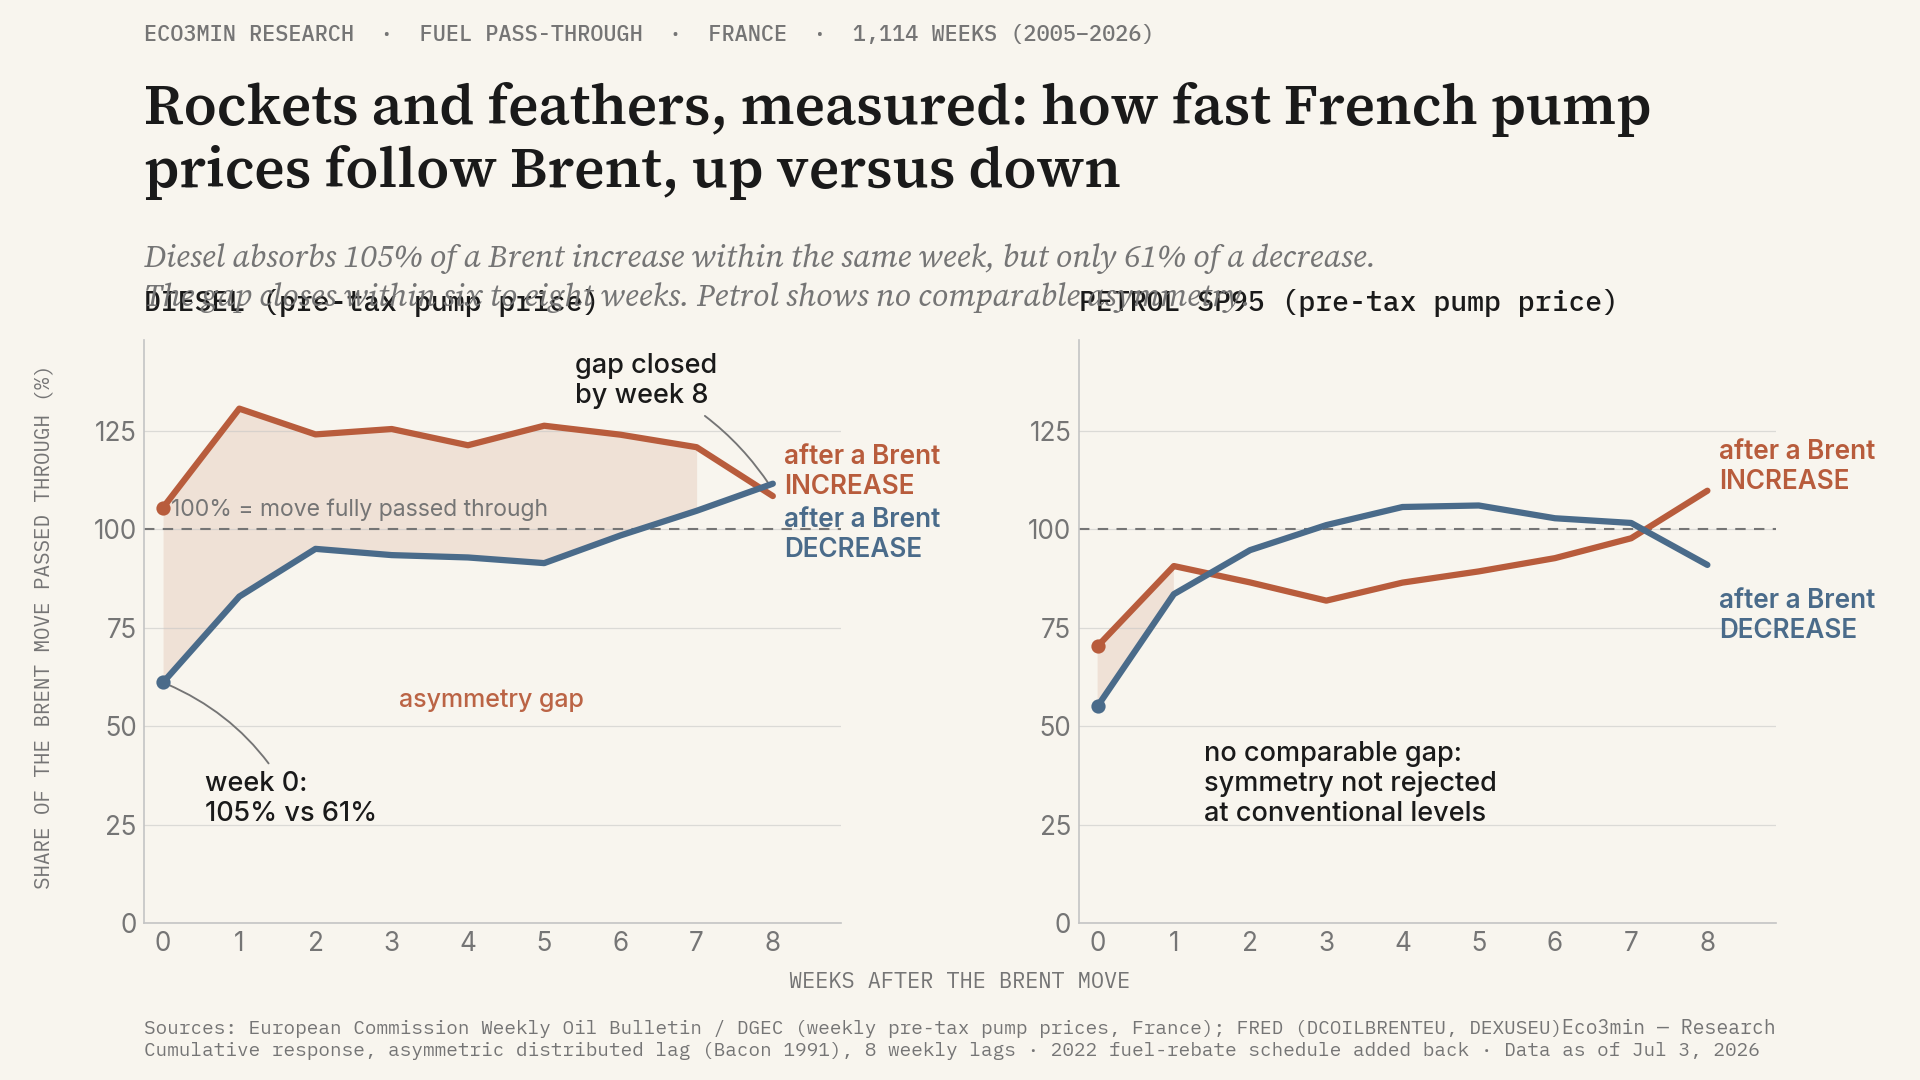
Across 1,114 weeks of official data, French diesel passes through 105% of a Brent increase within the same week, but only 61% of a decrease. The gap closes within six to eight weeks.
- Petrol shows no comparable asymmetry: over 21 years, symmetry is not rejected at conventional levels for SP95 (joint test, p = 0.10).
- Both directions converge to full pass-through: the lag lasts weeks, and the data show no permanent overcharge.
- The diesel asymmetry has widened since 2020: the same-week pass-through gap was 0.18 over 2005–2019 versus 0.69 over 2020–2026.
A motorist’s intuition that became an academic literature
The suspicion is not folk paranoia. In 1991, the economist Robert Bacon documented, on the British petrol market, a faster transmission of crude increases than decreases, and named the pattern “rockets and feathers”. Dozens of studies have since looked for it in other markets, with contrasting results: the asymmetry shows up in some countries, for some fuels, in some periods, and vanishes elsewhere. The question remains empirically open, including for France.
The dominant consumer reading fits in one sentence: distributors would pass on quickly what helps them and slowly what hurts them. That reading deserves a serious test rather than a caricature, because perfectly competitive mechanisms can generate the same profile: tank inventory rotation, restocking costs, consumer search behavior. Commodity price formation is full of transmission lags that carry no whiff of foul play. Hence the protocol: measure first, interpret second.
The protocol: 1,114 weeks, pre-tax prices, 2022 rebates added back
Three official series feed the test. Weekly pump prices (Friday readings, mainland France excluding Corsica) come from the DGEC, the French energy directorate, via the European Commission’s Weekly Oil Bulletin, from January 2005 to July 2026. Daily Brent (FRED, series DCOILBRENTEU) is converted into euros per litre using the EUR/USD rate (FRED, DEXUSEU), then averaged over the week preceding each reading, which is the DGEC’s own convention.
Two methodological traps are handled upstream. The first is fiscal: France’s per-litre excise duty is a fixed amount, so testing asymmetry on tax-inclusive prices would mechanically dampen percentage variations. The whole test therefore runs on pre-tax prices, published directly by the DGEC. The second involves the 2022 fuel rebates: inspection of the series shows that the published pre-tax price absorbs the state rebate. The official schedule (15 euro cents per litre pre-tax from April 1 to August 31, 2022; 25 cents from September 1 to November 15; 8.33 cents from November 16 to December 31, per decrees 2022-423, 2022-1168 and 2022-1355) is therefore added back into the series. A variant that simply excludes the April 2022 to January 2023 window serves as a control.
The method is Bacon’s: a regression of the weekly change in pump prices on Brent changes over the preceding eight weeks, with increases and decreases entered separately. The cumulative sum of coefficients gives, at each horizon, the share of the shock passed through. It is a plain linear regression, reproducible by any reader with the CSV published at the bottom of this page. No error-correction model: the long-run relationship is too fragile over a period crossed by fiscal breaks to justify that layer of complexity.
The diesel verdict: the rocket is real, and it lands
In the same week as a Brent increase, pre-tax diesel passes through 105% of it, a slight overshoot consistent with the pro-cyclical behavior of diesel margins. In the same week as a decrease, it passes through only 61%. The gap is statistically clear over the first two weeks (0.44 then 0.48, with bootstrap intervals excluding zero), and the joint symmetry test is rejected (p = 0.011).
Then the feather catches up with the rocket. By week eight, both directions converge to full pass-through (108% after increases, 112% after decreases, a 3-point gap that is not significant). Pump prices rise like rockets, fall like feathers, and land in the same place. On a 10-cent Brent decline, roughly 4 cents per litre are “missing” at the pump in the first weeks, and arrive within six to eight weeks. The phenomenon is a timing lag, not a permanent levy: that is precisely what the data can settle, and what the public debate rarely does.
The profile survives the controls. Excluding the 2022 rebate window, on the raw series: p = 0.0002. Excluding interpolated weeks (the Bulletin’s early-January gaps): p = 0.005. With twelve weekly lags instead of eight: p = 0.005. And the asymmetry holds in both shock-size classes: after large weekly Brent increases (2 euro cents per litre or more, 77 weeks), same-week pass-through reaches 1.14, against 0.66 after large decreases (96 weeks).
One secondary result deserves attention: the asymmetry has widened. Over 2005–2019, the same-week pass-through gap was only 0.18 (p = 0.043). Over 2020–2026, it reaches 0.69. The COVID and Ukraine years, with shocks of unusual size and logistical strain, amplified the pattern, though the data cannot separate a behavioral explanation from a pure volatility effect.
The rockets-and-feathers asymmetry is real for diesel, transitory by construction, and absent for petrol: a lag of a few weeks, not a permanent overcharge.
The twist: petrol never takes off
The same test applied to SP95 petrol over the same 1,114 weeks finds nothing comparable. The initial gap (0.15) is not significant, and at horizons of three to five weeks it even turns negative: decreases then transmit slightly faster than increases. SP95-E10, available as a series since 2020, traces the same profile. The rockets-and-feathers indictment, as argued in public debate, targets “fuel” indiscriminately: French data support it only for diesel, and only for a few weeks. For readers watching the American side of the same question, the US on-highway diesel retail price series offers the equivalent raw material since 1994.
What the asymmetry does not prove
An honest qualification is needed on three fronts. First, a two-week lag is exactly what mechanisms without market power would produce: station tanks turn over every ten to twenty days for small outlets, and a distributor selling inventory bought at higher prices passes a decline through with the delay of its rotation. Consumer-search theory points the same way: when prices rise, motorists compare more, which speeds up alignment on the way up.
Second, the test measures transmission from crude to pump, a journey that aggregates refining and distribution. Refined-product quotes are licensed data, so open sources cannot locate the asymmetry along the chain: it may sit at the refining stage, where margins weigh more than the barrel in oil profits, as the American 3-2-1 crack spread illustrates (daily data since 1986). Third, the national weekly average masks local heterogeneity: motorway stations, hypermarkets and independents do not face the same competition, and one large distributor’s private rebate in late 2022 stays buried in the average.
Method, data and reproduction
The full weekly CSV (Brent in euros per litre, raw and rebate-adjusted pre-tax prices per fuel, interpolation and transition flags) is downloadable below, together with the estimated pass-through curves for all seven specifications. The regression reads: weekly pump-price change on a constant and positive and negative Brent changes at lags 0 to 8, Newey-West robust errors, intervals from a 13-week block bootstrap (2,000 draws). The Bulletin’s 49 missing weeks (mostly the first week of January) are linearly interpolated and flagged; excluding them does not change the verdict. Prices: European Commission Weekly Oil Bulletin, data reported by the DGEC, open reuse licence. Brent and FX: FRED, series DCOILBRENTEU and DEXUSEU, data as of July 3, 2026.
Download the weekly CSV (2005–2026) · Download the estimated pass-through curves
To place those cents in a household budget, the fuel burden calculator converts a pump-price level into a share of income.
FAQ
Is the “rockets and feathers” asymmetry demonstrated in France?
For diesel, yes, over 2005–2026: 105% of a Brent increase is passed through in the same week against 61% of a decrease, with a gap that is significant for two weeks and closes within six to eight. For petrol, symmetry is not rejected at conventional levels over the same period.
Why test pre-tax prices rather than prices at the pump including tax?
France’s per-litre excise duty is a fixed amount: it mechanically dampens percentage variations in the tax-inclusive price. Testing asymmetry on the tax-inclusive series would partly measure a fiscal artifact. The tool that rebuilds a French litre of fuel live covers an adjacent question. The DGEC publishes pre-tax prices directly, which isolate the market component.
Do the 2022 French fuel rebates distort the result?
Left untreated, they would: the published pre-tax price absorbs the state rebate. The study adds the official decree schedule back into the main series, and checks the result by excluding the affected window entirely: the diesel asymmetry is even sharper there (p = 0.0002).
Does this asymmetry durably cost motorists more?
The data show no permanent overcharge: by week eight, increases and decreases are fully passed through. The observable cost is transitory, on the order of 4 cents per litre for a few weeks on a 10-cent Brent decline, the time for transmission to complete.
The question open data cannot yet settle remains: at which link of the chain, refining or distribution, does the diesel lag form? If refined-product quotes ever became public, the journey from barrel to tank could be sliced, and the file Bacon opened thirty-five years ago could finally be closed.
Last updated — 18 September 2026
Disclaimer – Financial Information: The analyses, commentary, and content published on eco3min.fr are provided for informational and educational purposes only. They do not constitute investment advice or a solicitation to buy or sell financial instruments. Past performance is not indicative of future results. All investment decisions involve risk and are the sole responsibility of the reader.