
Refining Margins: The Hidden Driver of Oil Profits
How refining margins drive oil profits and why this discreet lever — beyond crude prices — has become central to energy markets and corporate earnings.

Understanding how refining margins drive oil profits and why this discreet lever has become central to energy markets.
TL;DR
Crude prices alone no longer explain oil-major profits: the decisive variable sits downstream, in refining margins — the spread between crude cost and finished-product prices. Companion analysis: our analysis of commodities as macroeconomic regime signals.
- A barrel near $80 can produce very different earnings depending on whether the refining margin runs at $5 or $20 — crude sets the context, margins set the outcome.
- Tighter global refining capacity and stricter environmental standards have lent these margins durable support since 2022.
- Demand shifts, monetary policy and geopolitical tensions can reverse the dynamic quickly — volatility is part of the regime, not noise.
Refining margins: the real barometer of oil profits
Since 2022, oil company results have often been analysed through a single lens: the price of crude. Yet crude is not always what explains most of the profitability picture.
In many market phases, the determining variable lies further down the value chain: refining margins—the gap between the cost of crude and the price of finished products (gasoline, diesel, jet fuel).
A barrel hovering around $80 can coexist with very different profit outcomes depending on whether the refining margin sits at $5 or $20 per barrel. Put differently, crude provides a contextual signal; refining margins often determine the operational reality.
Understanding this mechanism helps make sense of oil company earnings, pump-price variations and the sector’s market reactions.
Crude prices shape expectations; refining margins shape outcomes.
What refining margins actually change
Market consensus often focuses on Brent or WTI prices to gauge the health of oil majors. The breakdown is provided in this question on oil refining margins crack spread. In practice, a large share of their profitability hinges on a far less visible indicator: refining margins—the gap between the purchase cost of crude and the sale price of finished products (gasoline, diesel, jet fuel, heating oil, petrochemicals). Related coverage: the energy-money signal embedded in the gold-oil spread.
A simple illustrative example: with crude near ≈80 $ per barrel, a $5 refining margin can leave a refinery barely profitable, while a $20 margin turns the same facility into a cash machine, with no meaningful change in volume. The central question therefore is not just “where does the barrel trade”, but “how much is left between the crude and the gas pump”.
How refining margins are formed
Refining margins can be approximated by standardised indicators (the 3‑2‑1 crack spread or gasoline/diesel cracks), but the underlying economic mechanism remains the same:
- Cost side: crude price, energy used in the refinery (often natural gas or electricity), capital cost, environmental compliance costs.
- Revenue side: gasoline, diesel and jet fuel prices, themselves driven by local demand, season, inventories and logistics.
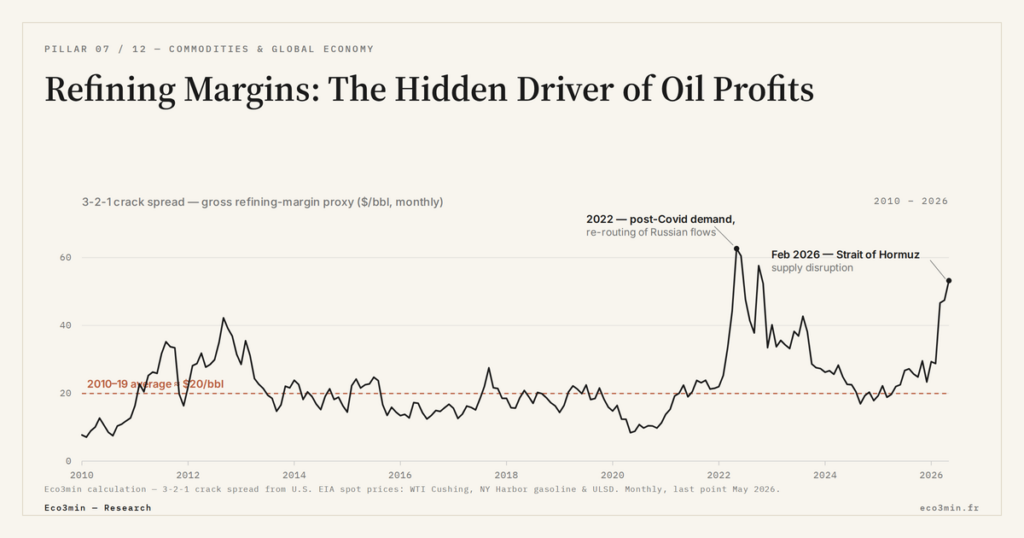
Historically, over the 2010‑2019 period, many estimates place “average” refining margins in a ≈5 to 10 $ per barrel range for simple configurations, somewhat higher for complex refineries capable of processing heavy crudes. Between 2022 and 2023, several regions saw margins briefly exceed 25 to 30 $ per barrel—a level that significantly boosted integrated oil company results.
An industrial asset highly sensitive to macro and energy cycles
Refining margins respond to a combination of macro and micro factors:
- Interest rates and capital cost: since the monetary tightening cycle began in 2022, financing costs for new capacity have risen meaningfully. This limits major new projects, which in turn keeps refining supply relatively constrained.
- Energy inflation: more expensive natural gas raises operating costs for refineries, compressing net margins if fuel prices do not follow.
- Currencies: most oil flows are dollar-denominated. A European refiner pays for crude in dollars but sells part of its output in local currency. A strong dollar can compress local profitability, even if dollar-based theoretical margins look high.
These parameters explain why two refineries operating in different currency zones can post very divergent performance even when processing crude of comparable quality.
To place these profitability gaps in a more structural reading, it is useful to connect them to commodity real cycles and their role in macro transmission, where the issue extends beyond crude prices alone to physical constraints, investment and economic policy trade-offs.
Why refining margins have regained strategic importance
Several recent signals lend renewed weight to refining margins:
- Limited capacity: between 2020 and 2023, part of the global fleet was shut down or converted (bio‑refineries, sustainable fuels units), while road and aviation fuel demand rebounded faster than expected.
- Stricter environmental standards: the investments needed to adapt refineries (sulphur, emissions, marine fuels) raise fixed costs.
- Geopolitical tensions on flows: Red Sea‑related rerouting, sanctions on certain exporters, and the reshaping of refined product trade routes generate regional price premia.
The dominant consensus often holds that these tensions are temporary and that EV adoption will quickly reduce liquid fuel demand, returning refining margins to their historical average. An alternative reading suggests that the combination of scarcer capacity, higher regulatory costs and geopolitically fragmented flows can sustain margins that are more volatile but structurally higher than pre-2020.
To set these dynamics in the broader context of economic cycles and energy prices, a dedicated overview of commodities in the global economy provides a useful foundation.
Historical context: when margins matter more than the barrel
Over the past two decades, several episodes have shown that refining margins can be more decisive than crude prices for oil profits:
- 2005‑2007: strong US gasoline demand and domestic capacity constraints generated high margins despite an already rising barrel.
- 2015‑2016: after the crude price drop tied to US shale, well‑positioned refineries maintained solid results thanks to attractive price differentials between local crudes and exported products.
- 2022: the post‑Covid recovery, combined with the readjustment of Russian flows, triggered an episodic “super‑cycle” in refining margins, with peaks more visible on diesel and jet fuel.
An often‑underestimated point: margins vary significantly by product. The same refinery can see revenues lifted by diesel while gasoline margins soften, or the reverse, depending on the season and public policy (taxation, emissions standards, strategic reserves).
Concrete indicators to watch
To put these dynamics on solid ground, several indicators offer a good entry point:
- Crack spreads (gasoline, diesel, 3‑2‑1, etc.): the gap between crude and a basket of refined products, expressed in $/barrel. A rapid rise signals tension on refining capacity.
- Refinery utilisation rates: when sustained above ≈90 % in a region for several months, this points to a tight market conducive to high margins.
- Product inventory levels: low diesel or jet fuel inventories during high‑demand periods create price leverage.
These indicators take their full meaning when set against general monetary policy and rate spreads, as illustrated by the analytical framework on real policy rates and risk assets.
What many readers really want to understand
Behind the recent attention paid to refining margins, the implicit question is twofold: are the high profits observed since 2022 an aberration or the symptom of a new regime, and is that regime more risky for both companies and consumers? Put differently, the issue is not whether margins rise or fall in the short term, but whether the structure of the refining market makes results more volatile and more sensitive to macroeconomic shocks.
Interactions with macroeconomics and rates
Refining margins sit at the crossroads of several macro forces:
- Global growth: real global GDP growth around ≈2.5 % to 3 % per year (orders of magnitude observed for 2023‑2025 across aggregated forecasts) sustains transport demand and therefore fuel demand.
- Monetary policy: positive real policy rates weigh on durable goods demand (vehicles, leisure aviation) but also slow investment in new refining capacity.
- Capital flows: when investors turn away from long‑cycle assets (heavy infrastructure, hydrocarbon projects), the sector’s capital cost rises, which can lead to future undersupply.
A regular macroeconomic bulletin, such as the monitoring barometer for major equilibria, helps locate refining margins within a broader landscape of growth, inflation and rate tensions.
Common interpretation errors
- Stopping at Brent prices: reducing oil profits to the barrel alone masks the sometimes dominant effect of refining margins. A period of stable crude can coincide with surging product margins.
- Extrapolating an exceptional margin: projecting the 2022‑2023 peaks as a new norm would ignore the inherent cyclicality of refining; these phases often reflect transitory imbalances.
- Ignoring the regional dimension: an attractive margin in Europe does not imply the same situation in Asia or the Americas, given differences in product mix, regulations and currencies.
Three possible trajectories for refining margins
1. Gradual normalisation but above the old regime
This scenario, close to consensus, assumes still‑solid fuel demand over the next 3 to 5 years, but a partial rebuild of capacity (reopenings, optimisations, targeted new units). Margins ease from the 2022 peaks, while remaining slightly higher than in 2010‑2019. This regime would still be volatile, with marked seasonal peaks (winter for diesel, summer for gasoline).
2. Structurally elevated volatility
Under this hypothesis, investment constraints (higher rates, regulatory uncertainty, ESG pressure) genuinely limit major new projects. Liquid fuel demand falls more slowly than expected, particularly in emerging markets. Each geopolitical or logistical shock (temporary closure, embargo, maritime tension) translates into more violent and more frequent margin swings. Oil company results become more dependent on policy decisions and the stability of trade routes.
3. Accelerated energy transition and pressure on margins
An alternative scenario rests on faster‑than‑expected adoption of EVs, alternative fuels and energy efficiency policies. Refined product demand plateaus, or even durably declines in advanced economies. Competition between refineries to clear volumes intensifies, pulling margins lower, particularly for the least efficient facilities. This scenario would likely come with a wave of closures and unit conversions to other uses (biofuels, chemicals, hydrogen).
These three trajectories are not mutually exclusive: different regions can find themselves in distinct regimes at the same time, complicating the global reading of margins.
Practical implications by stakeholder
For investors
Refining margins reshape oil company sensitivity to economic cycles and rates. In an environment of durably positive real rates, capital‑intensive segments with volatile margins become more exposed to a cycle turn, particularly if the market focuses solely on crude prices and underweights this operational risk.
For energy‑intensive companies
Sectors heavily dependent on fuels (road transport, logistics, aviation) directly absorb refining margin volatility through their fuel bills. A few cents per litre rise, following a margin tightening, can shift operating costs by several percentage points for these players, sometimes faster than their ability to adjust final prices. Related dataset: our heating oil spot price record.
For households
For households, refining margin volatility translates into pump prices that can disconnect from the crude narrative. A stable barrel does not preclude a more expensive fill‑up if local diesel or gasoline markets are tight. Perceived energy inflation then depends as much on refining margins as on crude price moves. Margins and barrel prices diverging in this way also decouple sector earnings from the headline oil price, one of the mechanics behind the underperformance of energy equities across transition periods.
Indicators to keep under surveillance
- Gap between crack spreads and crude prices: a rapidly widening gap signals supply/demand tension on refined products.
- Regional refinery utilisation rates: a sustained reading above 90 % reflects a market running close to its physical limit.
- Closure or conversion decisions: each announcement potentially removes tens of thousands of barrels per day of capacity, with cumulative effects over several years.
- Direction of real rates and the dollar: through capital costs and crude import costs, these variables play a discreet but decisive role in profitability.
The most extreme scenario does not necessarily prevail, but refining margins are a less visible risk than other energy segments—and therefore easier to underestimate. Current imbalances may persist longer than the central scenario assumes for many participants, particularly in a fragmented world where geopolitics reshapes commodity flows.
In three sentences
- Refining margins are now as important a lever as crude prices for understanding oil profits.
- Limited capacity, regulatory costs and geopolitical tensions create a margin regime that is more volatile and potentially higher than before 2020.
- Ignoring these margins amounts to underestimating the oil sector’s sensitivity to macroeconomic shocks and energy policy decisions.
Frequently asked questions on refining margins
Do refining margins always follow crude prices?
No, the correlation is far from perfect. A falling barrel can coincide with rising margins if refining supply is constrained or if finished‑product demand is particularly strong in a given region.
Why do margins vary so much between diesel and gasoline?
Each product responds to different demand: passenger cars, road haulage, aviation, industrial use. When diesel or jet fuel demand surges while capacity does not match, that product’s specific margin can decouple sharply from gasoline.
How do climate policies affect refining margins?
They typically raise fixed costs (emissions standards, investments for cleaner fuels) and may reduce demand over the long term. In the short term, these constraints can also limit available supply, supporting margins as long as liquid fuel demand remains high.
Are refining margins more important for integrated majors or for pure refiners?
They matter for both, but differently. Integrated majors can offset weaker refining margins through upstream (exploration‑production) earnings, whereas refining‑focused players are directly exposed to these cycles.
Is there a margin threshold above which a refinery becomes “highly profitable”?
There is no universal level, since it depends on capital cost, technical configuration and local constraints. In practice, many analyses consider that beyond about ten dollars per barrel sustained over a prolonged period, a well‑managed refinery sits in a high‑profitability zone.
Last updated — 22 July 2026
Disclaimer – Financial Information: The analyses, commentary, and content published on eco3min.fr are provided for informational and educational purposes only. They do not constitute investment advice or a solicitation to buy or sell financial instruments. Past performance is not indicative of future results. All investment decisions involve risk and are the sole responsibility of the reader.
Read next
Full pillar →Reading the refinery utilisation rate: the threshold, the season, the turnarounds
A refinery runs full near ninety percent, not a hundred: the last slice of nameplate capacity is a…
IMO 2020: the regulatory shock that rewrote product spreads
An environmental rule on marine sulfur can move a refining spread more than a swing in crude. IMO…
The 2022–2023 refining golden age: anatomy of an episode
In 2022, refined fuel prices climbed faster than crude. That gap, measured by the 3-2-1 crack spread, reached…


