
Bitcoin and Inflation: An Empirical Test of the Store-of-Value Narrative
The “digital gold” narrative claims Bitcoin protects against inflation. The empirical record over 2014-2024, and especially the 2022 stress test, shows the relationship is statistically weak and economically driven by something else: real-rate liquidity cycles.
Bitcoin’s price moves are dominated by global liquidity conditions, not by realised consumer-price inflation. When real rates fell to historic lows during 2020-2021, Bitcoin rallied 15-fold; when real rates rose sharply during 2022, Bitcoin fell while CPI inflation peaked. The underlying detail is gathered in our panoramic view of inflation.
The contradiction matters. If Bitcoin were a clean inflation hedge, the 2022 episode, the strongest U.S. inflation print in forty years, should have been its finest hour. Instead, Bitcoin lost roughly 65% of its dollar value while CPI peaked at 9.1%. This article walks through what the literature tested, what the 2014-2024 sample actually shows, and why “store-of-value” is the wrong frame.
What the literature tested
Bouri, Gupta, Tiwari and Roubaud (2017, Finance Research Letters) ported the Baur-Lucey safe-haven test to Bitcoin, separating three roles: hedge (negative correlation with the asset over the full sample), safe haven (negative correlation conditional on extreme down-moves of the reference asset), and diversifier (low positive correlation). Their conditional GARCH framework allowed time-varying tests, exposing the difference between sample-average behaviour and crisis-period behaviour. The same framework was extended by Conlon, Corbet and McGee (2020) to compare Bitcoin and gold during the March 2020 COVID stress.
Yermack (2013, NBER working paper, “Is Bitcoin a Real Currency?”) was the first systematic academic test. He examined whether Bitcoin satisfied the textbook three functions of money (medium of exchange, unit of account, store of value) and concluded that the volatility of Bitcoin’s exchange rate against major currencies was an order of magnitude higher than that of any traded fiat currency, undercutting the store-of-value claim at horizons under several years.
Bhambhwani, Delikouras and Korniotis (2023, Review of Asset Pricing Studies) ran cross-sectional asset-pricing tests on cryptocurrencies and identified network factors and computing power as dominant return drivers — neither of which has a mechanical link to consumer-price inflation. Choi and Shin (2022) tested the response of Bitcoin returns to inflation surprises in a structural VAR and found a positive but statistically small response, with the persistence dominated by other shocks.
The 2014-2024 sample tells one story
Over the full data window since the second-generation crypto exchanges came online (roughly 2014, when Bitcoin liquidity reached institutional thresholds), the contemporaneous correlation between monthly Bitcoin returns and U.S. CPI year-on-year inflation has hovered around plus 0.05, statistically indistinguishable from zero. The correlation between Bitcoin returns and the 2-year U.S. real Treasury yield is negative and far more economically significant, running between minus 0.30 and minus 0.55 depending on the rolling window and the period.
The asymmetry between these two correlations is the structural finding. Bitcoin behaves as a long-duration risk asset with high beta to liquidity conditions, not as a consumer-price hedge. The 2017 rally, the 2020-2021 super-cycle, and the 2024 recovery all coincided with phases of falling or low real yields. The 2018 and 2022 drawdowns coincided with rising real yields. Bitcoin and liquidity cycles formalises this regime mapping in detail.
The 2022 natural experiment
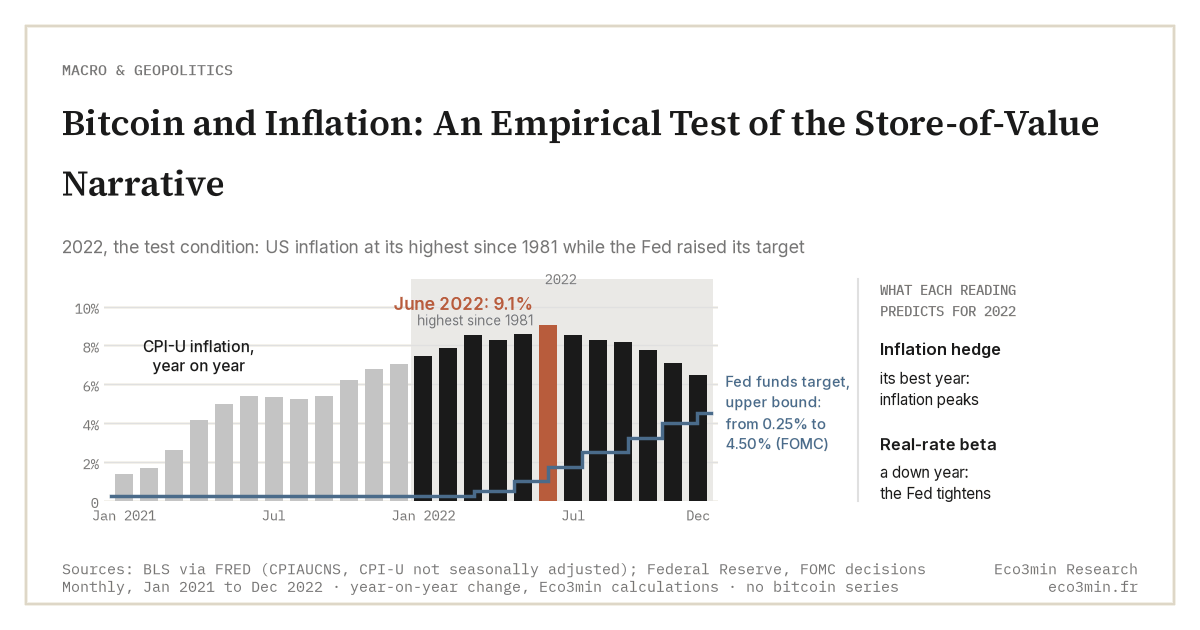
The 2022 sequence is the cleanest stress test of the inflation-hedge narrative. From January to October 2022, U.S. CPI inflation ran at 7-9% year-on-year, the highest reading since 1981. The peak came in June 2022, at 9.1% on the BLS CPI-U index (not seasonally adjusted), and the FOMC’s seven rate increases ran from March to December of that year. If Bitcoin were a pure inflation hedge, this should have been a strongly positive year for Bitcoin returns. The opposite happened: Bitcoin fell from roughly USD 47,000 at the start of the year to roughly USD 16,500 by November, a drawdown of more than 65%. Gold finished the year roughly flat in dollar terms; Bitcoin lost two-thirds.
The mechanism is the one that drove gold during the same period. The Federal Reserve raised the federal funds rate from 0.25% to 4.50% in nine months while inflation expectations remained anchored, pushing the 2-year U.S. real Treasury yield from minus 4% to plus 1.5% — the largest real-rate shock since the TIPS market opened in 1997. Long-duration risk assets (including high-multiple equities, growth tech, and Bitcoin) sold off in proportion to their duration sensitivity. The CPI print was a coincident variable, not the driver. Negative real rates and their consequences documents the regime in which Bitcoin had thrived.
The “digital gold” comparison fails empirically
The “Bitcoin = digital gold” framing implies the two assets share macro behaviour. Empirically, gold and Bitcoin diverge sharply in stress events. In the March 2020 COVID dash-for-cash, gold fell roughly 12% over two weeks before recovering; Bitcoin fell roughly 50% over the same window. In the 2022 stagflation episode, gold finished roughly flat while Bitcoin lost two-thirds. The two assets share a directional response to real rates but have very different risk-adjusted profiles.
Conlon, Corbet and McGee (2020) directly tested the “digital gold” claim during the March 2020 COVID stress and rejected it. Bitcoin amplified portfolio drawdowns during the panic phase rather than dampening them. Gold provided modest diversification; Bitcoin did not. The authors framed this as a basic Markowitz analysis: Bitcoin’s high return correlation with risk assets in stress periods undercuts its diversification value, while gold’s lower stress-period correlation preserves it. The gold safe-haven analysis covers the comparable test for the metal.
What Bitcoin does respond to
Bhambhwani, Delikouras and Korniotis (2023) identified the dominant systematic risk factors for cryptocurrency returns. Network adoption proxies (active addresses, transaction volume, hashrate) explain a large share of the cross-sectional and time-series variation. Macro liquidity proxies (central bank balance sheets, the U.S. Treasury General Account drawdown, broad money growth) explain a second large share. Realised CPI inflation explains essentially nothing once these other factors are controlled for. The point is set out at length in the inflation regime overview.
The mechanism is intuitive once stated. Bitcoin has no cash flow. Its valuation is anchored by speculative demand and by network-effect dynamics. Speculative demand is sensitive to the cost of capital, when real rates rise, alternative assets pay a premium and crypto demand thins. Network-effect dynamics are sensitive to adoption cycles, which themselves correlate with macro liquidity. Crypto-assets, liquidity cycles and real rates traces the broader macro framework.
The structural break that institutional adoption brought after 2020 (corporate treasuries, ETF approval, regulated custody) has compressed but not eliminated the liquidity beta. The 2024 spot-ETF launch in the United States produced a step-change in flow architecture: BlackRock’s IBIT and similar vehicles channelled traditional institutional capital into Bitcoin via the standard ETF wrapper. The contemporaneous correlation with the Nasdaq 100 has actually tightened post-2020, hovering between 0.40 and 0.65 on a rolling-quarter basis. The asset has become more legible to traditional macro analysis precisely as it has lost claim to “uncorrelated alternative” status.
Where the protection narrative came from
The “Bitcoin protects against inflation” framing grew out of two sources. The first is the 21-million supply cap, which the Bitcoin protocol enforces algorithmically. Proponents extrapolated from “fixed supply” to “inflation hedge” by analogy with gold’s supply constraints. But supply constraint is necessary, not sufficient: gold’s supply is constrained too, and its inflation-hedge performance is weak at horizons under 10 years. The second source is the 2020-2021 super-cycle itself, in which Bitcoin rose 15-fold against a backdrop of rising consumer prices. Post-hoc, the narrative attributed the move to inflation. The 2022 reversal (same supply schedule, same protocol, much higher inflation) disconfirmed the framing without much narrative damage.
The deeper issue is the conflation of two distinct properties: monetary scarcity (the supply schedule) and consumer-price stability (the relationship between asset and CPI). A digital asset can have hard-coded scarcity yet still trade with high beta to liquidity conditions. The two properties are independent. Glaser, Zimmermann, Haferkorn, Weber and Siering (2014, ECIS proceedings) documented that early Bitcoin trading volumes were dominated by speculative motives rather than transactional motives, and the same pattern has persisted with institutional adoption: holding patterns track liquidity-provision cycles in TradFi markets more closely than they track transactional demand for the asset.
For investors comparing the empirical record across asset classes during inflationary periods, 100 years of stock data and savings and inflation trace the longer histories that crypto cannot offer. The Bitcoin sample is too short to make the same claims and contains only one full inflation cycle (2021-2023), which behaved against the inflation-hedge thesis.
- The contemporaneous correlation between Bitcoin returns and U.S. CPI inflation since 2014 is statistically indistinguishable from zero.
- The correlation between Bitcoin returns and the 2-year U.S. real Treasury yield is negative and economically significant (-0.30 to -0.55 depending on window).
- The 2022 episode (9.1% CPI peak, Bitcoin down 65%) disconfirmed the inflation-hedge narrative under the strongest test condition since Bitcoin’s launch.
- Bitcoin behaves as a long-duration liquidity-sensitive risk asset, not as a store-of-value comparable to gold (Yermack 2015, Conlon-Corbet-McGee 2020).
Bitcoin is not an inflation hedge: it is a real-rate beta. It rallies when real rates fall and sells off when they rise, regardless of where the CPI print lands.
For deeper background, see the complete inflation guide and the inflation regimes pillar that situates crypto within the wider regime framework. Real interest rates history provides the underlying real-rate trajectory that drives Bitcoin’s macro cycle.
Last updated — 6 October 2026
Disclaimer – Financial and Legal Information: The analyses, commentary, and content published on eco3min.fr are provided for informational and educational purposes only. They do not constitute investment advice or a solicitation to buy or sell financial instruments. Past performance is not indicative of future results. All investment decisions involve risk and are the sole responsibility of the reader. Data, charts and calculated series are provided as is and may contain errors or lag behind their source: check any figure against the primary source cited before relying on it. Content describing laws, regulations or contracts reflects the law as of its publication date and does not constitute legal or tax advice; applying it to a specific situation requires a qualified legal or tax professional.
Read next
Full pillar →Inflation and Demographics: The Invisible Pressure on Pensions
An inflation regime that lasts ten years redistributes wealth across generations as much as it does across income…
Inflation and the State: Why It Wins from Rising Prices
The state is the single largest beneficiary of an unanticipated inflation regime. The mechanism operates through three channels…
Wage-Price Spirals: Mechanism and Historical Lessons
Wage-price spirals: the self-reinforcing loop that turns a one-off shock into persistent inflation, and why the 2022-2024 episode…